
Articles
- Page Path
- HOME > Korean J Community Nutr > Volume 18(6); 2013 > Article
-
Original Article
- A Study on Dietary Behaviors, Health-Related Lifestyle of Adult Visitors at Public Health Centers in Gyeonggi Urban Area
- Jong-Sook Kwon, Kyungmin Kim, Hyun-Chang Seo, Yoonna Lee, Seunggeon Lim, Young-Sug Choi
-
Korean Journal of Community Nutrition 2013;18(6):611-625.
DOI: https://doi.org/10.5720/kjcn.2013.18.6.611
Published online: December 31, 2013
Department of Food & Nutrition, Shingu College, Seongnam, Korea.
1Department of Food & Nutrition, Baewha Women's University, Seoul, Korea.
2Department of Physical Therapy, Shingu College, Seongnam, Korea.
- Corresponding author: Jong-Sook Kwon, Department of Food & Nutrition, Shingu College, 377 Gwangmyeong-ro, Seongnam, Gyeonggi-do 462-743, Korea. Tel: (031) 740-1642, Fax: (031) 740-1590, jskwon@shingu.ac.kr
• Received: November 25, 2013 • Revised: December 18, 2013 • Accepted: December 24, 2013
Copyright © 2013 The Korean Society of Community Nutrition
This is an Open-Access article distributed under the terms of the Creative Commons Attribution Non-Commercial License (http://creativecommons.org/licenses/by-nc/3.0/) which permits unrestricted non-commercial use, distribution, and reproduction in any medium, provided the original work is properly cited.
- 1,629 Views
- 0 Download
- 2 Crossref
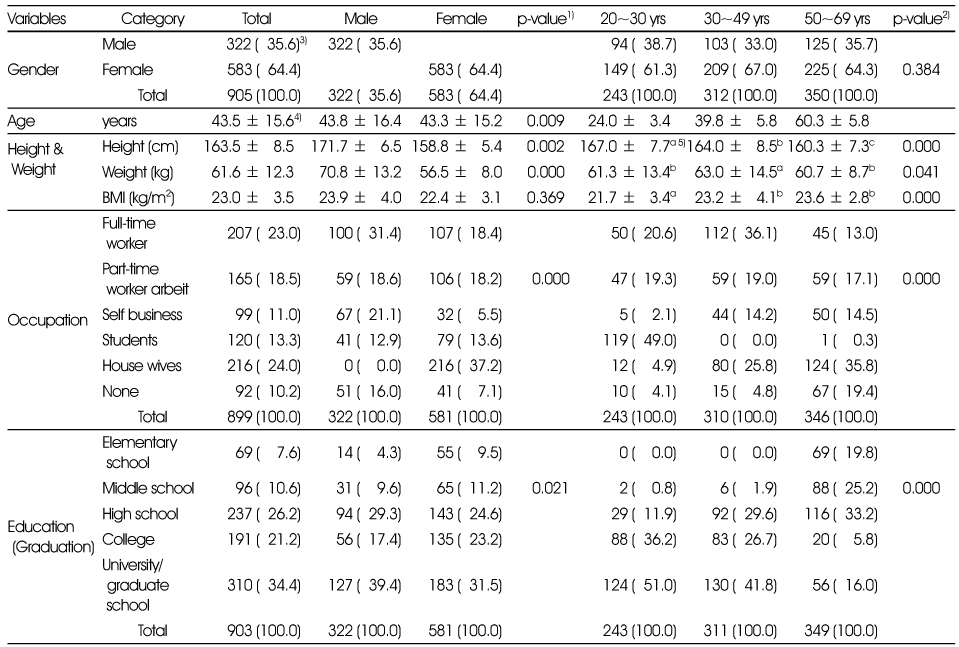
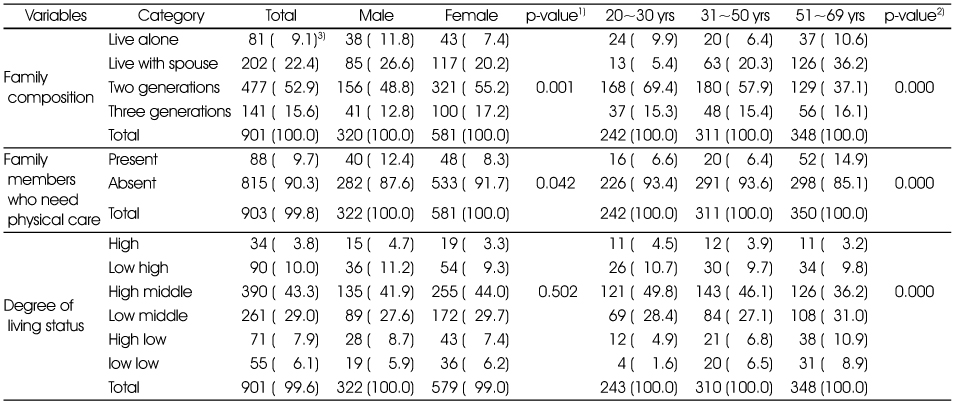
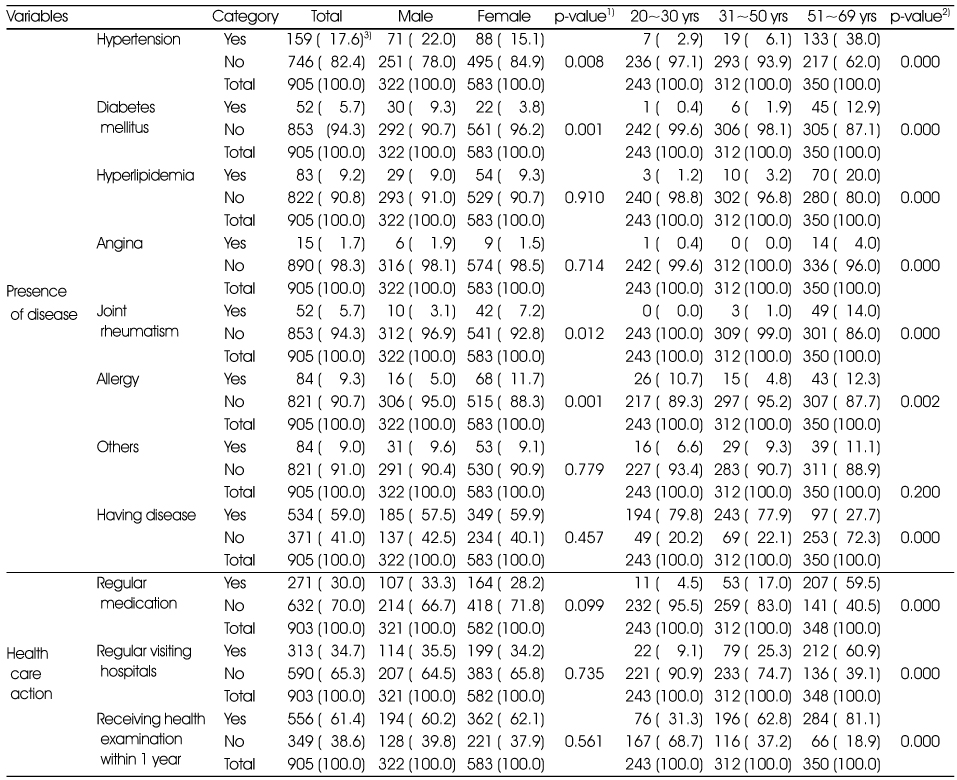
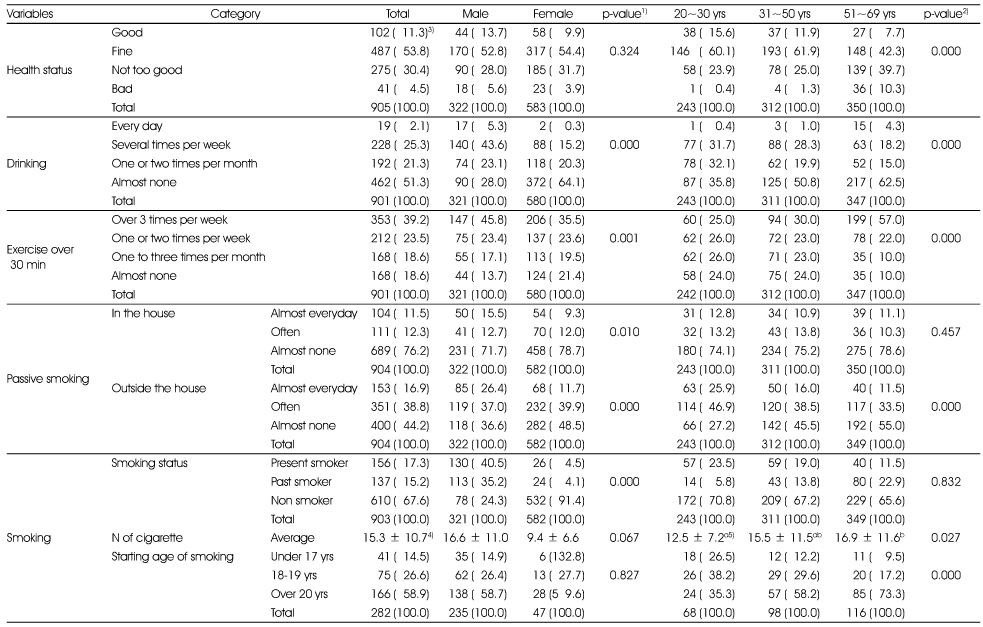
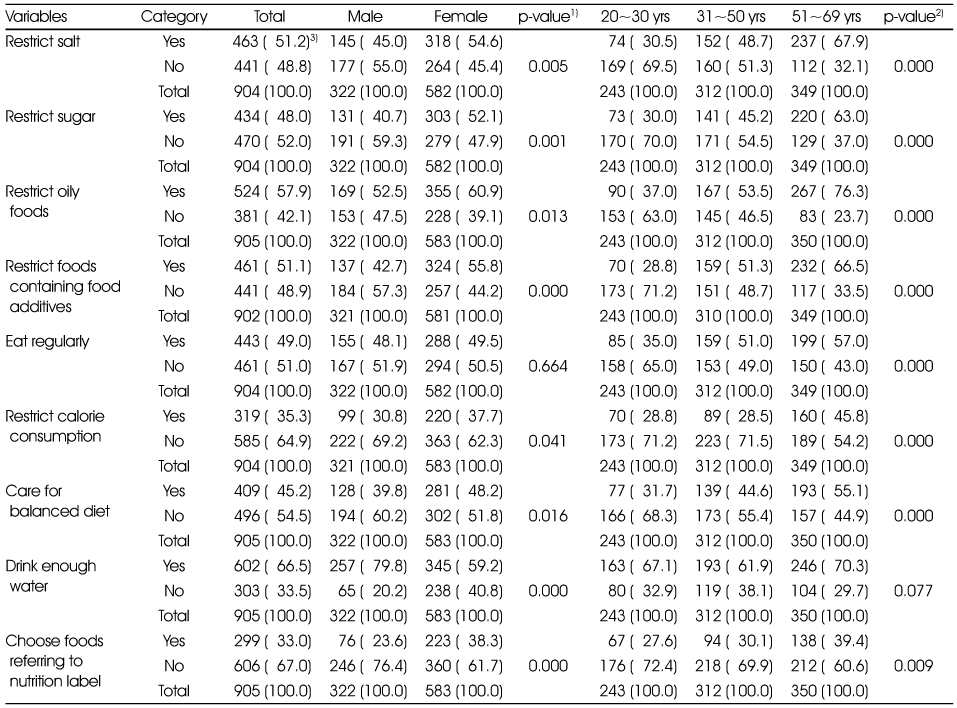
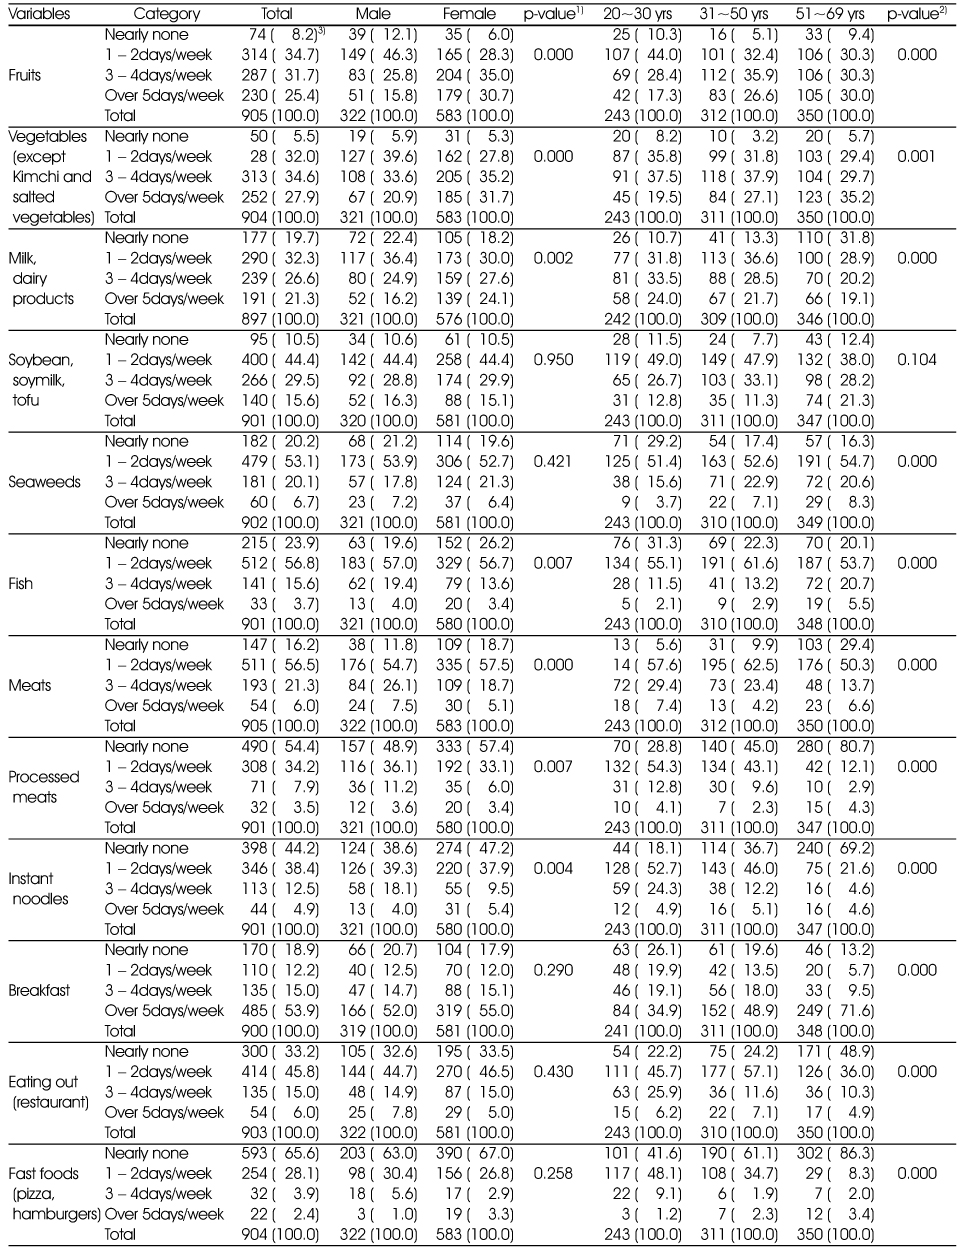
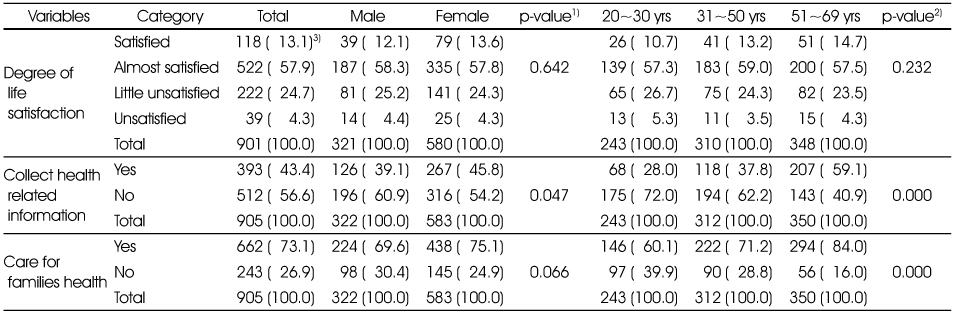
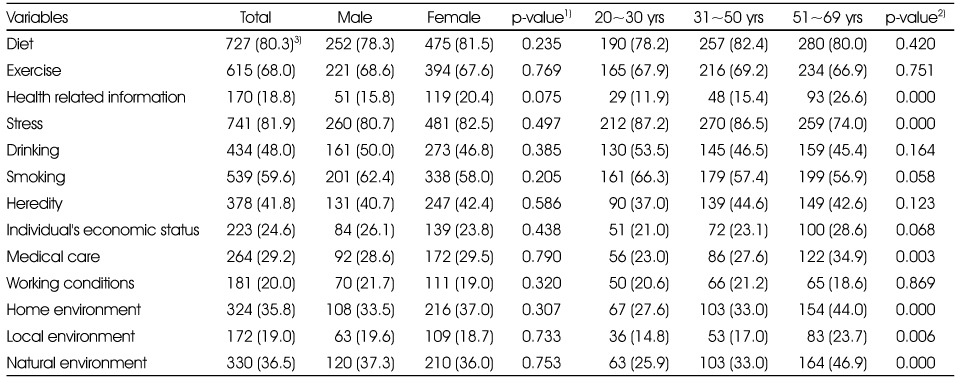
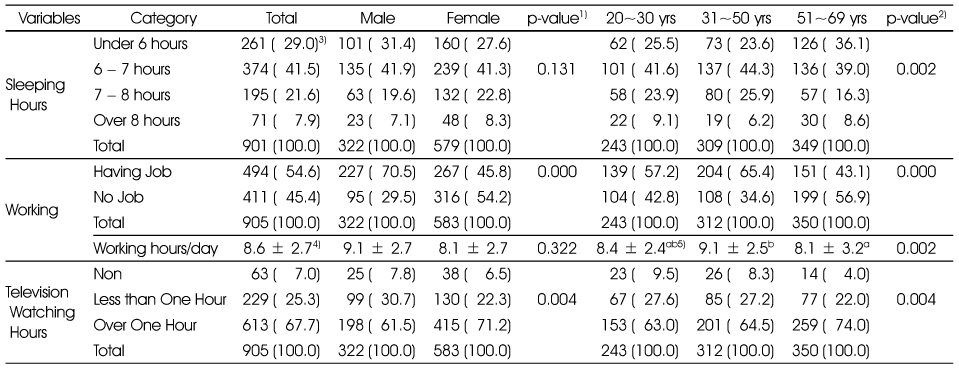
Figure & Data
REFERENCES
Citations
Citations to this article as recorded by 
- Dietary Safety Management Awareness and Competency for Healthcare among Adults in Daegu and Gyeongbuk Areas
Yunhwa Kim
Korean Journal of Community Nutrition.2020; 25(2): 112. CrossRef - Factors associated with the dietary quality and nutrition status using the Nutrition Quotient for adults focusing on workers in the manufacturing industry
Ji Suk Yim, Young Ran Heo
Journal of Nutrition and Health.2020; 53(5): 488. CrossRef
 Cite
CiteA Study on Dietary Behaviors, Health-Related Lifestyle of Adult Visitors at Public Health Centers in Gyeonggi Urban Area
A Study on Dietary Behaviors, Health-Related Lifestyle of Adult Visitors at Public Health Centers in Gyeonggi Urban Area
General characteristics of subjects
1) Mann-Whitney U test or Student t-test for mean comparison
2) Chi-square test or ANOVA for mean comparison
3) N (%)
4) Mean ± SD
5) Means with a same letter are not significantly different among age groups at p < 0.05 by Duncan's multiple range test.
Degree of living status and family compositions
1) Mann-Whitney U test, 2) Chi-square test, 3) N (%)
Presence of disease and health care action
1) Mann-Whitney U test, 2) Chi-square test, 3) N (%)
Degree of health status, drinking, exercise, and smoking
1) Mann-Whitney U test or student t-test for mean comparison
2) Chi-square test or ANOVA for mean comparison
3) N (%)
4) Mean ± SD
5) Means with a same letter are not significantly different among age groups at p < 0.05 by Duncan's multiple range test.
Dietary care matters for health
1) Mann-Whitney U test
2) Chi-square test
3) N (%)
Food consumption frequency
1) Mann-Whitney U test, 2) Chi-square test, 3) N (%)
Degree of life satisfaction and activities related with health and medication
1) Mann-Whitney U test, 2) Chi-square test, 3) N (%)
Factors strongly influence on human's life span (multiple responses)
1) Mann-Whitney U test, 2) Chi-square test, 3) N (%)
Sleeping hours, working hours and television watching hours
1) Mann-Whitney U test or Student t-test for mean comparison
2) Chi-square test or ANOVA for mean comparison
3) N (%)
4) Mean ± SD
5) Means with a same letter are not significantly different among age groups at p < 0.05 by Duncan's multiple range test.
Table 1
General characteristics of subjects
1) Mann-Whitney U test or Student t-test for mean comparison 2) Chi-square test or ANOVA for mean comparison 3) N (%) 4) Mean ± SD 5) Means with a same letter are not significantly different among age groups at p < 0.05 by Duncan's multiple range test.
Table 2
Degree of living status and family compositions
1) Mann-Whitney U test, 2) Chi-square test, 3) N (%)
Table 3
Presence of disease and health care action
1) Mann-Whitney U test, 2) Chi-square test, 3) N (%)
Table 4
Degree of health status, drinking, exercise, and smoking
1) Mann-Whitney U test or student t-test for mean comparison 2) Chi-square test or ANOVA for mean comparison 3) N (%) 4) Mean ± SD 5) Means with a same letter are not significantly different among age groups at p < 0.05 by Duncan's multiple range test.
Table 5
Dietary care matters for health
1) Mann-Whitney U test 2) Chi-square test 3) N (%)
Table 6
Food consumption frequency
1) Mann-Whitney U test, 2) Chi-square test, 3) N (%)
Table 7
Degree of life satisfaction and activities related with health and medication
1) Mann-Whitney U test, 2) Chi-square test, 3) N (%)
Table 8
Factors strongly influence on human's life span (multiple responses)
1) Mann-Whitney U test, 2) Chi-square test, 3) N (%)
Table 9
Sleeping hours, working hours and television watching hours
1) Mann-Whitney U test or Student t-test for mean comparison 2) Chi-square test or ANOVA for mean comparison 3) N (%) 4) Mean ± SD 5) Means with a same letter are not significantly different among age groups at p < 0.05 by Duncan's multiple range test.


