Articles
- Page Path
- HOME > Korean J Community Nutr > Volume 22(6); 2017 > Article
-
Research Article
- Effects of Daily Stress on Dietary Pattern among Elementary School Children in Seongnam City
-
Sunra Kim, Seunghee Kye

-
Korean Journal of Community Nutrition 2017;22(6):475-484.
DOI: https://doi.org/10.5720/kjcn.2017.22.6.475
Published online: December 31, 2017
Nutrition Education Major, Graduate School of Education, Gachon University, Seongnam-si, Gyeonggi, Korea.
- Corresponding author: Seunghee Kye. Nutrition Education Major, Graduate School of Education, Gachon University, 1342 Seongnamdaero, Sujeong-gu, Seongnam-si, Gyeonggi-do, 13120, Korea. Tel: (031) 750-5507, Fax: (031) 750-8683, shkye@gachon.ac.kr
Copyright © 2017 The Korean Society of Community Nutrition
This is an Open-Access article distributed under the terms of the Creative Commons Attribution Non-Commercial License (http://creativecommons.org/licenses/by-nc/3.0/) which permits unrestricted non-commercial use, distribution, and reproduction in any medium, provided the original work is properly cited.
- 1,119 Views
- 3 Download
- 2 Crossref
Figure & Data
REFERENCES
Citations

- ACADEMIC STRESS IS ASSOCIATED WITH EMOTIONAL EATING BEHAVIOR AMONG ADOLESCENT
Nadia Ramadhani, Trias Mahmudiono
Media Gizi Indonesia.2021; 16(1): 38. CrossRef - Sugar-sweetened beverage consumption and influencing factors in Korean adolescents: based on the 2017 Korea Youth Risk Behavior Web-based Survey
Ayoung Kim, Jinhee Kim, Seunghee Kye
Journal of Nutrition and Health.2018; 51(5): 465. CrossRef
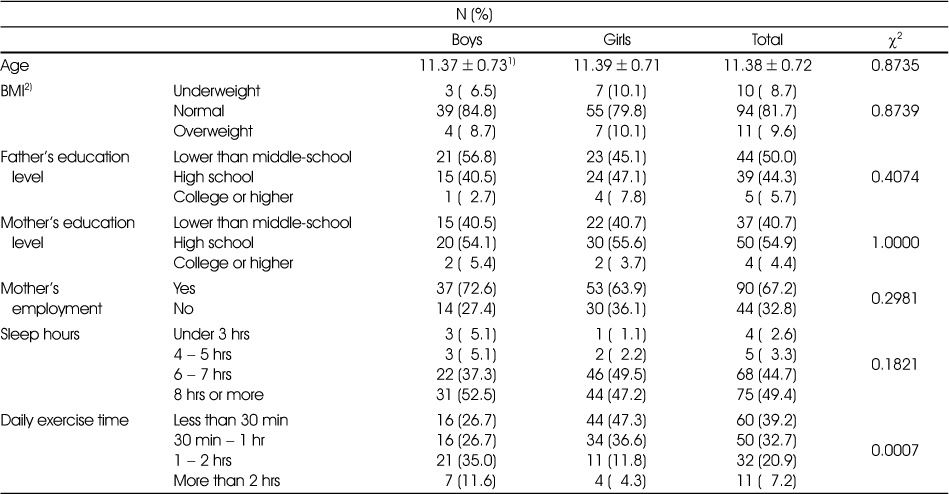
General characteristics
1) Mean±SD
2) BMI=Weight (kg)/Height (m2)
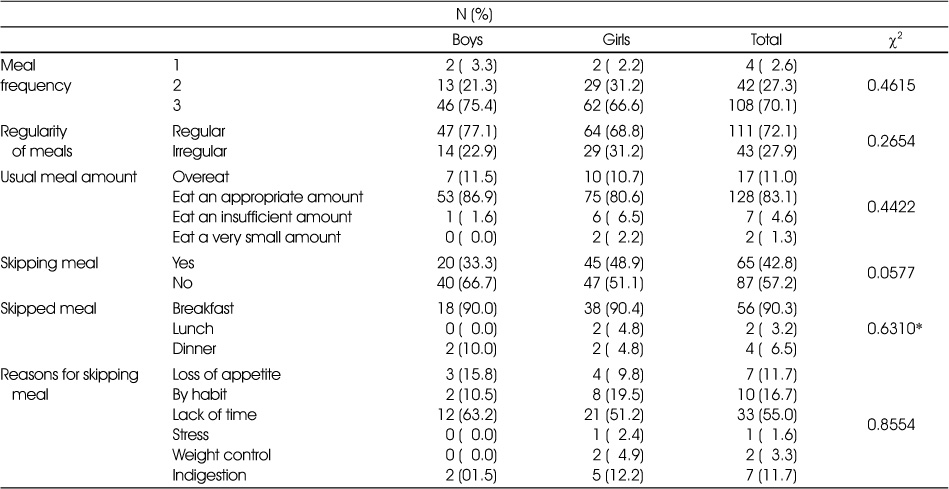
Dietary habits
*: p<0.05
Stress scores according to stress factor, emotional eating behavior, and dietary pattern
1) Mean±SD
2) Note: Total score of stress is 260; friend and personal (score 68), parent and family environmental (score 68), academic performance (score 32), teacher and school environmental (score 52), surrounding environment and social (score 40)
3) Note: Emotional eating behavior is defined as a tendency using food to cope with negative emotion. Emotional eating behavior included 13 items (e.g., “Do you have a desire to eat when you are irritated?”) rated on a 5-point Likert scale. Total score is 65.
*: p<0.05
Correlations between stress factors, emotional eating behavior, and dietary pattern
*: p<0.05, ***:p<0.001
Poisson Regression Analysis: The effect of individual stress factors on dietary pattern
1) In the statistical analysis, covariates variables such as age, sex, excise time, and BMI were included in the model for each stress factor.
*: p<0.05
Odds ratios for food consumption frequency associated with stress among subjects
1) In the logistic regression analysis, the data were adjusted for age, sex, exercise time, and BMI
2) Each food group was dichotomized into two groups for the frequency of intake cut-off median value/day
3) CI=confidence interval; OR=odds ratio
*: p<0.05
1) Mean±SD 2) BMI=Weight (kg)/Height (m2)
*: p<0.05
1) Mean±SD 2) Note: Total score of stress is 260; friend and personal (score 68), parent and family environmental (score 68), academic performance (score 32), teacher and school environmental (score 52), surrounding environment and social (score 40) 3) Note: Emotional eating behavior is defined as a tendency using food to cope with negative emotion. Emotional eating behavior included 13 items (e.g., “Do you have a desire to eat when you are irritated?”) rated on a 5-point Likert scale. Total score is 65. *: p<0.05
*: p<0.05, ***:p<0.001
1) In the statistical analysis, covariates variables such as age, sex, excise time, and BMI were included in the model for each stress factor. *: p<0.05
1) In the logistic regression analysis, the data were adjusted for age, sex, exercise time, and BMI 2) Each food group was dichotomized into two groups for the frequency of intake cut-off median value/day 3) CI=confidence interval; OR=odds ratio *: p<0.05

 KSCN
KSCN


 Cite
Cite


