
Articles
- Page Path
- HOME > Korean J Community Nutr > Volume 24(2); 2019 > Article
-
Research Article
- Relationship between the Intake of Children's Favorite Foods and Policy based on Special Act on Safety Control of Children's Dietary Life
-
Taejung Woo
 , Jihye Yoo, Kyung-Hea Lee
 -
Korean Journal of Community Nutrition 2019;24(2):106-116.
DOI: https://doi.org/10.5720/kjcn.2019.24.2.106
Published online: April 30, 2019
1Department of Food and Nutrition, Changwon National University, Research Institute for Human Ecology, Changwon 51140, Korea, Researcher.
2Major in Nutrition Education, Changwon National University, Changwon 51140, Korea, Student.
3Department of Food and Nutrition, Changwon National University, Changwon 51140, Korea, Professor.
- Corresponding author: Kyung-Hea Lee. Department of Food and Nutrition, Changwon National University, 20 Changwondaehak-ro, Uichanggu, Changwon-si, Gyeongnam 51140, Korea. Tel: (055) 213-3514, Fax: (055) 281-7480, khl@changwon.ac.kr
• Received: February 13, 2019 • Revised: April 11, 2019 • Accepted: April 11, 2019
Copyright © 2019 The Korean Society of Community Nutrition
This is an Open-Access article distributed under the terms of the Creative Commons Attribution Non-Commercial License (http://creativecommons.org/licenses/by-nc/3.0/) which permits unrestricted non-commercial use, distribution, and reproduction in any medium, provided the original work is properly cited.
- 1,930 Views
- 2 Download
- 1 Crossref
Abstract
-
Objectives
- This study examined the status of children's favorite foods intake and the relationship with the policy environment based on the Special Act on Safety Control of Children's Dietary Life for suggesting a supportive policy strategy.
-
Methods
- The subjects were 4th grade students (n=1,638) in elementary school from 45 schools collected from seven areas (Seoul, Daegu, Daejeon, Gyeonggi, Chungnam, Jeonbuk, and Gyeongnam). The children participated in a self-administered questionnaire survey in class under the supervision of the teacher. The questionnaire consisted of items, such as social demographic characteristics, frequency of intake of the children's favorite foods, and policy cognition. A t-test and ANOVA were applied to explore the relationship between the frequency of children's favorite foods intake and policy cognition. The survey was implemented from August 2016 to September 2016.
-
Results
- For the boys, the frequency of ‘high-calorie low nutrient foods intake’ (HCLN) was significantly higher than that of the girls (p<0.01). For the children who received information on their favorite foods from the internet, the frequency of HCLN was higher than the other sources (p<0.01). The time of TV viewing and computer usage, and smartphone usage was associated with a higher frequency of HCLN, and a lower healthy favorite food intake (all p<0.001). The intake frequency of healthy favorite foods indicated a positive correlation with the policy cognition, including policy perception, usefulness, necessity and buying intention, and educational experience.
-
Conclusions
- This study showed a correlation with the frequency of children's favorite foods intake and policy. In particular, the frequency of children's healthy favorite foods intake indicated a meaningful relationship with the policy than the frequency of HCLN. This study also found that the consumption of children's healthy favorite foods was positively correlated with the educational experience. To develop a supportive policy for a good dietary environment for children, there is a need to focus on how to collaborate with multiple levels of influences, such as the national level, school level, and family.
Acknowledgments
Acknowledgments
- 1. Kang SA, Lee JW, Kim KE, Koo JO, Park DY. A study of the frequency of food purchase for snaking and its related ecological factors on elementary school children. Korean J Community Nutr 2004; 9(4): 453-463.
- 2. Kim HR. An overview of food safety and nutrition policy for children and tasks ahead. Health Welf Policy Forum 2010; 161: 27-36.
- 3. Na EY. Children and adolescents as respondents to advertising communication: characteristics and necessity of sanctions. Korean J Consum Advert Psychol 2006; 7(1): 131-163.
- 4. Cassady D, Vogt R, Oto-Kent D, Mosley R, Lincoln R. The power of policy: a case study of healthy eating among children. Am J Public Health 2006; 96(9): 1570-1571.ArticlePubMedPMC
- 5. Cullen KW, Thompson DI. Texas school food policy changes related to middle school a la carte/snack bar foods:potential saving in kilocalories. J Am Diet Assoc 2005; 105(12): 1952-1954.PubMed
- 6. Contento IR. Nutrition education: linking research, theory, and practice. 3rded. Burlington (MA): Jones & Bartlett Learning; 2016. p. 31-49. p. 198.
- 7. Kim Y, Han SN. Associations between exposure to unhealthy food outlets within residential district and obesity: using data from 2013 Census on Establishments and 2013-2014 Korea National Health and Nutrition Examination Survey. Korean J Community Nutr 2016; 21(5): 463-476.ArticleLink
- 8. National Law Information Center. Special act on safety management of children's dietary lifestyle [internet]. Ministry of Government Legislation; 2009; cited 2016 Jan 10]. Available from: http://www.law.go.kr/.
- 9. Kim BR. Fast food consumption pattern and food habit by fast food intake frequency of middle school students in Wonju area. J Korean Home Econ Educ Assoc 2009; 21(4): 19-33.
- 10. Cho EA, Lee SK, Heo GJ. Snack consumption behaviors and nutrition knowledge among elementary school students in Siheung-si. Korean J Community Nutr 2010; 15(2): 169-179.
- 11. Kang HS, Lee NH, Lee EJ, Cho SH. Consumption and perception of high caloric, low nutrient dense foods by middle school students in Daegu. J Korean Diet Assoc 2012; 18(3): 234-247.Article
- 12. Koo HJ, Kim SY. Analysis of purchasing behaviors of processed foods in high school students in Yongin region. J Korean Soc Food Sci Nutr 2014; 43(12): 1929-1936.Article
- 13. Lee MS, Kim JH, Lee BS, Lee YN, Son SM, Lee JW. Nutritional assessment. 4th ed. Paju: Kyomunsa; 2017. p. 164.
- 14. Hong JI, Jeong HS. A study on the effective educational and promotional strategies for the Special Act on the Safety Management of Children's Dietary Life. Korean J Culinary Res 2012; 18(5): 176-189.Article
- 15. Kim H, Pae M. Lifestyle, dietary behavior and snack preference of upper grade elementary school students in Cheongju according to the usage time of smartphones. Korean J Community Nutr 2017; 22(1): 40-52.ArticleLink
- 16. Heo GJ, Nam SY, Lee SK, Chung SJ, Yoon JH. The relationship between high energy/low nutrient food consumption and obesity among Korean children and adolescents. Korean J Community Nutr 2012; 17(2): 226-242.Article
- 17. Vader AM, Walters ST, Harris TR, Hoelscher DM. Television viewing and snacking behaviors of fourth- and eighth-grade schoolchildren in Texas. Prev Chronic Dis 2009; 6(3): A89.PubMedPMC
- 18. Lee GO. A content analysis of food advertising on children's television: examination of food advertising regulation issues. Korea J Broadcast Telecommun Stud 2010; 10: 41-69.
- 19. Rothschild ML. Carrots, sticks, and promises: a conceptual framework for the management of public health and social issue behaviors. J Mark 1999; 63(4): 24-37.ArticleLink
- 20. Tate EB, Unger JB, Chou CP, Spruijt-Metz D, Pentz MA, Riggs NR. Children's executive function and high calorie, low nutrient food intake: mediating effects of child-perceived adult fast food intake. Health Educ Behav 2015; 42(2): 163-170.ArticlePubMedLink
- 21. Te Morenga LA, Howatson AJ, Jones RM, Mann J. Dietary sugars and cardiometabolic risk: systematic review and meta-analyses of randomized controlled trials of the effects on blood pressure and lipids. Am J Clin Nutr 2014; 100(1): 65-79.PubMed
REFERENCES
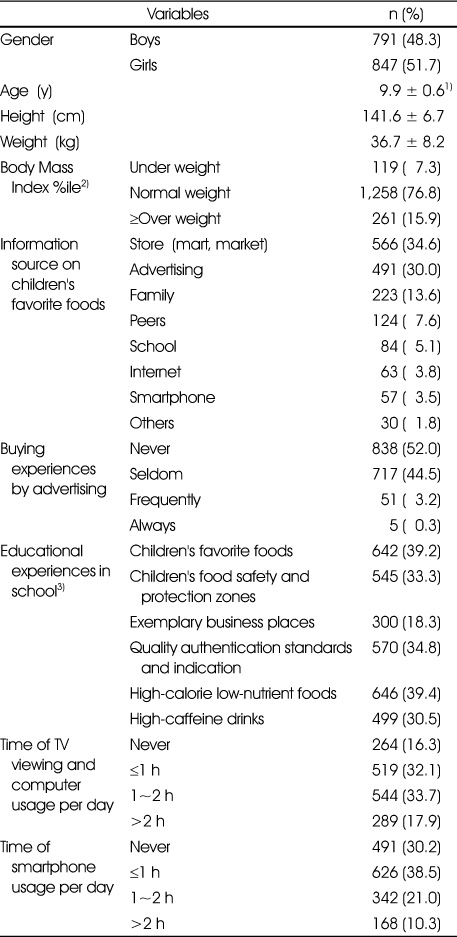
Table 2
Frequency of children's favorite foods intake
1) Mean ± S.D. (converted to intake frequency per week, 0=not at all, 0.5=1~3 times a month, 2=1~3 times a week, 5=4~6 times a week, 7=once a day, 14=more than twice a day)
2) Cookie, biscuit (sweet snacks), potato chips etc. (salty snacks), cereal, cereal bar
3) Chocolate, chocolate bar, candy, jelly
4) Processed milk, carbonated drink, high-caffeinated drink, fruit flavor drink, others drink (ionic drink, vitamin drink etc.)
5) Fried chicken·chicken gangjeong, others fried (Fried squid etc.)
6) Skewers, Dumplings, dukbokki, hamburger, pizza
7) Gimbaps, sandwiches
Table 3
Comparison of children's favorite foods intake and social demographic variables
1) Mean ± S.D.; frequency of children's favorite foods intake per week
2) BMI (body mass index) percentile based on 2007 Korean national growth charts for children and adolescents (underweight: BMI percentile < 5; normal weight: 5 ≤ BMI percentile < 85; overweight: 85≤ BMI percentile)
3) *: p<0.05, **: p<0.01, **: p<0.001 by t-test
4) *: p<0.05, **: p<0.01, **: p<0.001 by ANOVA
abc: Values with the different small letter superscript are significantly different among column by Duncan's multiple range test at p<0.05.
Table 4
Comparison of policy cognition, educational experience among clusters
1) Frequency of children's healthy favorite foods intake in clusters: low intake −7.3 ± 3.4 times per week, medium intake-18.1 ± 3.6 times per week, high intake-32.7 ± 6.2 times per week
2) Policy cognition consisted of policy perception, policy usefulness, policy necessity and buying intention; total score-23 points
3) Mean ± S.D. (policy perception: 10 points, policy usefulness: 4 points, policy necessity: 6 points, buying intention: 3 points, educational experience: 3 points)
**: p<0.01, **: p<0.001 by ANOVA
abc: Values with the different small letter superscript are significantly different among row by Duncan's multiple range test at p<0.05.
Table 5
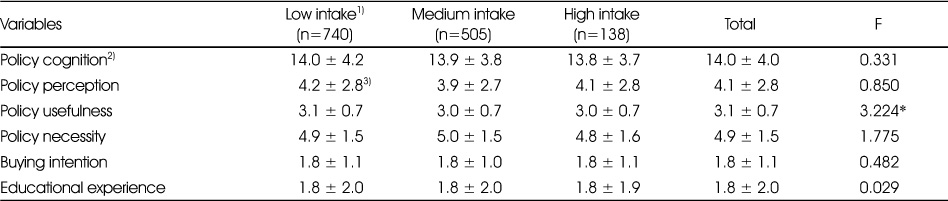
Comparison of policy cognition, educational experience among clusters
1) Frequency of children's high-calorie low-nutrient favorite foods intake in clusters:low intake −4.3 ± 2.2 times per week, medium intake-11.5 ± 2.4 times per week, high intake-22.7 ± 5.0 times per week
2) Policy cognition consisted of policy perception, policy usefulness, policy necessity and buying intention; total score-23 points
3) Mean ± S.D. (policy perception: 10 points, policy usefulness: 4 points, policy necessity: 6 points, buying intention: 3 points, educational experience: 3 points)
*: p<0.05 by ANOVA
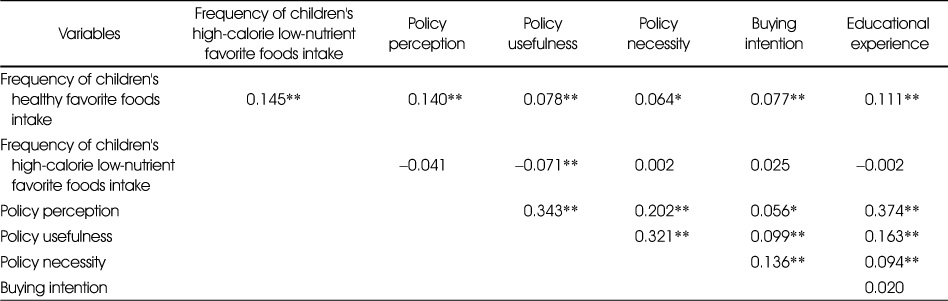
Figure & Data
REFERENCES
Citations
Citations to this article as recorded by 
- Correlation between adolescents’ dietary safety management competency and value recognition, efficacy, and competency of convergence using dietary area: a descriptive study
Yunhwa Kim, Yeon-Kyung Lee
Korean Journal of Community Nutrition.2023; 28(4): 317. CrossRef
 Cite
CiteRelationship between the Intake of Children's Favorite Foods and Policy based on Special Act on Safety Control of Children's Dietary Life
Relationship between the Intake of Children's Favorite Foods and Policy based on Special Act on Safety Control of Children's Dietary Life
Social demographic characteristics of subjects
1) Mean ± S.D.
2) Body Mass Index (kg/m2) %ile based on 2007 Korean national growth charts for children and adolescent (underweight: BMI percentile <5; normal weight: 5 ≤ BMI percentile < 85; overweight: 85≤ BMI percentile)
3) The data show only positive answer in this variable
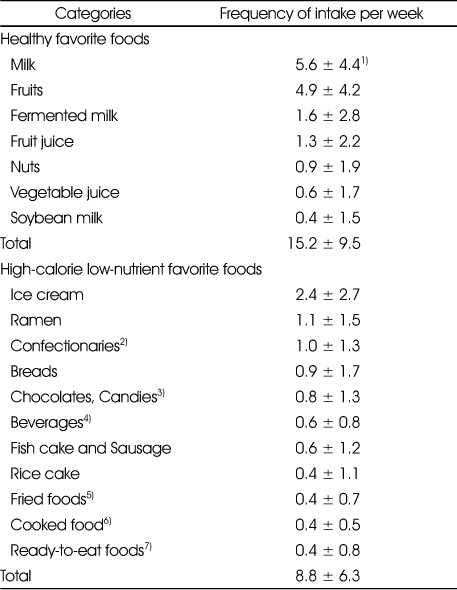
Frequency of children's favorite foods intake
1) Mean ± S.D. (converted to intake frequency per week, 0=not at all, 0.5=1~3 times a month, 2=1~3 times a week, 5=4~6 times a week, 7=once a day, 14=more than twice a day)
2) Cookie, biscuit (sweet snacks), potato chips etc. (salty snacks), cereal, cereal bar
3) Chocolate, chocolate bar, candy, jelly
4) Processed milk, carbonated drink, high-caffeinated drink, fruit flavor drink, others drink (ionic drink, vitamin drink etc.)
5) Fried chicken·chicken gangjeong, others fried (Fried squid etc.)
6) Skewers, Dumplings, dukbokki, hamburger, pizza
7) Gimbaps, sandwiches
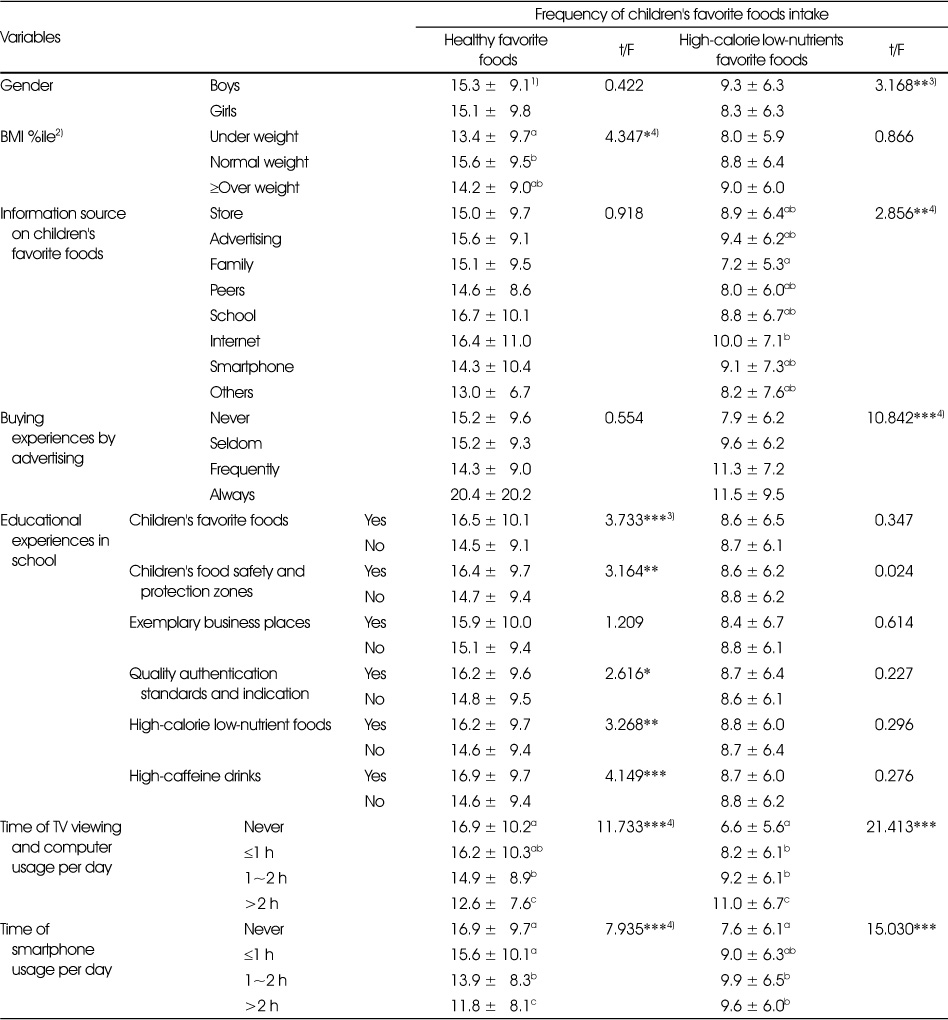
Comparison of children's favorite foods intake and social demographic variables
1) Mean ± S.D.; frequency of children's favorite foods intake per week
2) BMI (body mass index) percentile based on 2007 Korean national growth charts for children and adolescents (underweight: BMI percentile < 5; normal weight: 5 ≤ BMI percentile < 85; overweight: 85≤ BMI percentile)
3) *: p<0.05, **: p<0.01, **: p<0.001 by t-test
4) *: p<0.05, **: p<0.01, **: p<0.001 by ANOVA
abc: Values with the different small letter superscript are significantly different among column by Duncan's multiple range test at p<0.05.
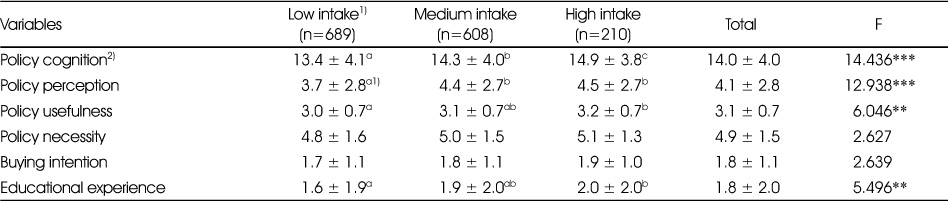
Comparison of policy cognition, educational experience among clusters
1) Frequency of children's healthy favorite foods intake in clusters: low intake −7.3 ± 3.4 times per week, medium intake-18.1 ± 3.6 times per week, high intake-32.7 ± 6.2 times per week
2) Policy cognition consisted of policy perception, policy usefulness, policy necessity and buying intention; total score-23 points
3) Mean ± S.D. (policy perception: 10 points, policy usefulness: 4 points, policy necessity: 6 points, buying intention: 3 points, educational experience: 3 points)
**: p<0.01, **: p<0.001 by ANOVA
abc: Values with the different small letter superscript are significantly different among row by Duncan's multiple range test at p<0.05.
Comparison of policy cognition, educational experience among clusters
1) Frequency of children's high-calorie low-nutrient favorite foods intake in clusters:low intake −4.3 ± 2.2 times per week, medium intake-11.5 ± 2.4 times per week, high intake-22.7 ± 5.0 times per week
2) Policy cognition consisted of policy perception, policy usefulness, policy necessity and buying intention; total score-23 points
3) Mean ± S.D. (policy perception: 10 points, policy usefulness: 4 points, policy necessity: 6 points, buying intention: 3 points, educational experience: 3 points)
*: p<0.05 by ANOVA
Pearson correlation coefficient among frequency of children's favorite foods intake, policy cognition and educational experience
*: p<0.05, **: p<0.01, **: p<0.001 by pearson correlation analysis
Table 1
Social demographic characteristics of subjects
1) Mean ± S.D. 2) Body Mass Index (kg/m2) %ile based on 2007 Korean national growth charts for children and adolescent (underweight: BMI percentile <5; normal weight: 5 ≤ BMI percentile < 85; overweight: 85≤ BMI percentile) 3) The data show only positive answer in this variable
Table 2
Frequency of children's favorite foods intake
1) Mean ± S.D. (converted to intake frequency per week, 0=not at all, 0.5=1~3 times a month, 2=1~3 times a week, 5=4~6 times a week, 7=once a day, 14=more than twice a day) 2) Cookie, biscuit (sweet snacks), potato chips etc. (salty snacks), cereal, cereal bar 3) Chocolate, chocolate bar, candy, jelly 4) Processed milk, carbonated drink, high-caffeinated drink, fruit flavor drink, others drink (ionic drink, vitamin drink etc.) 5) Fried chicken·chicken gangjeong, others fried (Fried squid etc.) 6) Skewers, Dumplings, dukbokki, hamburger, pizza 7) Gimbaps, sandwiches
Table 3
Comparison of children's favorite foods intake and social demographic variables
1) Mean ± S.D.; frequency of children's favorite foods intake per week 2) BMI (body mass index) percentile based on 2007 Korean national growth charts for children and adolescents (underweight: BMI percentile < 5; normal weight: 5 ≤ BMI percentile < 85; overweight: 85≤ BMI percentile) 3) *: p<0.05, **: p<0.01, **: p<0.001 by t-test 4) *: p<0.05, **: p<0.01, **: p<0.001 by ANOVA abc: Values with the different small letter superscript are significantly different among column by Duncan's multiple range test at p<0.05.
Table 4
Comparison of policy cognition, educational experience among clusters
1) Frequency of children's healthy favorite foods intake in clusters: low intake −7.3 ± 3.4 times per week, medium intake-18.1 ± 3.6 times per week, high intake-32.7 ± 6.2 times per week 2) Policy cognition consisted of policy perception, policy usefulness, policy necessity and buying intention; total score-23 points 3) Mean ± S.D. (policy perception: 10 points, policy usefulness: 4 points, policy necessity: 6 points, buying intention: 3 points, educational experience: 3 points) **: p<0.01, **: p<0.001 by ANOVA abc: Values with the different small letter superscript are significantly different among row by Duncan's multiple range test at p<0.05.
Table 5
Comparison of policy cognition, educational experience among clusters
1) Frequency of children's high-calorie low-nutrient favorite foods intake in clusters:low intake −4.3 ± 2.2 times per week, medium intake-11.5 ± 2.4 times per week, high intake-22.7 ± 5.0 times per week 2) Policy cognition consisted of policy perception, policy usefulness, policy necessity and buying intention; total score-23 points 3) Mean ± S.D. (policy perception: 10 points, policy usefulness: 4 points, policy necessity: 6 points, buying intention: 3 points, educational experience: 3 points) *: p<0.05 by ANOVA
Table 6
Pearson correlation coefficient among frequency of children's favorite foods intake, policy cognition and educational experience
*: p<0.05, **: p<0.01, **: p<0.001 by pearson correlation analysis


