Articles
- Page Path
- HOME > Korean J Community Nutr > Volume 24(2); 2019 > Article
-
Research Article
- Relationship between Complementary Feeding Introduction and Early Childhood Caries: Results from the Korea National Health and Nutrition Examination Survey 2008–2015
-
Miyong Yon
 , Hye-Sun Shin
 , Haeng Shin Lee
-
Korean Journal of Community Nutrition 2019;24(2):97-105.
DOI: https://doi.org/10.5720/kjcn.2019.24.2.97
Published online: April 30, 2019
1Nutrition Policy and Promotion Team, Korea Health Industry Development Institute, Chungbuk, Korea, Principal Researcher.
2Department of Dental Hygiene, College of Health Science, Eulji University, Seongnam, Korea, Visiting Professor.
3Department of Lifecare Industry, Korea Health Industry Development Institute, Chungbuk, Korea, Director.
- Corresponding author: Miyong Yon. Nutrition Policy and Promotion Team, Korea Health Industry Development Institute, Osong Health Technology Administration Complex, 187 Osongseangmyeong2-ro, Osongeup, Heungdeok-gu, Cheongjusi, Chungbuk 28159, Korea. Tel: (043) 713-8613, Fax: (043) 713-8907, ymy0827@khidi.or.kr
Copyright © 2019 The Korean Society of Community Nutrition
This is an Open-Access article distributed under the terms of the Creative Commons Attribution Non-Commercial License (http://creativecommons.org/licenses/by-nc/3.0/) which permits unrestricted non-commercial use, distribution, and reproduction in any medium, provided the original work is properly cited.
- 1,323 Views
- 5 Download
- 3 Crossref
Abstract
-
Objectives
- This study examined whether the infant feeding type and duration are related to the introduction of complementary feeding, and whether the appropriate introduction of complementary feeding in infancy is related to tooth decay in toddlers.
-
Methods
- The subjects were 1,521 toddlers among 2~3 year old children in the Korea National Health and Nutrition Examination Survey from 2008 to 2015. The toddlers were divided into the appropriate group (4~6 months) and delayed group (>6 months) according to the timing of complementary feeding introduction.
-
Results
- The delayed group were 26.5% of subjects and the formula feeding period in the appropriate group and delayed group was 8.4 and 10.3 months, respectively (P=0.002). On the other hand, there was no difference in the breastfeeding period between the appropriate group and delayed group (P=0.6955). Early childhood caries was more common in the delayed group (P=0.0065). The delayed introduction of complementary feeding was associated with a risk of early childhood caries according to the logistic models (OR 1.81, 95% CI 1.27–2.57).
-
Conclusions
- The introduction of complementary feeding is associated with early childhood caries. Therefore, the importance of the proper introduction of complementary feeding in infancy should be emphasized, and public relations and education for maternal care and breastfeeding should be provided through health care institutions.
- 1. American Academy of Pediatric Dentistry Clinical Affairs Committee. Policy on early childhood caries (ECC): classifications, consequences, and preventive strategies. Pediatr Dent 2008; 30(7): 40-43.PubMed
- 2. Selwitz RH, Ismail AI, Pitts NB. Dental caries. Lancet 2007; 369(9555): 51-59.ArticlePubMed
- 3. Pitts N, Harker R. Obvious decay experience children's dental health in the United Kingdom 2003. London: Office for National Statistics; 2004.
- 4. Filstrup SL, Briskie D, da Fonseca M, Lawrence L, Wandera A, Inglehart MR. Early childhood caries and quality of life: child and parent perspectives. Pediatr Dent 2003; 25(5): 431-440.PubMed
- 5. Low W, Tan S, Schwartz S. The effect of severe caries on the quality of life in young children. Pediatr Dent 1999; 21(6): 325-326.PubMed
- 6. Ministry of Health and Welfare. 2015 Korean children's oral health survey. Sejong: Ministry of Health and Welfare; 2015.
- 7. Davies GN. Early childhood caries-a synopsis. Community Dent Oral Epidemiol 1998; 26(S1): 106-116.ArticlePubMed
- 8. Berkowitz RJ. Causes, treatment and prevention of early childhood caries: a microbiologic perspective. J Can Dent Assoc 2003; 69(5): 304-307.PubMed
- 9. Feldens CA, Giugliani ER, Vigo A, Vitolo MR. Early feeding practices and severe early childhood caries in four-year-old children from southern Brazil: a birth cohort study. Caries Res 2010; 44(5): 445-452.ArticlePubMedPDF
- 10. Chaffee BW, Feldens CA, Rodrigues PH, Vitolo MR. Feeding practices in infancy associated with caries incidence in early childhood. Community Dent Oral Epidemiol 2015; 43(4): 338-348.ArticlePubMedPMC
- 11. Chaffee BW, Feldens CA, Vitolo MR. Association of long-duration breastfeeding and dental caries estimated with marginal structural models. Ann Epidemiol 2014; 24(6): 448-454.ArticlePubMedPMC
- 12. Chaudhary SD, Chaudhary M, Singh A, Kunte S. An assessment of the cariogenicity of commonly used infant milk formulae using microbiological and biochemical methods. Int J Dent 2011; 2011: 320798.ArticlePubMedPMCPDF
- 13. Tham R, Bowatte G, Dharmage SC, Tan DJ, Lau MX, Dai X. Breastfeeding and the risk of dental caries: a systematic review and meta-analysis. Acta Paediatr 2015; 104(467): 62-84.ArticlePubMed
- 14. Park DH, Lee KH, Kim DE. In vitro study of cariogenic potential of infant formulas. J Korean Acad Pediatr Dent 2000; 27(1): 32-39.
- 15. Heo YW, Kim SJ, Lee KH. In vitro study of baby food and breakfast cereal as for buffering capacity, acid production by Streptococcus Mutans, and synthetic hydroxyapatitie decalcification. J WonKwang Dent Res Inst 1990; 1(1): 167-176.
- 16. Korea Consumer Agency. Issues and measures for baby foods. Chungbuk: Korea Consumer Agency; 2000.
- 17. Consumers Union of Korea. Analysis of sugar and sodium contents for baby food. Seoul: Consumers Union of Korea; 2015.
- 18. World Health Organization. Indicators for assessing infant and young child feeding practices. Washington, D. C.: World Health Organization; 2010.
- 19. Korea Institute for Health and Social Affairs. A survey on breast-feeding in Korea. Sejong: Korea Institute for Health and Social Affairs; 2016.
- 20. Park YH, Lee SS, Jung LH. Perception and use of weaning diets by housewives in Gwangju-Jeonnam regions. Korean J Food Cook Sci 2006; 22(6): 799-807.
- 21. Kim SO. Study on the direction for development of instant weaning food through purchase survey of feeding habit [Master's thesis]. Chung-Ang University; 2012.
- 22. Agostoni C, Decsi T, Fewtrell M, Goulet O, Kolacek S, Koletzko B. Complementary feeding: a commentary by the ESPGHAN Committee on Nutrition. J Pediatr Gastroenterol Nutr 2008; 46(1): 99-110.ArticlePubMed
- 23. World Health Organization. Complementary feeding of young children in developing countries: a review of current scientific knowledge. Geneva: World Health Organization; 1998.
- 24. Victora CG, Bahl R, Barros AJ, Franca GV, Horton S, Krasevec J. Breastfeeding in the 21st century: epidemiology, mechanisms, and lifelong effect. Lancet 2016; 387(10017): 475-490.ArticlePubMed
- 25. Korea Institute for Health and Social Affairs. The 2012 national survey on fertility, family health and welfare in Korea. Sejong: Korea Institute for Health and Social Affairs; 2010.
- 26. Lee JH. A study on mothers' perceptions of weaning diets and the use of commercial weaning foods in Ulsan [Master thesis]. Ulsan University; 2016.
- 27. American Dental Association. For the dental patient. Tooth eruption: The primary teeth. J Am Dent Assoc 2005; 136(11): 1619.PubMed
- 28. Yom HW, Seo JW, Park HP, Choi KH, Chang JY, Ryoo E. Current feeding practices and maternal nutritional knowledge on complementary feeding in Korea. Korean J Pediatr 2009; 52(10): 1090-1102.Article
- 29. Lee CH, Jeong TS, Kim S. A pilot survey of the state of feeding, oral hygiene care tooth eruption and caries in 18-month old infants. J Korean Acad Pediatr Dent 2004; 31(4): 714-720.
- 30. Ventura AK, Worobey J. Early influences on the development of food preferences. Curr Biol 2013; 23(9): R401-R408.ArticlePubMed
- 31. Beauchamp GK, Moran M. Acceptance of sweet and salty tastes in 2-year-old children. Appetite 1984; 5(4): 291-305.ArticlePubMed
- 32. Wendt LK, Hallonsten AL, Koch G, Birkhed D. Analysis of caries-related factors in infants and toddlers living in Sweden. Acta Odontol Scand 1996; 54(2): 131-137.ArticlePubMed
- 33. Wan AK, Seow WK, Purdie DM, Bird PS, Walsh LJ, Tudehope DI. A longitudinal study of Streptococcus mutans colonization in infants after tooth eruption. J Dent Res 2003; 82(7): 504-508.ArticlePubMedPDF
- 34. Zhao W, Li W, Lin J, Chen Z, Yu D. Effect of sucrose concentration on sucrose-dependent adhesion and glucosyltransferase expression of S. mutans in children with severe early-childhood caries (S-ECC). Nutrients 2014; 6(9): 3572-3586.ArticlePubMedPMC
- 35. American Academy of Pediatric Dentistry. Guideline on periodicity of examination, preventive dental services, anticipatory guidance/counseling, and oral treatment for infants, children, and adolescents. Pediatr Dent 2013; 35(5): E148-E156.PubMed
REFERENCES
Comparison of feeding duration according to the complementary feeding introduction (Mean ± SD)

Distribution of participants introduction of complementary feeding and early childhood caries N (%)

Odds ratio for early childhood caries among 2~3 years old toddlers (N=1,390)

Data were analyzed by complex samples logistic regression.
Independent variable is introduction of complementary feeding (categorical variable).
Model 1: Models were unadjusted association.
Model 2: Models were adjusted for household income and mode of feeding
Model 3: Models were adjusted for household income, mode of feeding and regular dental checkup
Model 4: Models were adjusted for household income, mode of feeding and tooth brushing frequency
Model 5: Models were adjusted for household income, mode of feeding, regular dental checkup, and tooth brushing frequency
Bold denotes p<0.05.
Figure & Data
REFERENCES
Citations

- Feeding Practices and Early Childhood Caries in Korean Preschool Children
You Hyun Park, Yoon Young Choi
International Dental Journal.2022; 72(3): 392. CrossRef - Prediction Models of Early Childhood Caries Based on Machine Learning Algorithms
You-Hyun Park, Sung-Hwa Kim, Yoon-Young Choi
International Journal of Environmental Research and Public Health.2021; 18(16): 8613. CrossRef - Dietary intake and nutritional status of Korean children and adolescents: a review of national survey data
Minji Kang, So Yoon Choi, Minyoung Jung
Clinical and Experimental Pediatrics.2021; 64(9): 443. CrossRef
- Figure
- We recommend
- Related articles
-
- Ultra-processed food intake and dietary behaviors in Korean adolescents: a cross-sectional study based on the 2019–2023 Korea National Health and Nutrition Examination Survey
- Self-reported weight change and diet quality in relation to metabolic syndrome among Korean cancer survivors: a cross-sectional study using the Korea National Health and Nutrition Examination Survey 2019–2021
- The dietary factors associated with sleep duration in postmenopausal middle-aged women: a cross-sectional study using 2019–2023 Korea National Health and Nutrition Examination Survey data
- Analysis of the relationship between sugar intake and cancer prevalence: a cross-sectional study using the 8th Korea National Health and Nutrition Examination Survey

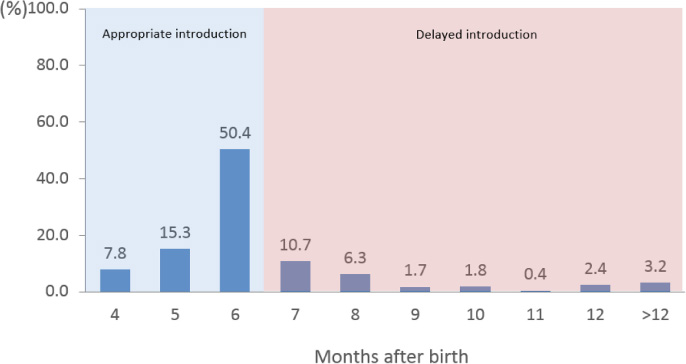
Fig. 1
Distribution of subjects according to the complementary feeding introduction N (%)
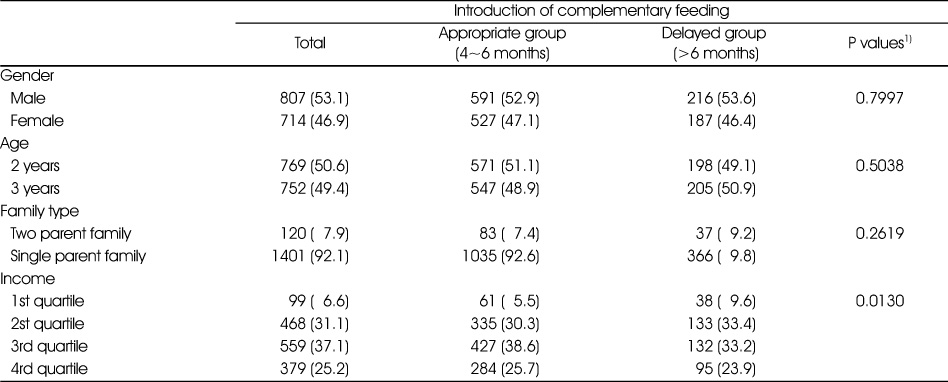
Data are presented as number of subjects and weighted percentage.
1) p value obtained by chi-square test.
Comparison of dental care behavior according to the complementary feeding introduction N (%)
Data are presented as number of subjects and weighted percentage.
1) p value obtained by chi-square test.
Comparison of feeding type according to the complementary feeding introduction N (%)
Data are presented as number of subjects and weighted percentage.
1) p value obtained by chi-square test.
Comparison of feeding duration according to the complementary feeding introduction (Mean ± SD)
1) P-value obtained by t-test.
Distribution of participants introduction of complementary feeding and early childhood caries N (%)
Data are presented as number of subjects and weighted percentage.
1) P-value obtained by chi-square test.
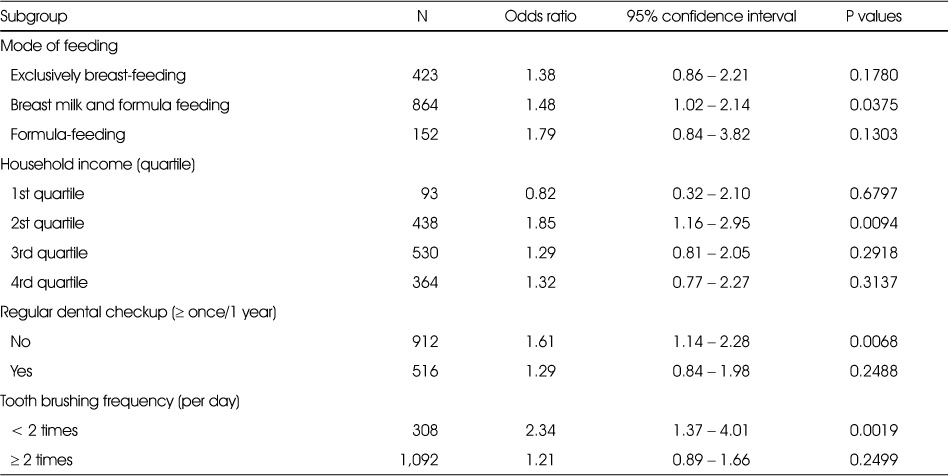
Odds ratio for early childhood caries in subgroups (N=1,390)
Odds ratio for early childhood caries among 2~3 years old toddlers (N=1,390)
Data were analyzed by complex samples logistic regression.
Independent variable is introduction of complementary feeding (categorical variable).
Model 1: Models were unadjusted association.
Model 2: Models were adjusted for household income and mode of feeding
Model 3: Models were adjusted for household income, mode of feeding and regular dental checkup
Model 4: Models were adjusted for household income, mode of feeding and tooth brushing frequency
Model 5: Models were adjusted for household income, mode of feeding, regular dental checkup, and tooth brushing frequency
Bold denotes p<0.05.
Data are presented as number of subjects and weighted percentage. 1) p value obtained by chi-square test.
Data are presented as number of subjects and weighted percentage. 1) p value obtained by chi-square test.
Data are presented as number of subjects and weighted percentage. 1) p value obtained by chi-square test.
1)
Data are presented as number of subjects and weighted percentage. 1)
Data were analyzed by complex samples logistic regression. Independent variable is introduction of complementary feeding (categorical variable). Model 1: Models were unadjusted association. Model 2: Models were adjusted for household income and mode of feeding Model 3: Models were adjusted for household income, mode of feeding and regular dental checkup Model 4: Models were adjusted for household income, mode of feeding and tooth brushing frequency Model 5: Models were adjusted for household income, mode of feeding, regular dental checkup, and tooth brushing frequency Bold denotes p<0.05.

 KSCN
KSCN


 Cite
Cite


