Articles
- Page Path
- HOME > Korean J Community Nutr > Volume 21(5); 2016 > Article
-
Research Article
- Application and Evaluation of Web-based Food Frequency Questionnaire for Korean Adolescents
-
Jinhee Yum, Seungmin Lee

-
Korean Journal of Community Nutrition 2016;21(5):440-450.
DOI: https://doi.org/10.5720/kjcn.2016.21.5.440
Published online: October 31, 2016
Department of Food and Nutrition, Sungshin Women’s University, Seoul, Korea.
- Corresponding author: Seungmin Lee. Department of Food and Nutrition, Sungshin Women’s University, 55, Dobong-ro 76 ga-gil, Gangbuk-gu, Seoul 01133, Korea. Tel: (02) 920-7671, Fax: (02) 920-2076, smlee@sungshin.ac.kr
Copyright © 2016 The Korean Society of Community Nutrition
This is an Open-Access article distributed under the terms of the Creative Commons Attribution Non-Commercial License (http://creativecommons.org/licenses/by-nc/3.0/) which permits unrestricted non-commercial use, distribution, and reproduction in any medium, provided the original work is properly cited.
- 1,016 Views
- 1 Download
Abstract
-
Objectives
- We previously developed a dish-based semi-quantitative food frequency questionnaire (FFQ) for Korean adolescents and reported that it had reasonable reliability and validity. The objective of the current study was to construct a web-based dietary evaluation system applying the FFQ for Korean adolescents and examine its applicability in the context of reliability and validity.
-
Methods
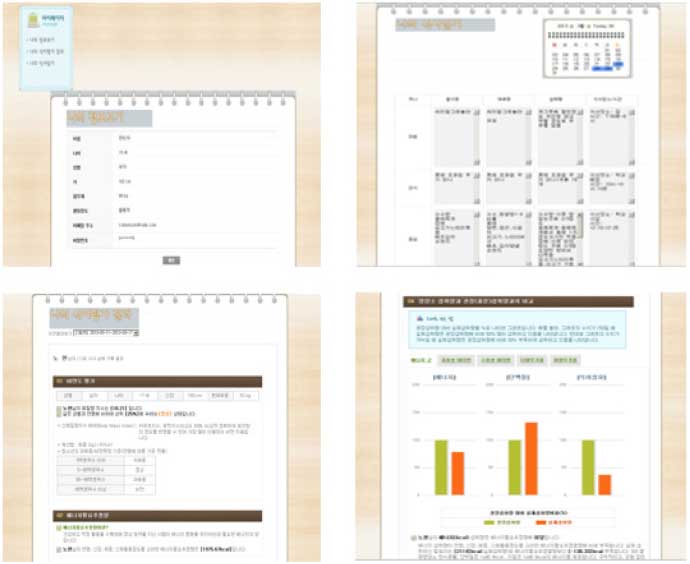
- A web-based food frequency questionnaire system was designed using a comprehensive approach, incorporating not only dietary data survey but also up-to-date nutrition information and individualized eating behavior guidelines. A convenience sample of 50 boys and girls aged 12~18 years agreed to participate in the study and completed the FFQ twice and 3 days of dietary recall on the developed website during a two-month period. The FFQ’s reliability and validity was examined using correlation and cross classification analysis. We also measured participants’ subjective levels of the web site’s usability, visual effect, understanding, and familiarity.
-
Results
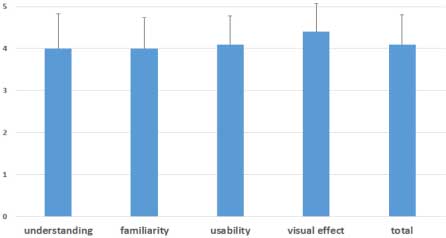
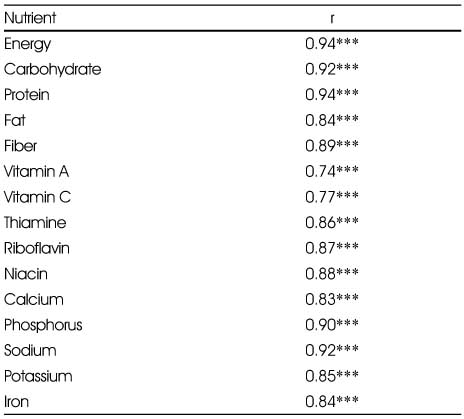
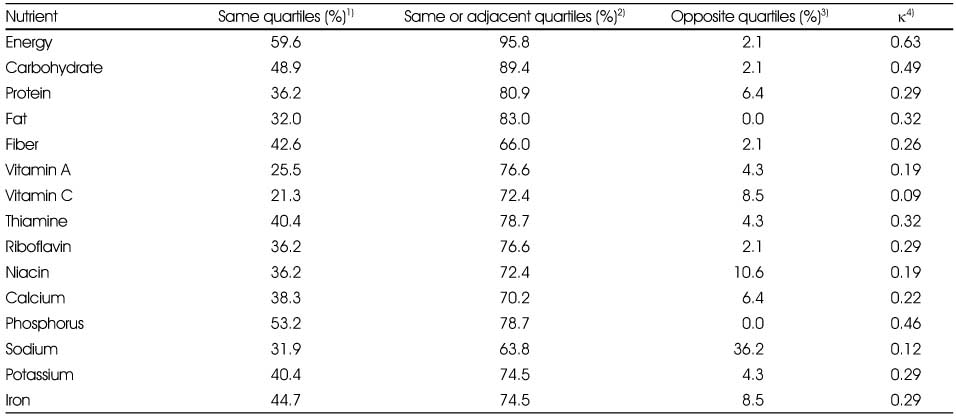
- Spearman correlation coefficients for reliability ranged from 0.74 (for vitamin A) to 0.94 (for energy). From cross-classification analyses, the proportion of subjects in the same intake quartile was highest for energy (82.0%) and lowest for vitamin A (56.0%). With regard to validity analysis, Spearman correlation coefficients ranged from 0.34 (for fiber) to 0.79 (for energy). The proportions of subjects in the opposite categories between the first FFQ and 3-day diet recall data were generally low from 0.00% (for fat) to 36.2% (for sodium). Average subjective levels of the website’s usability, visual effect, understanding, and familiarity were all found to be over 4 points out of 5 points.
-
Conclusions
- The web-based dietary evaluation system developed can serve as a valid and attractive tool for administering FFQ to Korean adolescents.
Acknowledgments
Acknowledgments
- 1. Statistics Korea. The cause of death statistics in 2015 [Internet]. Statistics Korea; 2015; 2015 Sep 30]. Available from: http://kostat.go.kr/portal/korea/index.action.
- 2. Mokdad AH, Marks JS, Stroup DF, Gerberding JL. Actual causes of death in the United States. JAMA 2004; 291(10): 1238-1245.ArticlePubMed
- 3. Ministry of Health and Welfare. Korea Centers for Disease Control and Prevention. In-depth Analysis on the 2013 Korea National Health and Nutrition Examination Survey (KNHANES VI-1): Nutrition Survey. Cheongwon: Ministry of Health and Welfare; 2014.
- 4. Willett W. Nutritional Epidemiology. 2nd ed. New York (NY): Oxford University Press; 1998.
- 5. Davison K. Finding nutrition information on the net. J Am Diet Assoc 1996; 96(8): 749-750.ArticlePubMed
- 6. Lee YM, Moon SJ. Communication technology and network information in food and nutrition. Korean J Nutr 1997; 30(7): 870-878.
- 7. Korea Internet & Security Agency. Summary Report on 2015 Internet Use Survey[Internet]. Korea Internet & Security Agency; 2015; 2016 Oct 4]. Available from: http://isis.kisa.or.kr/board/?pageId=060100&bbsId=7&itemId=813&pageIndex=1.
- 8. Arab L, Tseng CH, Ang A, Jardack P. Validity of a multipass, web-based, 24-hour self-administered recall for assessment of total energy intake in blacks and whites. Am J Epidemiol 2011; 174(11): 1256-1265.ArticlePubMedPMC
- 9. Kim MJ, Kim KW, Seo JS, Lee YM, Oh YJ, Ahn HS, et al. The development of web-based food selection program for nutrition education of children. Proceedings of 2008 Spring-Summer Symposium of the Korean Society of Community Nutrition 2008; 2008 Jun 20; Seoul. p. 167.
- 10. Rochester CD, Pradel F. Students' perceptions and satisfaction with a web-based human nutrition course. Am J Pharm Educ 2008; 72(4): 91.ArticlePubMedPMC
- 11. Maes L, Vereecken CA, Gedrich K, Rieken K, Sichert-Hellert W, De Bourdeaudhuij I, et al. A feasibility study of using a diet optimization approach in a web-based computer-tailoring intervention for adolescents. Int J Obes (Lond) 2008; 32: S76-S81.ArticlePDF
- 12. Hanning RM, Royall D, Toews JE, Blashill L, Wegener J, Driezen P. Web-based food behaviour questionnaire: validation with grades six to eight students. Can J Diet Pract Res 2009; 70(4): 172-178.ArticlePubMed
- 13. Matthys C, Pynaert I, Keyzer W, Henauw S. Validity and reproducibility of an adolescent web-based food frequency questionnaire. J Am Diet Assoc 2007; 107(4): 605-610.ArticlePubMed
- 14. Filippi AR, Amodio E, Napoli G, Breda J, Bianco A, Jemni M, et al. The web-based ASSO-food frequency questionnaire for adolescents: relative and absolute reproducibility assessment. Nutr J 2014; 13(1): 119.ArticlePubMedPMCPDF
- 15. Segovia-Siapco G, Oda K, Sabate J. Evaluation of the relative validity of a web-based food frequency questionnaire used to assess soy isoflavones and nutrient intake in adolescents. BMC Nutr 2016; 2(1): 39.ArticlePDF
- 16. Siapco GS, Oda K, Sabate J. Comparison of a web-based food frequency questionnaire with photograph-assisted food records in assessing nutrient intake of adolescents. FASEB J 2016; 30(1): 1153-1159.Article
- 17. Hong S, Kim G. Manipulation system for nutrition counseling based on internet. J Korean Diet Assoc 2004; 10(3): 284-292.
- 18. Moore TJ, Alsabeeh N, Apovian CM, Murphy MC, Coffman GA, Cullum-Dugan D, et al. Weight, blood pressure, and dietary benefits after 12 months of a web-based nutrition education program (DASH for health): longitudinal observational study. J Med Internet Res 2008; 10(4): e52.ArticlePubMedPMC
- 19. McMahon GT, Gomes HE, Hohne SH, Hu TM, Levine BA, Conlin PR. Web-based care management in patients with poorly controlled diabetes. Diabetes Care 2005; 28(7): 1624-1629.ArticlePubMedPDF
- 20. Han JS, Jeong JH. A web-based internet program for nutritional counseling and diet management of patient with diabetes mellitus. J Korean Soc Food Sci Nutr 2004; 33(1): 114-122.Article
- 21. Hyun TS, Yon MY, Kim SH, Kim NH, An SM, Lee SM, et al. Development of a nutrition education website for children. Korean J Community Nutr 2003; 8(3): 259-269.
- 22. Yang IS, Kim HY, Lee HY, Kang YH. Effectiveness of webbased nutritional education program for junior and senior high school students. Korean J Nutr 2004; 37(7): 576-584.
- 23. Dalton JE. Web-based care for adults with type 2 diabetes. Can J Diet Pract Res 2008; 69(4): 185-191.ArticlePubMed
- 24. Margolis LM, Grediagin A, Koenig C, Sanders LF. Effectiveness and acceptance of web-based learning compared to traditional face-to-face learning for performance nutrition education. Mil Med 2009; 174(10): 1095-1099.ArticlePubMed
- 25. Sacks N, Cabral H, Kazis LE, Jarrett KM, Vetter D, Richmond R, et al. A web-based nutrition program reduces health care costs in employees with cardiac risk factors: before and after cost analysis. J Med Internet Res 2009; 11(4): e43.ArticlePubMedPMC
- 26. Stopponi MA, Alexander GL, McClure JB, Carroll NM, Divine GW, Calvi JH, et al. Recruitment to a randomized web-based nutritional intervention trial: characteristics of participants compared to non-participants. J Med Internet Res 2009; 11(3): e38.ArticlePubMedPMC
- 27. Alexander GL, McClure JB, Clavi JH, Divine GW, Stopponi MA, Rolnick SJ, et al. A randomized clinical trial evaluating online interventions to improve fruit and vegetable consumption. Am J Public Health 2010; 100(2): 319-326.ArticlePubMedPMC
- 28. Yon MY, Park C, Yoo KH, Hyun TS. Development and evaluation of a nutrition education website for the prevention and management of childhood obesity. Korean J Community Nutr 2012; 17(4): 390-406.Article
- 29. Yum JH, Lee SM. Development and evaluation of a dish-based semiquantitative food frequency questionnaire for Korean adolescents. Nutr Res Pract 2016; 10(4): 433-441.ArticlePubMedPMCPDF
REFERENCES
Average subjective levels website's understanding, familiarity, usability visual effect and total (N=50)
Agreement proportions in quartile distributions for reliability between FFQ 1 and FFQ 2 (N=50)
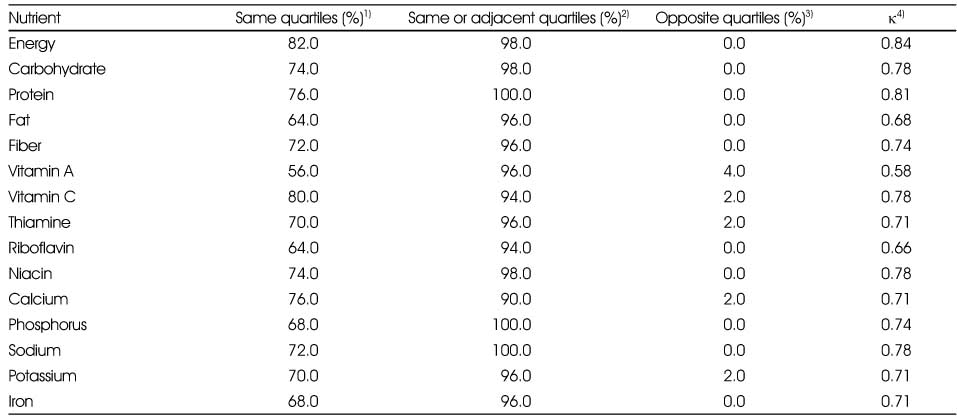
Figure & Data
REFERENCES
Citations


Fig. 1
Fig. 2
Fig. 3
Fig. 4
Fig. 5
Fig. 6
Spearman Correlation coefficients for reliability between FFQ 1 and FFQ 2 (N=50)
*: p<0.05, **: p<0.01, ***: p<0.001
Agreement proportions in quartile distributions for reliability between FFQ 1 and FFQ 2 (N=50)
1) Percentage of subjects in the same quartile of nutrient intakes from FFQ1 and FFQ2
2) Percentage of subjects in the same or adjacent quartiles of nutrient intakes from FFQ1 and FFQ2
3) Opposite (lowest/highest) quartiles
4) Weighted kappa
Spearman Correlation coefficients for validity between FFQ 1 and 3-days food records (N=50)
*: p<0.05, **: p<0.01, ***: p<0.001
Agreement proportions in quartile distributions for validity between FFQ 1 and 3-days food records (N=50)
1) Percentage of subjects in the same quartile of nutrient intakes from 3-days food records and FFQ1
2) Percentage of subjects in the same or adjacent quartiles of nutrient intakes from 3-days food records and FFQ1
3) Opposite (lowest/highest) quartiles
4) Weighted kappa
*: p<0.05, **: p<0.01, ***: p<0.001
1) Percentage of subjects in the same quartile of nutrient intakes from FFQ1 and FFQ2 2) Percentage of subjects in the same or adjacent quartiles of nutrient intakes from FFQ1 and FFQ2 3) Opposite (lowest/highest) quartiles 4) Weighted kappa
*: p<0.05, **: p<0.01, ***: p<0.001
1) Percentage of subjects in the same quartile of nutrient intakes from 3-days food records and FFQ1 2) Percentage of subjects in the same or adjacent quartiles of nutrient intakes from 3-days food records and FFQ1 3) Opposite (lowest/highest) quartiles 4) Weighted kappa

 KSCN
KSCN



 Cite
Cite


