
Articles
- Page Path
- HOME > Korean J Community Nutr > Volume 18(1); 2013 > Article
-
Original Article
- Nutritional Evaluation and Its Relation to the Risk of Metabolic Syndrome according to the Consumption of Cooked Rice and Cooked Rice with Multi-grains in Korean Adults: Based on 2007-2008 Korean National Health and Nutrition Examination Survey
- Soo-Hyun Son, Hwa-Jung Lee, Kyong Park, Tae-Youl Ha, Jung-Sook Seo
-
Korean Journal of Community Nutrition 2013;18(1):77-87.
DOI: https://doi.org/10.5720/kjcn.2013.18.1.77
Published online: February 28, 2013
Department of Food & Nutrition, Yeungnam University, Gyeongsan, Korea.
1Department of Statistics, Yeungnam University, Gyeongsan, Korea.
2Korea Food Research Institute, Gyeonggi, Korea.
- Corresponding author: Jung-Sook Seo, Department of Food and Nutrition, Yeungnam University, Gyeongsan 712-749, Korea. Tel: (053) 810-2875, Fax: (053) 810-4768, jsseo@ynu.ac.kr
• Received: January 7, 2013 • Revised: February 15, 2013 • Accepted: February 25, 2013
Copyright © 2013 The Korean Society of Community Nutrition
- 2,188 Views
- 4 Download
- 15 Crossref
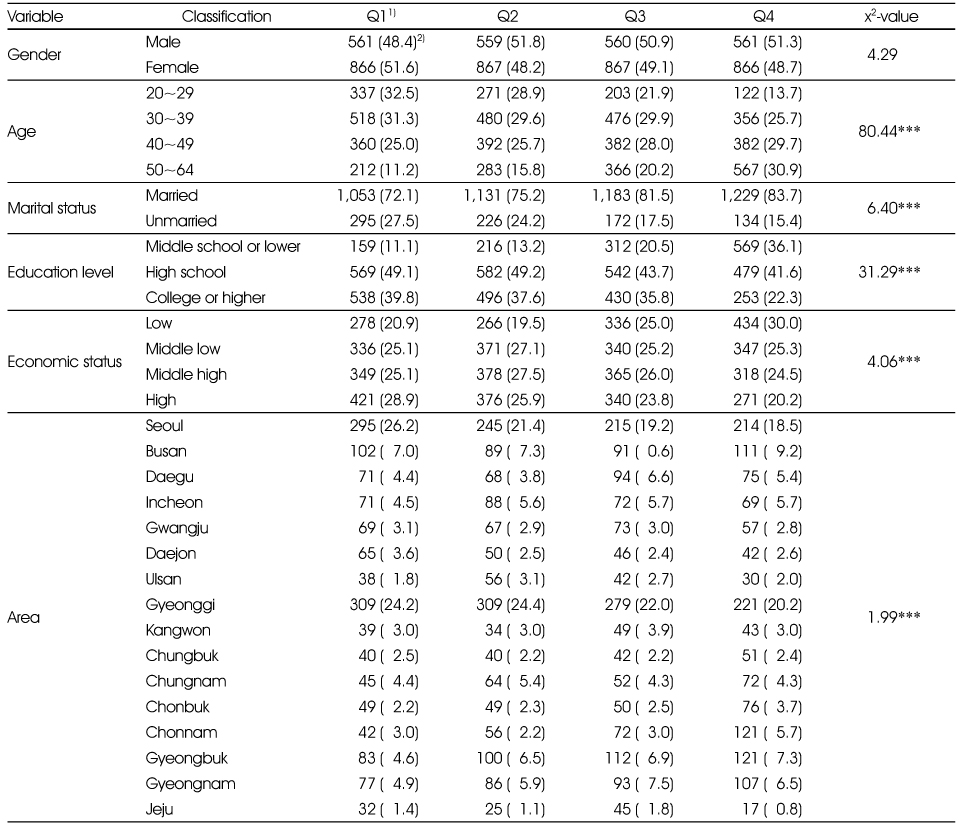
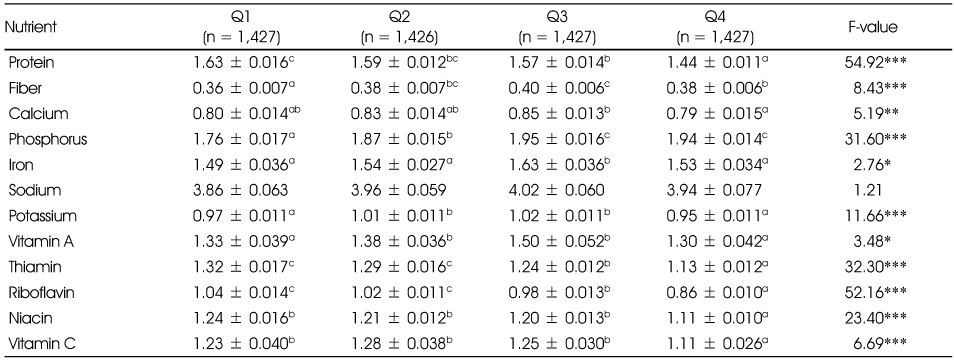
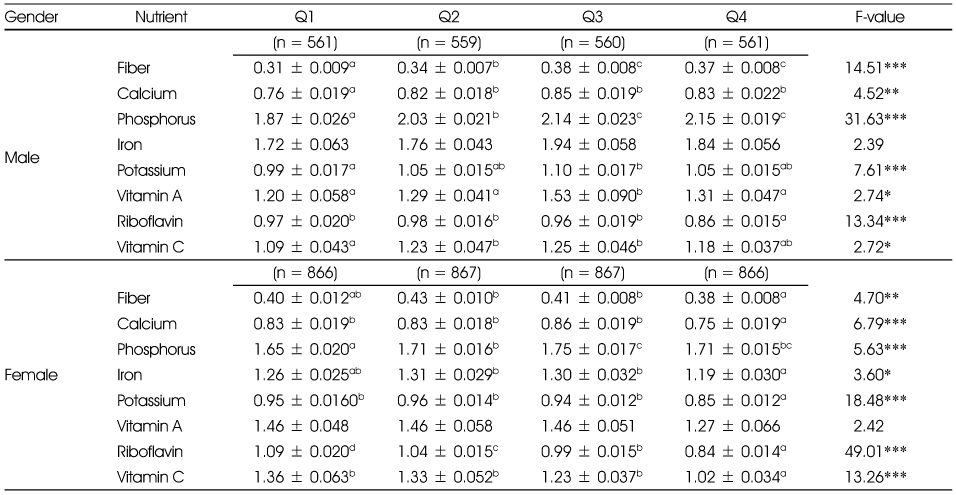
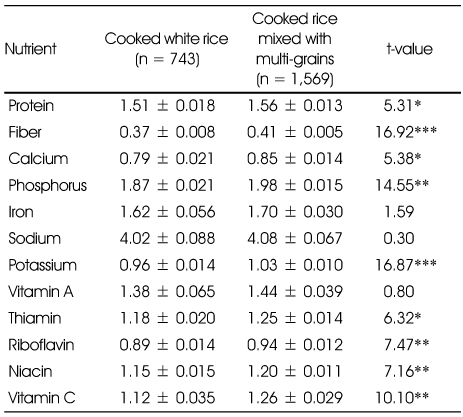
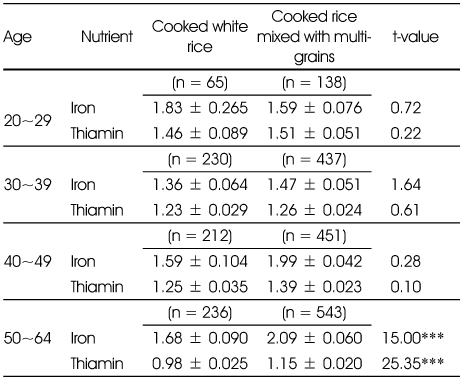
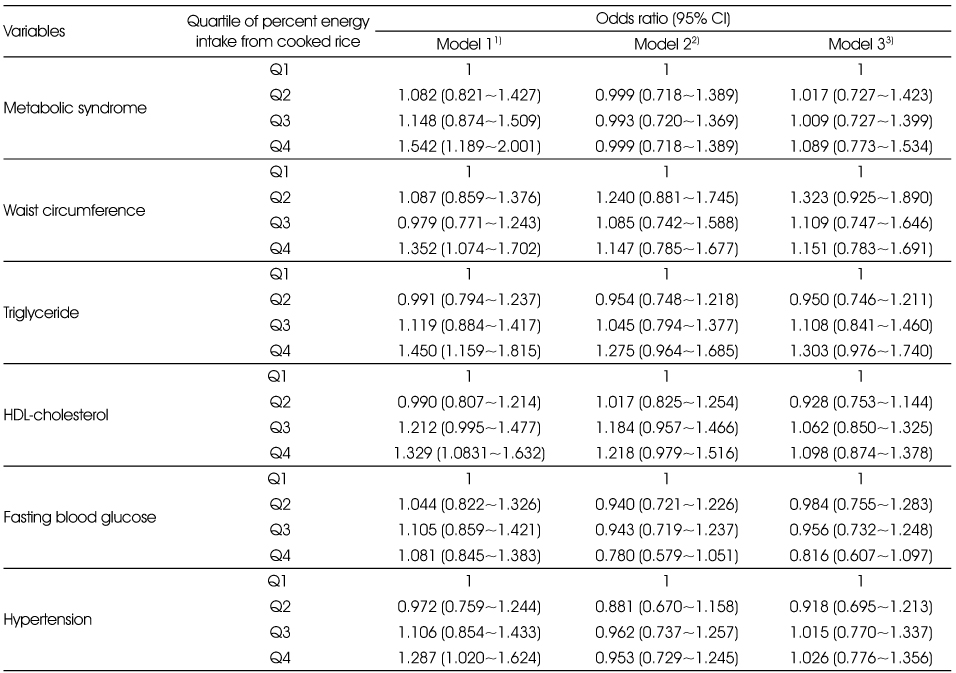
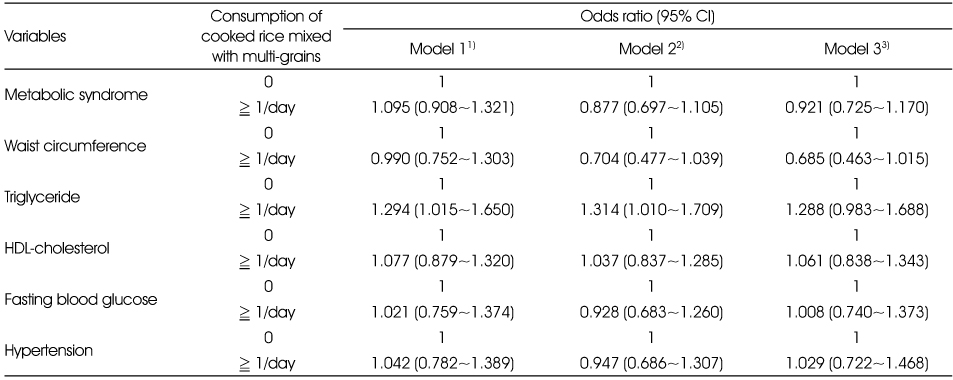
Figure & Data
REFERENCES
Citations
Citations to this article as recorded by 
- Dietary patterns and diet quality among adults in their 20s according to rice consumption: a co-occurrence network analysis using the Korea National Health and Nutrition Examination Survey (KNHANES) 2019–2021
Eun-kyung Kim, Jin-Young Lee, Yong-Seok Kwon, Minji Kang
Journal of Nutrition and Health.2025; 58(6): 571. CrossRef - Associations of Whole Grain and Refined Grain Consumption With Metabolic Syndrome. A Meta-Analysis of Observational Studies
Hongbin Guo, Jun Ding, Jieyu Liang, Yi Zhang
Frontiers in Nutrition.2021;[Epub] CrossRef - Association of Korean fermented cabbage kimchi consumption with an incidence of metabolic syndrome: 10-year follow-up results of the Korean Genome and Epidemiology Study
Suk Hyeon Seo, Jiyoun Hong, Im Huei Son, Young Hee Han, Taisun Hyun
Journal of Nutrition and Health.2019; 52(6): 569. CrossRef - Dietary quality differs by consumption of meals prepared at home vs. outside in Korean adults
Kyung Won Lee, Won O. Song, Mi Sook Cho
Nutrition Research and Practice.2016; 10(3): 294. CrossRef - Diet Pattern According to Socio-Economic status - Using the Fifth (2010-2012) Korea National Health and Nutrition Examination Survey
Han Na Kim, Hyo Eun Park
The International Journal of Advanced Culture Technology.2016; 4(3): 24. CrossRef - Evaluation of Obesity and Nutritional Status by Age among Low-income Women aged over 20 -Using Data from the Fourth Korea National Health and Nutrition Examination Survey-
Hee-Kyung Jang
Journal of the East Asian Society of Dietary Life.2015; 25(2): 246. CrossRef - The Development of Institutional Food-Service Menu with Temple Food
Sim-Yeol Lee, Jin-A Kim
Korean Journal of Community Nutrition.2015; 20(5): 338. CrossRef - Adequate Standard Pot and Number of Plants Per Tree of Raising Seeding Pot on the Foxtail Millet Transplanting Culture in the Southern Province
Yong-Soon Kim, Dong-Kwan Kim, Jin-Gyung Choi, Heung-Gyu Park, Myeong-Seok Kim, Hae-Ryoung Shin, Gyung-Ju Choi, Jong-Tag Yun
The Korean Journal of Crop Science.2015; 60(1): 23. CrossRef - Analysis of Dietary Intake Status and Risk of Metabolic Syndrome According to White Rice Consumption in Korea: Basted on Data 1st (1998), 4th (2007~2009), 6th (2013) Korean National Health and Nutrition Examination Survey (KNHANES)
Fang-Fang Song, Jin-A Jang, Yang-suk Kim, Hei-ryeo Yoon, Mi-Sook Cho
Journal of The Korean Society of Food Culture.2015; 30(5): 682. CrossRef - The Effect on Behavior of Instant Rice Selected Attributes According to Food Lifestyle
Inja Youn, Sohyeong Myeong, Deokihn Yoon
Journal of The Korean Society of Food Culture.2015; 30(6): 804. CrossRef - The Relationship between Health Behavior and General Health Status: Based on 2011 Korea National Health and Nutrition Examination Survey
Chunhoo Cheon, So-Mi Oh, Soobin Jang, Jeong-Su Park, Sunju Park, Bo-Hyoung Jang, Yong-Cheol Shin, Seong-Gyu Ko
Osong Public Health and Research Perspectives.2014; 5(1): 28. CrossRef - An Evaluation of Dietary Habit and Nutritional Status by Household Income in Female Adults over the Age of 20 - Using Data from the Fourth Korea National Health and Nutrition Examination Survey -
Hee-Kyung Jang
The Korean Journal of Food And Nutrition.2014; 27(4): 660. CrossRef - The Risk of Metabolic Syndrome by Dietary Patterns of Middle-aged Adults in Gyeonggi Province
You-Sin Lee, Moo-Yong Lee, Sim-Yeol Lee
Korean Journal of Community Nutrition.2014; 19(6): 527. CrossRef - Cooking Properties and Antioxidant Activity of Cooked Rice According to the Addition of Glutinous and Non-glutinous Sorghum
Koan Sik Woo, Jee Yeon Ko, Jung In Kim, Jae Saeng Lee, Seuk Bo Song, Jae Min Cho, Tae Wook Jung, Ki Young Kim, In Seok Oh
Korean Journal of Crop Science.2013; 58(4): 399. CrossRef - Nutritional Assessment and Perioperative Nutritional Support in Gastric Cancer Patients
Kyung Won Seo, Ki Young Yoon
The Korean Journal of Gastroenterology.2013; 61(4): 186. CrossRef
 Cite
Cite- We recommend
- Related articles
-
- Changing patterns and related factors of kimchi consumption among Korean adults: a nationwide cross-sectional analysis of the Korea National Health and Nutrition Examination Survey, 2010–2024
- Association between nutrient intake and frailty status in Korean older adults: a cross-sectional study using the 9th (2022–2023) Korea National Health and Nutrition Examination Survey
- Self-reported weight change and diet quality in relation to metabolic syndrome among Korean cancer survivors: a cross-sectional study using the Korea National Health and Nutrition Examination Survey 2019–2021
Nutritional Evaluation and Its Relation to the Risk of Metabolic Syndrome according to the Consumption of Cooked Rice and Cooked Rice with Multi-grains in Korean Adults: Based on 2007-2008 Korean National Health and Nutrition Examination Survey
Nutritional Evaluation and Its Relation to the Risk of Metabolic Syndrome according to the Consumption of Cooked Rice and Cooked Rice with Multi-grains in Korean Adults: Based on 2007-2008 Korean National Health and Nutrition Examination Survey
General characteristics of the subjects by quartile of percent energy intake from cooked rice in KNHANES (2007~2008)
1) Quartile of percent energy intake from cooked rice
2) N (%)
***: p < 0.001
Mean daily INQ1) of the total subjects by quartile of percent energy intake from cooked rice in KNHANES (2007~2008)2)
1) INQ: Index of Nutritional Quality
2) Age-adjusted results
Values with different letter within the row are significantly different by Bonferroni method (p < 0.05)
*: p < 0.05, **: p < 0.01, ***: p < 0.001
Mean daily INQ1) of male and female subjects by quartile of percent energy intake from cooked rice in KNHANES (2007~2008)2)
1) INQ: Index of Nutritional Quality
2) Age-adjusted results
Values with different letter within the row are significantly different by Bonferroni method (p < 0.05)
*: p < 0.05, **: p < 0.01, ***: p < 0.001
Mean daily INQ1) of the total subjects by consumption of cooked rice mixed with multi-grains in KNHANES (2007~2008)2)
1) INQ: Index of Nutritional Quality
2) Age-adjusted results
*: p < 0.05, **: p < 0.01, ***: p < 0.001
Mean daily INQ1) of age group by consumption of cooked rice mixed with multi-grains in KNHANES (2007~2008)
1) INQ: Index of Nutritional Quality
***: p < 0.001
Odds ratio and 95% CI for metabolic syndrome and metabolic risk factors by quartile of percent energy intake from cooked rice in KNHANES (2007~2008)
1) Model 1: Crude
2) Model 2: Adjusted for age, energy, sex, BMI
3) Model 3: Adjusted for age, energy, sex, BMI, alcohol, smoke, income, activity
Odds ratio and 95% CI for metabolic syndrome and metabolic risk factors by consumption of cooked rice mixed with multi-grains in KNHANES (2007~2008)
1) Model 1: Crude
2) Model 2: Adjusted for age, energy, sex, BMI
3) Model 3: Adjusted for age, energy, sex, BMI, alcohol, smoke, income, activity
Table 1
General characteristics of the subjects by quartile of percent energy intake from cooked rice in KNHANES (2007~2008)
1) Quartile of percent energy intake from cooked rice 2) N (%) ***: p < 0.001
Table 2
Mean daily INQ1) of the total subjects by quartile of percent energy intake from cooked rice in KNHANES (2007~2008)2)
1) INQ: Index of Nutritional Quality 2) Age-adjusted results Values with different letter within the row are significantly different by Bonferroni method (p < 0.05) *: p < 0.05, **: p < 0.01, ***: p < 0.001
Table 3
Mean daily INQ1) of male and female subjects by quartile of percent energy intake from cooked rice in KNHANES (2007~2008)2)
1) INQ: Index of Nutritional Quality 2) Age-adjusted results Values with different letter within the row are significantly different by Bonferroni method (p < 0.05) *: p < 0.05, **: p < 0.01, ***: p < 0.001
Table 4
Mean daily INQ1) of the total subjects by consumption of cooked rice mixed with multi-grains in KNHANES (2007~2008)2)
1) INQ: Index of Nutritional Quality 2) Age-adjusted results *: p < 0.05, **: p < 0.01, ***: p < 0.001
Table 5
Mean daily INQ1) of age group by consumption of cooked rice mixed with multi-grains in KNHANES (2007~2008)
1) INQ: Index of Nutritional Quality ***: p < 0.001
Table 6
Odds ratio and 95% CI for metabolic syndrome and metabolic risk factors by quartile of percent energy intake from cooked rice in KNHANES (2007~2008)
1) Model 1: Crude 2) Model 2: Adjusted for age, energy, sex, BMI 3) Model 3: Adjusted for age, energy, sex, BMI, alcohol, smoke, income, activity
Table 7
Odds ratio and 95% CI for metabolic syndrome and metabolic risk factors by consumption of cooked rice mixed with multi-grains in KNHANES (2007~2008)
1) Model 1: Crude 2) Model 2: Adjusted for age, energy, sex, BMI 3) Model 3: Adjusted for age, energy, sex, BMI, alcohol, smoke, income, activity


