
Articles
- Page Path
- HOME > Korean J Community Nutr > Volume 22(3); 2017 > Article
-
Review
- Systematic Review on the Study of the Childhood and Adolescent Obesity in Korea: Dietary Risk Factors
-
Eun Jeong Heo, Jae Eun Shim
 , Eun Young Yoon
 -
Korean Journal of Community Nutrition 2017;22(3):191-206.
DOI: https://doi.org/10.5720/kjcn.2017.22.3.191
Published online: June 30, 2017
1Department of Food and Nutrition, Daejeon University, Daejeon, Korea.
2Nutrition Counseling Center, Daejeon University, Daejeon, Korea.
3Daejeon Dong-gu Center for Children's Food Service Management, Daejeon, Korea.
- Corresponding author: Jae Eun Shim. Department of Food and Nutrition, Daejeon University, 62 Daejeon 300-716, Korea. Tel: (042) 280-2469, Fax: (042) 280-2468, jshim@dju.kr
• Received: May 13, 2017 • Revised: June 24, 2017 • Accepted: June 24, 2017
Copyright © 2017 The Korean Society of Community Nutrition
This is an Open-Access article distributed under the terms of the Creative Commons Attribution Non-Commercial License (http://creativecommons.org/licenses/by-nc/3.0/) which permits unrestricted non-commercial use, distribution, and reproduction in any medium, provided the original work is properly cited.
- 2,327 Views
- 17 Download
- 9 Crossref
Abstract
-
Objectives
- The present study systematically reviewed previous studies published in Korea regarding obesity status of children and adolescents in order to provide valid directions for future research and to help establish evidence-based prevention strategies.
-
Methods
- The articles were selected by searching the primary keyword ‘obesity’ and the secondary keywords ‘children’, ‘young children’, ‘adolescents’ or ‘kids’ on the KISS (Korean Studies Information Service System). Out of 503 articles excluding the overlap, 308 articles were selected with inclusion and exclusion criteria. Secular trends of obesity research, distribution of subjects, potential risk factors for obesity, and intervention method for obesity management were documented. The associations between obesity and dietary factors were summarized.
-
Results
- The overall number of research studies has increased since 2000 but obesity management studies have decreased in recent years. Most of the studies used a cross-sectional design. Research on preschool children were extremely limited. Intervention studies targeting males were prevalent. The most significant variables relevant to dietary habits were speed of eating, regular breakfast and snacking. The most significant food and nutrient intake factors were thiamin and iron. Intakes of cereals and animal foods were significantly higher in obese children than the counterparts.
-
Conclusions
- The present review of locally published articles on the obesity status in children and adolescents suggested the need for well-designed further studies focused on risk factors of obesity and on a range of intervention methods conducive to the development of obesity prevention and management programs.
Acknowledgments
Acknowledgments
- 1. Guo SS, Roche AF, Chumlea WC, Gardner JD, Siervogel RM. The predictive value of childhood body mass index values for overweight at age 35y. Am J Clin Nutr 1994; 59(4): 810-819.ArticlePubMed
- 2. Park HG. Childhood and adolescent obesity. Korean J Obes 1998; 7(4): 274-279.
- 3. Mossberg HO. 40-year follow-up of overweight children. Lancet 1989; 334(8661): 491-493.Article
- 4. Jung MS. A study on the relationship between obesity and lifestyle habits of middle school students in Seoul [master's thesis]. Yonsei University; 1989.
- 5. Kim HR. A strategy for child and adolescent health promotion: nutrition, overweight and obesity. Forum Health Welf 2008; 141: 20-31.
- 6. Kim JH, Kim BH, Kim HK, Son SM, Mo SM, Choi HM. A study on food ecology according to obesity index of elementary school children in a high socioeconomic apartment complex in Seoul. Korean J Diet Cult 1993; 8(3): 275-287.
- 7. Jeon SY. The mediating effects of ego-resiliency on the relationship between child's obesity stress and depression. Korean J Manag Assoc 2008; 26(5): 155-163.
- 8. Emmett PM, Jones LR. Diet, growth, and obesity development throughout childhood in the Avon longitudinal study of parents and children. Nutr Rev 2015; 73(Suppl 3): 175-206.ArticlePMC
- 9. Ebbeling CB, Pawlak DB, Ludwig DS. Childhood obesity: Public-health crisis, common sense cure. Lancet 2002; 360(9331): 473-482.ArticlePubMed
- 10. Brown CL, Halvorson EE, Cohen GM, Lazorick S, Skelton JA. Addressing childhood obesity: Opportunities for prevention. Pediatr Clin North Am 2015; 62(5): 1241-1261.PubMedPMC
- 11. Wofford LG. Systematic review of childhood obesity prevention. J Pediatr Nurs 2008; 23(1): 5-19.ArticlePubMed
- 12. Yun SH, Kim HJ, Oh KW. Prevalence of obesity among children and adolescent in Korea. Center for Disease Prevention; 2015 10. Report No. 8.
- 13. Korea Centers for Disease Control and Prevention. The Korea youth risk behavior web-based survey [Internet]. Korea Centers for Disease Control and Prevention; 2009; cited 2017 Jun 21]. Available from: https://yhs.cdc.go.kr/.
- 14. Korea Centers for Disease Control and Prevention. The Korea youth risk behavior web-based survey [Internet]. Korea Centers for Disease Control and Prevention; 2012; cited 2017 Jun 21]. Available from: https://yhs.cdc.go.kr/.
- 15. Korea Centers for Disease Control and Prevention. The Korea youth risk behavior web-based survey [Internet]. Korea Centers for Disease Control and Prevention; 2015; cited 2017 Jun 21]. Available from: https://yhs.cdc.go.kr/.
- 16. Lee TY, Nam TW, Cho IS. A study of planning of a nation-wide science information system for Korea. J Korean Soc Libr Inf Sci 1997; 31(4): 187-214.
- 17. Park YS, Lee DH, Choi JM, Kang YJ, Kim CH. Trend of obesity in school age children in Seoul over the past 23 years. Korean J Pediatr 2004; 47(3): 247-257.
- 18. Park SJ. A survey on the fatness extent of middle school students in Seoul, on their habit and on their tendency [master's thesis]. Sejong University; 2002.
- 19. Shin M, Jeon SH, Yoo MS. A study on factors affecting life satisfaction and wellbeing in youth. Korean J Youth Stud 2010; 17(9): 131-150.
- 20. Lee HS. The effect of nutrition education and exercise intervention on nutrient intakes, body composition, serum lipids and physical fitness in obese women [master's thesis]. Ewha Womans University; 2010.
- 21. Shirai K, Shinomiya M, Satio Y, Umezono T, Takahasi K, Yoshida S. Incidence of childhood obesity over the last 10 years in Japan. Diabetes Res Clin Pract 1990; 10(1): S65-S70.ArticlePubMed
- 22. Park HW. A study on the antecedents (temperament and eating environment) of eating habits in young children and their developmental changes. Korean J Hum Dev 1996; 3(1): 25-43.
- 23. Park YS, Chun HJ, Song BK. Determining obesity frequency of rural children by skinfold thickness, analyzing their KAP related to obesity and obesity camp strategy. Korean J Community Nutr 2000; 5(3): 502-512.
- 24. Lee HH, Choi SK, Seo JS. Obesity index and related factors among elementary school students visiting pediatric department of general hospital. Korean J Diet Assoc 2012; 18(2): 186-199.Article
- 25. Han JS, Rhee SH. The relationship between serum cholesterol level and dietary intake in obese children. Korean J Soc Food Nutr 1996; 25(3): 433-440.
- 26. Son SM, Lee JH. Obesity, serum lipid and related eating behaviors of school children. Korean J Community Nutr 1997; 2(2): 141-150.
- 27. Yim KS, Yoon EY, Kim CI, Kim KT, Kim CI, Mo SM. Eating behavior, obesity and serum lipid levels in children. Korean J Nutr 1993; 26(1): 56-66.
- 28. Park KW, Lee KY, Park TJ, Kwon ER, Ha SJ, Moon HJ. The factors associated with becoming obese children: in 6th grade children of elementary schools in Busan. Korean J Fam Med 2003; 24(8): 739-745.
- 29. Moon SS, Lee YS. Comparison of dietary habits, exercise, recognized body shapes and weight control between obesity and underweight of adolescents. Korean J Hum Ecol 2009; 18(6): 1337-1348.Article
- 30. Kim MH. Eating habit, body image, and weight control behavior by BMI in Korean female high school students: Using Korea youth risk behavior web-based survey 2010 data. Korean J Food Nutr 2012; 25(3): 579-589.Article
- 31. Han YS, Joo NM. An analysis on the factors of adolescence obesity. J Korean Soc Food Cult 2005; 20(2): 172-185.
- 32. Choi JI, Kang H. An investigation of factors influencing adolescents' obesity. Korea Sport Res 2003; 14(6): 1921-1931.
- 33. Bae YJ, Kim EY, Cho HK, Kim MH, Choi MK, Sung MK. Relation among dietary habits, nutrient intakes and bone mineral density in Korean normal and obese elementary students. Korean J Community Nutr 2006; 11(1): 14-24.
- 34. Lee HS, Jeong WS, Park UI. Blood lipid level, nutrient intake, self-esteem and physical activity of obese and normal weight elementary school children. Korean J Diet Assoc 2006; 12(2): 146-156.
- 35. Kim MJ. The effect of eating habit, life behavior and body image of higher grade elementary school children and parents in child obesity degree. Korean J Growth Dev 2013; 21(3): 227-235.
- 36. Lee SA, Bae YJ, Sung CJ. A study on nutritional status of iron in Korean normal and obese male elementary school students. Korean J Diet Assoc 2006; 12(1): 55-67.
- 37. Kim MJ. The effect of eating habit and life behavior of elementary school children and parents in child obesity. Korean J Growth Dev 2012; 20(1): 9-15.
- 38. Kim JD, Kim WK, Rhim YT, Kim MJ. The difference for eating, activity, life pattern between obese and normal child who 5-6 grade in elementary school. J Sport Leis Stud 2009; 38(2): 855-865.Article
- 39. Kim EK, Lee AR, Kim JJ, Kim MH, Kim JS, Moon HK. The difference of biochemical status, dietary habits and dietary behaviors according to the obesity degree among obese children. Korean J Diet Assoc 2000; 6(2): 161-170.
- 40. Lee JR, Park CM. Study on an actual condition and relevant factors of obesity of elementary school students. Korean J Health Educ Promot 2004; 21(2): 35-54.
- 41. Yang KH, Kim YH. The factors related to obesity level of upper level elementary students. Korean J Health Educ Promot 2004; 21(2): 133-146.
- 42. Park KJ. A study on analysis of obesity factors in elementary school children. Korean J Phys Educ Assoc Girls Women 2001; 15(1): 57-67.
- 43. Kim MK, Kim HJ, Kim YO, Lee JH, Lee WC. Overweight among preschool children in Seoul: prevalence and associated factors. Korean J Community Nutr 2001; 6(2): 121-129.
- 44. Lee JB, Lee JO, Kim SW, Kang JH, Yang YJ. The prevalence and risk factors of childhood obesity in elementary students in Seoul. J Korean Acad Fam Med 2000; 21(7): 866-875.
- 45. Kim YK, Chyun JH. Food habits and its relation to the obesity of preschool children living in urban area. Korean J Diet Cult 2000; 15(5): 349-360.
- 46. Lee YJ, Chang KJ. A comparative study of obese children and normal children on dietary intake and environmental factors at an elementary school in Inchon. Korean J Community Nutr 1999; 4(4): 504-511.
- 47. Kang YR. A retrospective study on the prevalence of obesity in elementary school children. Korean J Diet Assoc 1996; 2(2): 168-180.
- 48. Kang YR, Paik HY. A study on the etiology of childhood obesity. J Nutr Health 1988; 21(5): 283-294.
- 49. Cha MS. A study on obese elementary school children in Seoul. J Elementary Educ 1988; 2(1): 55-73.
- 50. Heo GJ, Nam SY, Lee SK, Chung SJ, Yoon JH. The relationship between high energy/low nutrient food consumption and obesity among Korean children and adolescents. Korean J Community Nutr 2012; 17(2): 226-242.Article
- 51. Bae YJ. Evaluation of nutrient intake and anthropometric parameters related to obesity in Korean female adolescents according to dietary diversity score: From the Korean National Health and Nutrition Examination Surveys, 2007-2009. Korean J Community Nutr 2012; 17(4): 419-428.Article
- 52. Kim JY, Han YS, Bae HS, Ahn HS. Dietary intakes and serum lipids and iron indices in obese children. Korean J Community Nutr 2006; 11(5): 575-586.
- 53. Lee JC, Kim MH. A study on dietary related factors and blood parameters of obese children residing in Samcheok. Korean J Diet Assoc 2005; 11(2): 190-204.
- 54. Ko SH, Yu HR. The influences of energy consumption on obesity and physical fitness. Korean J Phys Educ 1998; 37(1): 161-172.
REFERENCES

Table 1

Study variables and distribution of study design for the individual risk factors of obesity (n=138)


Table 4
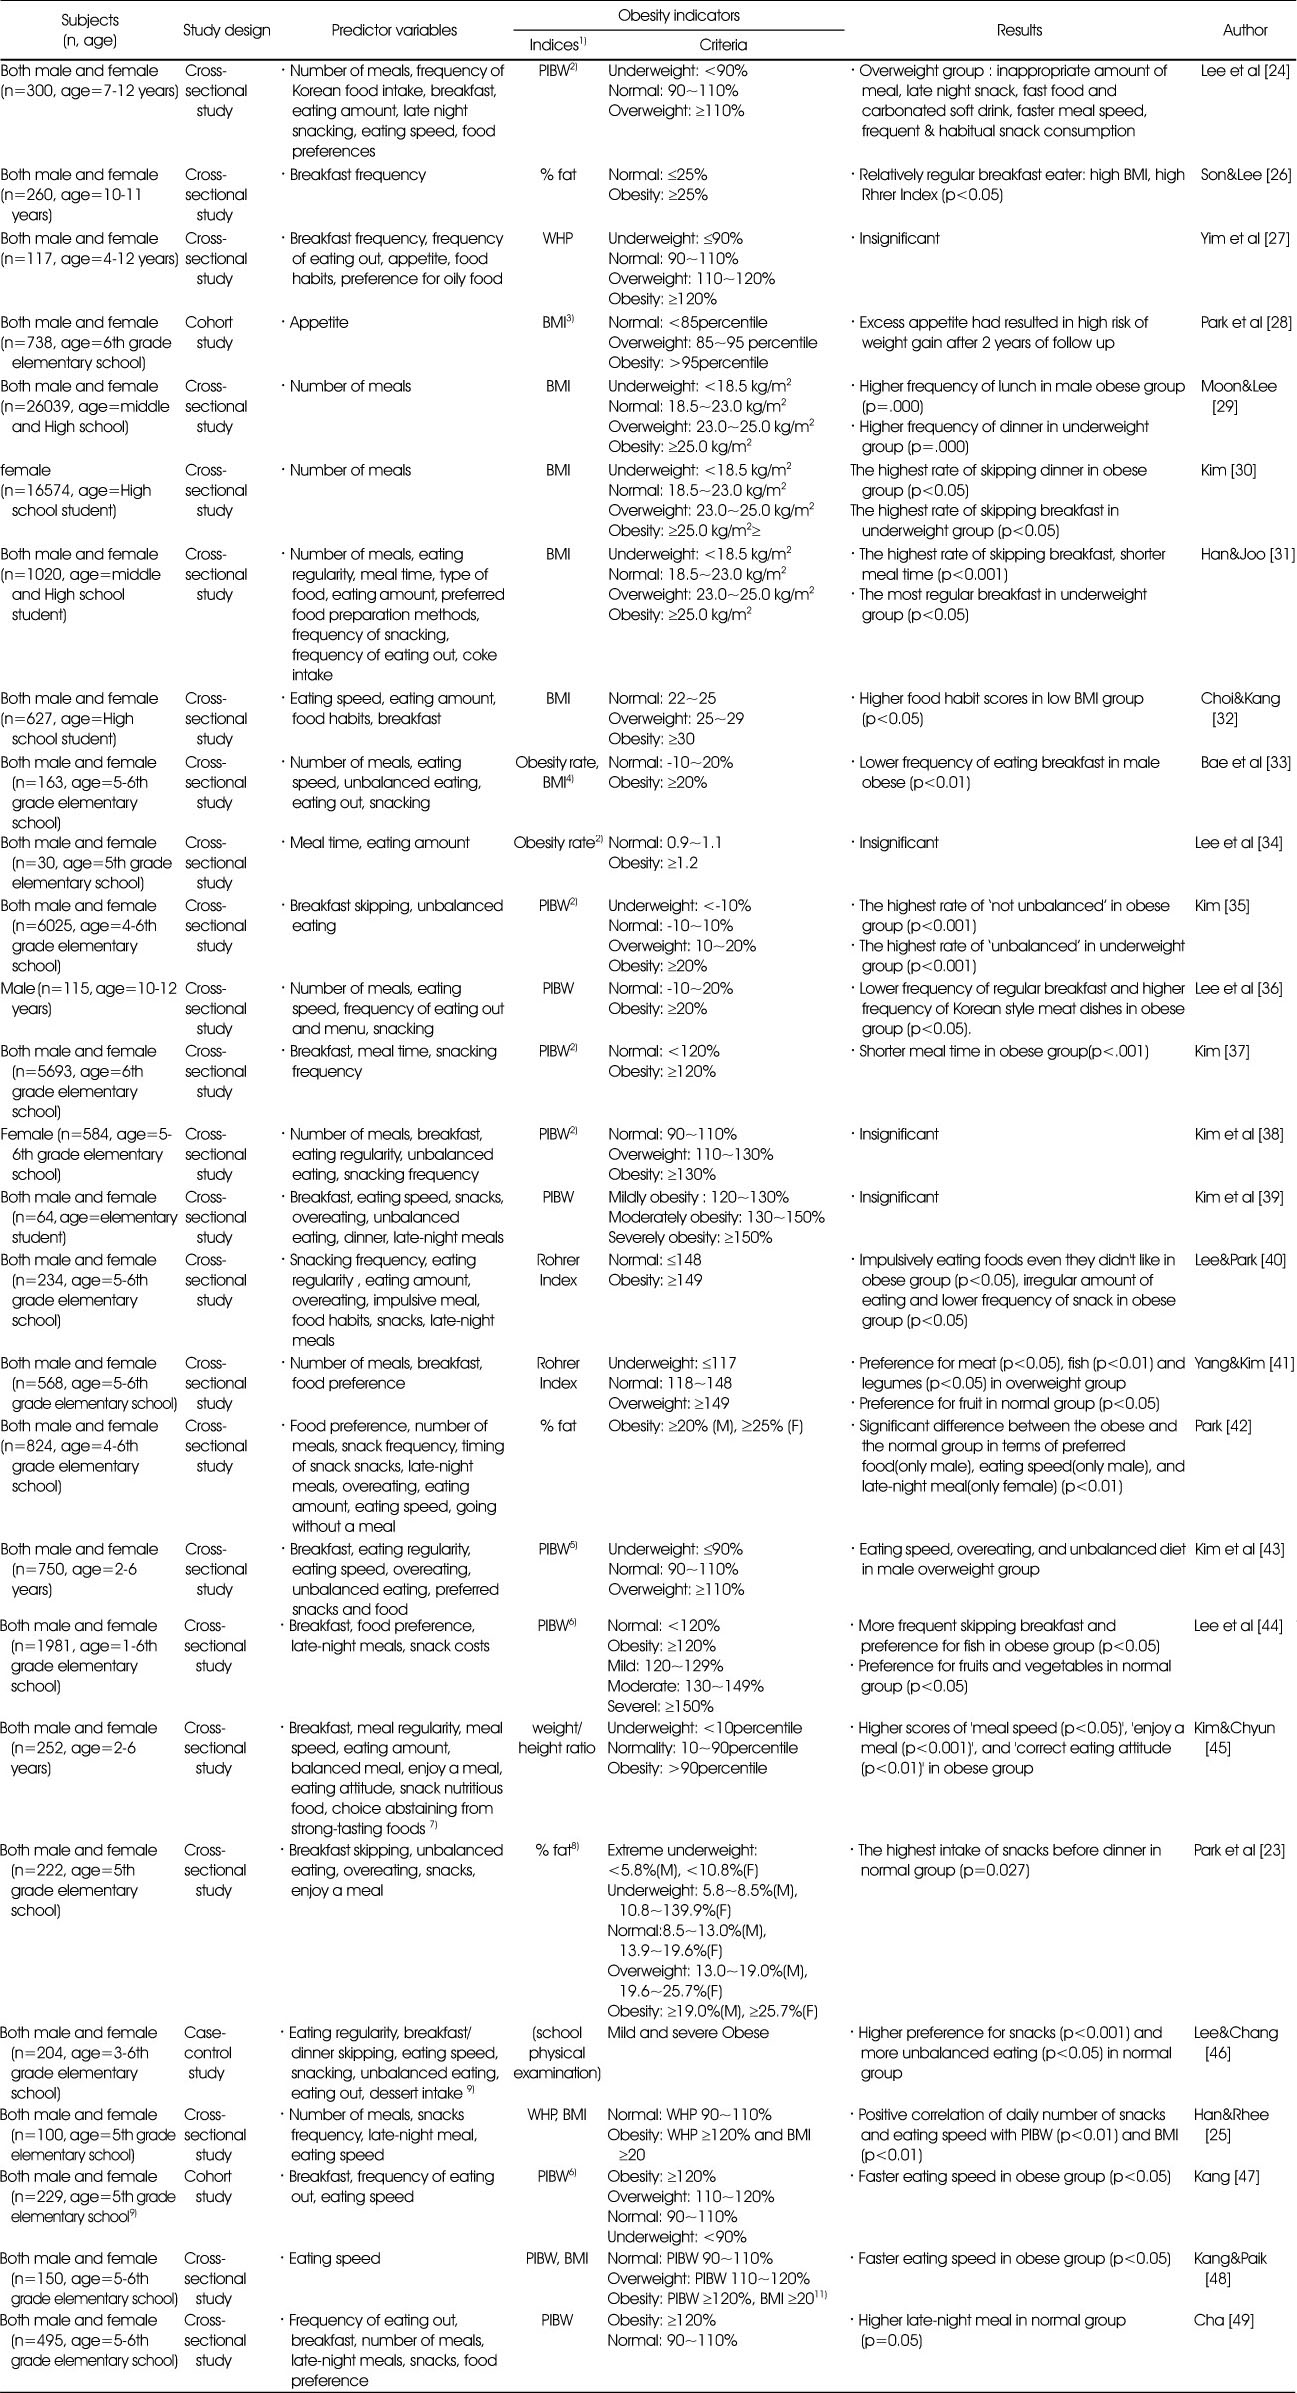
Characteristics of associational studies on eating habits as risk factors for obesity and the main results
1) PIBW, percent of ideal body weight; BMI, body mass index; WHP, weight/height index expressed as the percentage of the median of the growth chart, 2) Obesity rate: (actual weight-standard weight)*100/standard weight; standard weight: 50th percentiles of weight for age in 2007 children and adolescent standard growth chart, 3) BMI in 1998 growth chart, 4) 1999 growth chart, 5) 50th percentiles of weight for height in 1998 growth chart, 6) 50th percentiles of weight for height in 1985 growth chart, 7) The most proper responses were scored 2 and the least one 0, 8) 5-grade fat mass for age 1998 standard, 9) 5-point Likert scale (5 for ‘strongly agree’ to 1 for ‘strongly disagree), 10) 5-year follow up from 1st grade to 5th grade in elementary school, 11) Depending on the anthropometry assessment, overweight and obese children was classified to obese group
Table 5

Characteristics of associational studies on eating environments as risk factors for obesity and the main results
Table 6

Characteristics of associational studies on food and nutrient intakes as risk factors for obesity and the main results
1) PlBW, percent of ideal body weight; BMI, body mass index; NAR, nutrient adequacy ratio; WHP, weight/height index expressed as the percentage of the median of the growth chart; Obesity rate, actual weight/standard weight, 2) 50th percentiles of weight for age in 2007 children and adolescent standard growth chart, 3) Depending on the anthropometry assessment, overweight and obese children was classified to obese group, underweight and normal to normal group, 4) Standard weight: 50th percentiles of weight for height in 1985 growth chart, 5) 1999 growth chart, 6) 1998 growth chart, 7) 15-grade fat mass for age 1998 standard, 8) Depending on the anthropometry assessment, overweight and obese children was classified to obese group
Figure & Data
REFERENCES
Citations
Citations to this article as recorded by 
- Effects of night eating on oral health characteristics and symptoms of poor oral health in adolescents: a cross-sectional study using the 18th Korea Youth Risk Behavior Survey
Seung–Hee Hong
Korean Journal of Community Nutrition.2025; 30(2): 150. CrossRef - The relationship between smartphone usage and eating behavior for elementary school students in Gangneung, South Korea: cross-sectional study
Minji Kim, Meera Jang
Korean Journal of Community Nutrition.2024; 29(4): 278. CrossRef - A systematic review and keyword network analysis of Korea Citation Index Journals (2004–2023)
Yunkyoung Oh, Eunsil Her
Korean Journal of Community Nutrition.2024; 29(6): 445. CrossRef - Trends in growth and nutritional status of Korean toddlers and preschoolers: a cross-sectional study using 2010–2021 Korea National Health and Nutrition Examination Survey data
Annisa Turridha, Jae Eun Shim
Korean Journal of Community Nutrition.2024; 29(6): 480. CrossRef - Association of Infant Feeding Characteristics With Dietary Patterns and Obesity in Korean Childhood
Kyoung-Nam Kim, Moon-Kyung Shin
Journal of Preventive Medicine and Public Health.2023; 56(4): 338. CrossRef - Using methylome data to inform exposome-health association studies: An application to the identification of environmental drivers of child body mass index
Solène Cadiou, Mariona Bustamante, Lydiane Agier, Sandra Andrusaityte, Xavier Basagaña, Angel Carracedo, Leda Chatzi, Regina Grazuleviciene, Juan R. Gonzalez, Kristine B. Gutzkow, Léa Maitre, Dan Mason, Frédéric Millot, Mark Nieuwenhuijsen, Eleni Papadopo
Environment International.2020; 138: 105622. CrossRef - An Integrative Literature Review of Interventions for School-aged Overweight and Obese Children
Juhyun Jo, Sang-Youn Jang, Dajeong Kum, Jihee Lim, Jeongeun Kim
Perspectives in Nursing Science.2019; 16(2): 75. CrossRef - A Qualitative Study on the Potential Utilization of a Mobile Phone for Obesity Management in Elementary-School Children : Parents Perspective
Bo Young Lee, Mi-Young Park, Kirang Kim, Jea Eun Shim, Ji-Yun Hwang
Korean Journal of Community Nutrition.2019; 24(2): 117. CrossRef - Effects of Sodium Intake on the Association between the Salt-Sensitive Gene, Alpha-Adducin 1 (ADD1), and Inflammatory Cytokines in the Prevalence of Children Obesity
Mi-Young Park, Myoung-sook Lee
Journal of Lipid and Atherosclerosis.2018; 7(2): 98. CrossRef
 Cite
CiteSystematic Review on the Study of the Childhood and Adolescent Obesity in Korea: Dietary Risk Factors

Fig. 1
Flow chart of study selection
Fig. 1
Systematic Review on the Study of the Childhood and Adolescent Obesity in Korea: Dietary Risk Factors
Study variables and distribution of study design for the individual risk factors of obesity (n=138)
1) N (%)
Contents of intervention methods in obesity management studies (n=170)
1) N (%)
Study variables for the potential dietary risk factors
1) N (%)
Characteristics of associational studies on eating habits as risk factors for obesity and the main results
1) PIBW, percent of ideal body weight; BMI, body mass index; WHP, weight/height index expressed as the percentage of the median of the growth chart, 2) Obesity rate: (actual weight-standard weight)*100/standard weight; standard weight: 50th percentiles of weight for age in 2007 children and adolescent standard growth chart, 3) BMI in 1998 growth chart, 4) 1999 growth chart, 5) 50th percentiles of weight for height in 1998 growth chart, 6) 50th percentiles of weight for height in 1985 growth chart, 7) The most proper responses were scored 2 and the least one 0, 8) 5-grade fat mass for age 1998 standard, 9) 5-point Likert scale (5 for ‘strongly agree’ to 1 for ‘strongly disagree), 10) 5-year follow up from 1st grade to 5th grade in elementary school, 11) Depending on the anthropometry assessment, overweight and obese children was classified to obese group
Characteristics of associational studies on eating environments as risk factors for obesity and the main results
1) PIBW, percentage of ideal body weight
2) 5-point Likert scale (5 for ‘strongly agree’ to 1 for ‘strongly disagree’)
3) 50th percentiles of weight for height in 1985 growth chart
Characteristics of associational studies on food and nutrient intakes as risk factors for obesity and the main results
1) PlBW, percent of ideal body weight; BMI, body mass index; NAR, nutrient adequacy ratio; WHP, weight/height index expressed as the percentage of the median of the growth chart; Obesity rate, actual weight/standard weight, 2) 50th percentiles of weight for age in 2007 children and adolescent standard growth chart, 3) Depending on the anthropometry assessment, overweight and obese children was classified to obese group, underweight and normal to normal group, 4) Standard weight: 50th percentiles of weight for height in 1985 growth chart, 5) 1999 growth chart, 6) 1998 growth chart, 7) 15-grade fat mass for age 1998 standard, 8) Depending on the anthropometry assessment, overweight and obese children was classified to obese group
Table 1
Study variables and distribution of study design for the individual risk factors of obesity (n=138)
1) N (%)
Table 2
Contents of intervention methods in obesity management studies (n=170)
1) N (%)
Table 3
Study variables for the potential dietary risk factors
1) N (%)
Table 4
Characteristics of associational studies on eating habits as risk factors for obesity and the main results
1) PIBW, percent of ideal body weight; BMI, body mass index; WHP, weight/height index expressed as the percentage of the median of the growth chart, 2) Obesity rate: (actual weight-standard weight)*100/standard weight; standard weight: 50th percentiles of weight for age in 2007 children and adolescent standard growth chart, 3) BMI in 1998 growth chart, 4) 1999 growth chart, 5) 50th percentiles of weight for height in 1998 growth chart, 6) 50th percentiles of weight for height in 1985 growth chart, 7) The most proper responses were scored 2 and the least one 0, 8) 5-grade fat mass for age 1998 standard, 9) 5-point Likert scale (5 for ‘strongly agree’ to 1 for ‘strongly disagree), 10) 5-year follow up from 1st grade to 5th grade in elementary school, 11) Depending on the anthropometry assessment, overweight and obese children was classified to obese group
Table 5
Characteristics of associational studies on eating environments as risk factors for obesity and the main results
1) PIBW, percentage of ideal body weight 2) 5-point Likert scale (5 for ‘strongly agree’ to 1 for ‘strongly disagree’) 3) 50th percentiles of weight for height in 1985 growth chart
Table 6
Characteristics of associational studies on food and nutrient intakes as risk factors for obesity and the main results
1) PlBW, percent of ideal body weight; BMI, body mass index; NAR, nutrient adequacy ratio; WHP, weight/height index expressed as the percentage of the median of the growth chart; Obesity rate, actual weight/standard weight, 2) 50th percentiles of weight for age in 2007 children and adolescent standard growth chart, 3) Depending on the anthropometry assessment, overweight and obese children was classified to obese group, underweight and normal to normal group, 4) Standard weight: 50th percentiles of weight for height in 1985 growth chart, 5) 1999 growth chart, 6) 1998 growth chart, 7) 15-grade fat mass for age 1998 standard, 8) Depending on the anthropometry assessment, overweight and obese children was classified to obese group


