Articles
- Page Path
- HOME > Korean J Community Nutr > Volume 16(1); 2011 > Article
-
Original Article
- Association between Risk Factors for Health and Taste Perceptions of Middle-aged and Elderly People Living in Rural Areas
- Mee Sook Lee, Se In Oh, Chung Shil Kwak
-
Korean Journal of Community Nutrition 2011;16(1):145-154.
DOI: https://doi.org/10.5720/kjcn.2011.16.1.145
Published online: February 28, 2011
Department of Food and Nutrition, Hannam University, Daejeon, Korea.
1Department of Food and Nutrition, Seoil University, Seoul, Korea.
2Institute on Aging, Seoul National University, Seoul, Korea.
- Corresponding author: Mee Sook Lee, Department of Food and Nutrition, Hannam University, #461-6 Jeonmin-dong, Yuseong-gu, Daejeon 305-811, Korea. Tel: (042) 629-8794, Fax: (042) 629-8789, meesook@hnu.kr
Copyright © 2011 The Korean Society of Community Nutrition
- 1,020 Views
- 0 Download
- 2 Crossref
Abstract
- The purpose of this study was to evaluate the relationship between taste perceptions and risk factors for health of Korean elderly living in rural areas. Recognition thresholds for four basic tastes, drug consumption, BMI, fasting blood glucose, serum total cholesterol, serum triglyceride, systolic blood pressure, and diastolic blood pressure were assessed in 176 males and 312 females aged between 50 and 88 years. For the recognition threshold of the four basic tastes, alcohol drinking did not influence their sensitivities, but the alcohol drinking group preferred a higher pleasant concentration of NaCl than did the non-alcohol drinking group. However, smoking significantly decreased sensitivities of the four basic tastes. For the pleasant concentration of NaCl, the smoking group tended to prefer a higher concentration than the non-smoking group. Drug consumption, fasting blood glucose, serum total cholesterol, and serum triglycerides did not have a significant correlation to the sensitivity of the four basic tastes and preference of salty solution. Systolic blood pressure and diastolic blood pressure may have been positively correlated with the pleasant concentration of NaCl but did not correlate with the recognition thresholds of NaCl and sucrose. Further, systolic blood pressure was negatively correlated with the recognition thresholds of caffeine, whereas diastolic blood pressure was negatively correlated with the recognition thresholds of caffeine and citric acid. The finding that the risk factors for health correlated with taste perception has diagnostic and practical implications for health promotion for the elderly.
- 1. Barylko-Pikielna N, Zawadzka L, Niegowska J, Cybulska I, Sznajderman M. Taste perception of sodium chloride in suprathreshold concentration related to essential hypertension. J Hypertens Suppl. 1985; 3: 3. S449-S452.PubMed
- 2. Chang SK, Kim YS, Lee SD, Suh SK, Yu SW. A study on optimal gustation of salt in hypertensive patients in Korea. Korean J Nutr. 1983; 16(1): 21-26.
- 3. Choi-Kwon S, Kim JS. Lifestyle factors and risk of stroke in Seoul, South Korea. J Stroke Cerebrovasc Dis. 1998; 7(6): 414-420.ArticlePubMed
- 4. de Jong N, Mulder I, de Graaf C, van Staveren WA. Impaired sensory functioning in elders: the relation with its potential determinants and nutritional intake. J Gerontol A Biol Sci Med Sci. 1999; 54(8): B324-B331.ArticlePubMed
- 5. Fallis N, Lasangna L, Tetreault L. Gustatory thresholds in patients with hypertention. Nature. 1962; 196: 74-75.ArticlePDF
- 6. Grunberg NE, Morse DE. Cigarette smoking and food consumption in the United States. J Appl Soc Psychol. 1984; 14: 310-317.
- 7. Henkin RI. Salt taste in patients with essential hypertension due to hyperaldosteronism. J Chronic Dis. 1974; 27: 235-244.PubMed
- 8. Kampov-Polevoy AB, Garbutt JC, Janowsky DS. Association between preference for sweets and excessive alcohol intake: A review of animal and human studies. Alcohol Alcohol. 1999; 34(3): 386-395.ArticlePubMed
- 9. Kampov-Polevoy AB, Garbutt JC, Khalitov E. Family history of alcoholism and response to sweets. Alcohol Clin Exp Res. 2003; 27: 1743-1749.ArticlePubMed
- 10. Kim GH, Lee HM. Frequent consumption of certain fast foods may be associated with an enhanced preference for salt taste. J Hum Nutr Diet. 2009; 22: 475-480.ArticlePubMed
- 11. Kim JH, Choi MK. Salt intake behavior and blood pressure: the effect of taste sensitivity and preference. J Korean Living Sci Assoc. 2007; 16(4): 837-848.Article
- 12. Kim KS, Paik HY. A comparative study on optimum gustation of salt and sodium intake in young and middle-aged Korean women. Korean J Nutr. 1992; 25(1): 32-41.
- 13. Kranzler HR, Sandstrom KA, Van Kirk J. Sweet taste preference as a risk factor for alcohol dependence. Am J Psychiatry. 2001; 158(5): 813-815.ArticlePubMed
- 14. Krut LH, Perrin MJ, Bronte-Stewart B. Taste perception in smokers and non-smokers. Br Med J. 1961; 1(5223): 384-387.PubMedPMC
- 15. Lawson WB, Zeidler A, Rubenstein A. Taste detection and preferences in diabetics and their relatives. Psychosomatic Medicine. 1979; 41(3): 219-227.PubMed
- 16. Le AD, Li Z, Funk D, Shram M, Li TK, Shaham Y. Increased vulnerability to nicotine self-administration and relapse in alcohol-naive off spring of rats selectively bred for high alcohol intake. J Neurosci. 2006; 26: 1872-1879.PubMedPMC
- 17. Lee MS. Taste perception of middle-aged and elderly people living in rural areas: relationships among threshold, taste preference and physical activity. Korean J Community Nutr. 2010; 15(5): 670-678.
- 18. Leshem M. Biobehavior of the human love of salt. Neurosci Biobehav Rev. 2009; 33: 1-17.PubMed
- 19. Massler M. Geriatric nutrition : the role of taste and smell in appetite. J Prosthet Dent. 1980; 43(3): 247-250.PubMed
- 20. Mattes RD. The taste for salt in humans. Am J Clin Nutr. 1997; 65: 2 Suppl. 692S-697S.PubMed
- 21. Mattes RD, Kumanyika SK, Halpen BP. Salt taste responsiveness and preference among normotensive, prehypertensive and hypertensive adults. Chem Senses. 1983; 8: 27-40.
- 22. McLaughlin B, Kevany J. A pilot investigation into the effect of a short-term restriction in sodium intake on blood pressure, sodium chloride taste threshold and the problems associated with such a dietary restriction. IJMS. 1983; 152(11): 399-403.
- 23. Ng K, Woo J, Kwan M, Sea M, Wang A, Lo R, Chan A, Henry CJK. Effect of age and disease on taste perception. J Pain Symptom Manage. 2004; 28(1): 28-34.
- 24. Nordin S, Bramerson A, Bringlov E, Kobal G, Hummel T, Bende M. Substance and tongue-region specific loss in basic tastequality identification in elderly adults. Eur Arch Otorhinolaryngol. 2007; 264: 285-289.PubMed
- 25. Pepino MY, Mennella J. Effects of cigarette smoking and family history of alcoholism on sweet taste perception and food cravings in women. Alcohol Clin Exp Res. 2007; 31(11): 1891-1899.PubMedPMC
- 26. Pomerleau CS, Garcia AW, Drewnowski A, Pomerleau OF. Sweet taste preference in women smokers: comparison with nonsmokers and effects of menstrual phase and nicotine abstinence. Pharmacol Biochem Behav. 1991; 40: 995-999.PubMed
- 27. Pursell ED, Sanders RE, Haude RH. Sensitivity to sucrose in smokers and non-smokers: A comparison of TSD and percent correct measures. Percept Psychophys. 1973; 14: 34-36.
- 28. Sato K, Endo S, Tomita H. Sensitivity of three loci on the tongue and soft palate to four basic tastes in smokers and nonsmokers. Acta Otolaryngol Suppl. 2002; 546: 74-82.
- 29. Schechter PJ, Horwitz D, Henkin RI. Sodium chloride preference in essential hypertension. JAMA. 1973; 225: 1311-1315.PubMed
- 30. Schelling JH, Tetreault L, Lasangna L, Davis M. Abnormal taste threshold in diabetes. Lancet. 1965; 1: 508-512.PubMed
- 31. Schiffman SS. Taste and smell losses in normal aging and disease. JAMA. 1997; 278(16): 1357-1362.PubMed
- 32. Schiffman SS. Critical illness and changes in sensory perception. Proc Nutr Soc. 2007; 66: 331-345.PubMed
- 33. Schiffman SS. Effects of aging on the human taste system. Ann NY Acad Sci. 2009; 1170: 725-729.PubMed
- 34. Schiffman SS, Graham BG. Taste and smell perception affect appetite and immunity in the elderly. Eur J Clin Nutr. 2000; 54: Suppl 3. S54-S63.PubMed
- 35. Schumm LP, McClintock M, Williams S, Leitsch S, Lundstrom J, Hummel T, Lindau ST. Assessment of sensory function in the national social life, health, and aging project. J Gerontol B Psychol Sci Soc Sci. 2009; 64: Suppl 1. i76-i85.PubMed
- 36. van Wymelbeke V, Jiang T, Pfitzenmeyer P. Change in taste preference in undernourished elderly hospitalized subjects during periods of infection and convalescence. J Nutr Health Aging. 2009; 13(1): 40-45.PubMed
- 37. Vennemann MM, Hummel T, Berger K. The association between smoking and smell and taste impairment in the general population. J Neurol. 2008; 255: 1121-1126.PubMed
- 38. Viskoper RJ, Lugassy G. Elevated taste threshold for salt in hypertensive subjects. Kidney Int. 1979; 15: 582. (abstr).
- 39. Winkler S, Garg AK, Mekayarajjananonth T, Bakaeen LG, Khan E. Depressed taste and smell in geriatric patients. JADA. 1999; 130: 1759-1765.PubMed
- 40. Zumkley H, Vetter H, Mandelkow T, Spieker C. Taste sensitivity for sodium chloride in hypertensive, normotensive and hypertensive subjects. Nephron. 1987; 47(Suppl 1): 132-134.PubMed
REFERENCES


Figure & Data
REFERENCES
Citations

- A Study on Eating Out Behavior and Recognition of Salinity in Restaurant Food in Jecheon Area
Soojin Park, Sung Hee Min
Journal of The Korean Society of Food Culture.2015; 30(1): 20. CrossRef - Appetite and Related Factors among Community Elders in Korea
Soojin Park
Journal of the Korean Society of Food Science and Nutrition.2014; 43(9): 1431. CrossRef
General characteristics of the subjects
1) p-value of the t-test or the χ2-test: *, ***: Significantly different at p < 0.05, p < 0.001
2) Mean ± SD
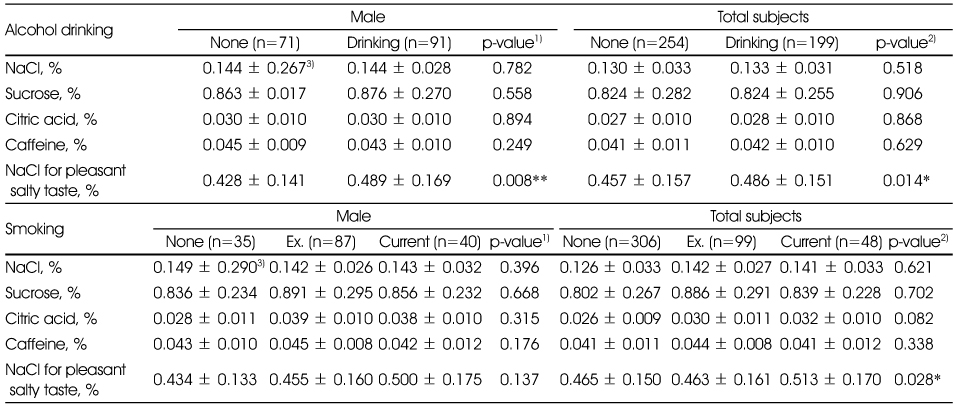
Recognition threshold of four basic taste qualities and pleasant salty taste by alcohol drinking and smoking
1) p-value of the MANOVA-test (adjusted by age): **: significantly different at p < 0.01
2) p-value of the MANOVA-test (adjusted by sex and age): *; significantly different at p < 0.05
3) Mean ± SD
Recognition threshold of four basic taste qualities and pleasant salty taste by medication and BMI
1) p-value of the MANOVA-test (adjusted by age): *: Significantly different at p < 0.05, 2) Mean ± SD
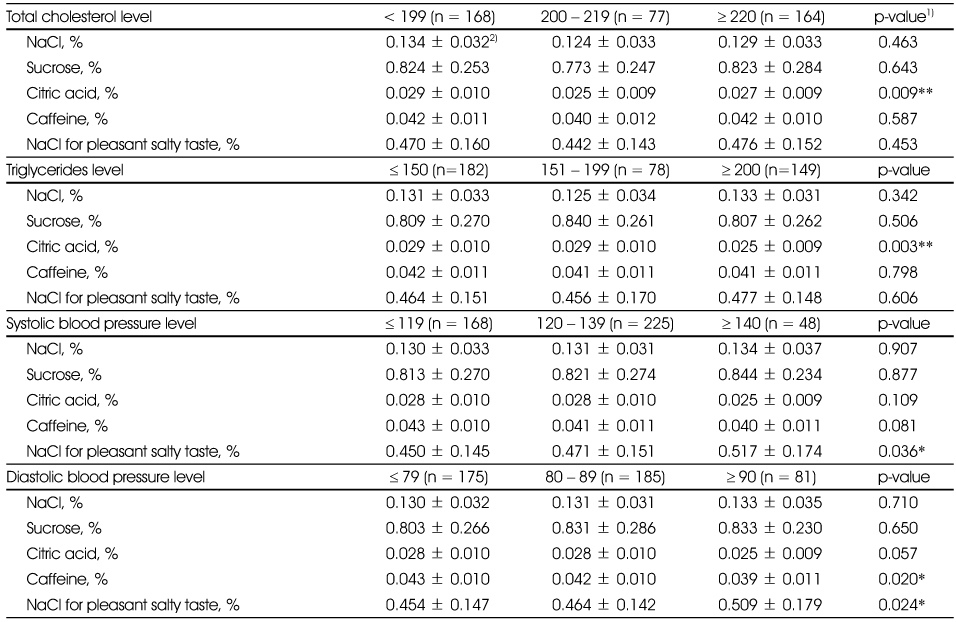
Recognition threshold of four basic taste qualities and pleasant salty taste by blood lipids levels and blood pressure levels
1) p-value of the MANOVA-test (adjusted by age): *, **: Significantly different at p < 0.05, p < 0.01, 2) Mean ± SD
Correlation between taste thresholds and risk factors for health
Pearson's correlation coefficient : *, **, ***; significantly different at p < 0.05, p < 0.01, p < 0.001
1) p-value of the t-test or the χ2-test: *, ***: Significantly different at p < 0.05, p < 0.001 2) Mean ± SD
1) p-value of the MANOVA-test (adjusted by age): **: significantly different at p < 0.01 2) p-value of the MANOVA-test (adjusted by sex and age): *; significantly different at p < 0.05 3) Mean ± SD
1) p-value of the MANOVA-test (adjusted by age): *: Significantly different at p < 0.05, 2) Mean ± SD
1) p-value of the MANOVA-test (adjusted by age): *, **: Significantly different at p < 0.05, p < 0.01, 2) Mean ± SD
Pearson's correlation coefficient : *, **, ***; significantly different at p < 0.05, p < 0.01, p < 0.001

 KSCN
KSCN


 Cite
Cite


