Articles
- Page Path
- HOME > Korean J Community Nutr > Volume 22(2); 2017 > Article
-
Research Article
- Shifts in Kimchi Consumption between 2005 and 2015 by Region and Income Level in the Korean Population: Korea National Health and Nutrition Examination Survey (2005, 2015)
-
Junghyun Park, Hae-Jeung Lee

-
Korean Journal of Community Nutrition 2017;22(2):145-158.
DOI: https://doi.org/10.5720/kjcn.2017.22.2.145
Published online: April 30, 2017
1Institute for Aging and Clinical Nutrition Research, Gachon University, Seongnam-si, Gyeonggi-do, Korea.
2Department of Food and Nutrition, Gachon University, Seongnam-si, Gyeonggi-do, Korea.
- Corresponding author: Hae-Jeung Lee. 1342 Seongnamdaero, Sujeonggu, Seongnam-si, Gyeonggi-do, 13120, Korea. Tel: (031) 750-4720, Fax: (031) 750-5974, skysea1010@gmail.com
Copyright © 2017 The Korean Society of Community Nutrition
This is an Open-Access article distributed under the terms of the Creative Commons Attribution Non-Commercial License (http://creativecommons.org/licenses/by-nc/3.0/) which permits unrestricted non-commercial use, distribution, and reproduction in any medium, provided the original work is properly cited.
- 658 Views
- 7 Download
- 7 Crossref
Abstract
-
Objectives
- The importance of kimchi as a traditional food in Korean cuisine has gradually decreased due to rapid industrialization, economic growth and changes in dietary patterns in Korea. This study aimed to examine the shifts in kimchi consumption by region and by income level between 2005 and 2015 in Korea.
-
Methods
- Data from the Korea National Health and Nutrition Examination Surveys III (2005) and VI (2015) were used in the study (n=15,558). Intake of kimchi was estimated using a single 24-hour dietary recall. The sample weights were applied in all analyses to reflect population estimates. All statistical analyses were carried out by using SPSS IBM Statistics 20.
-
Results
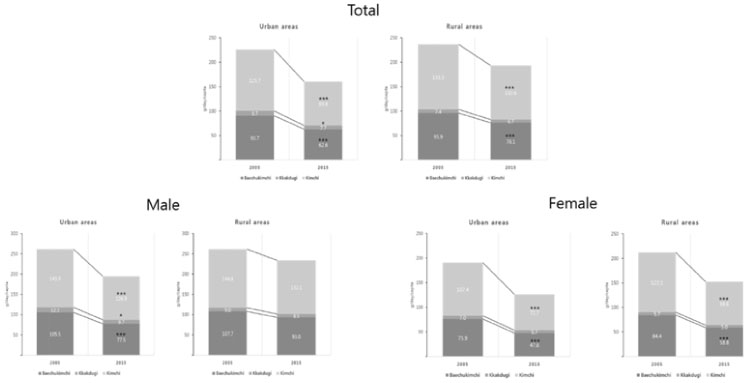
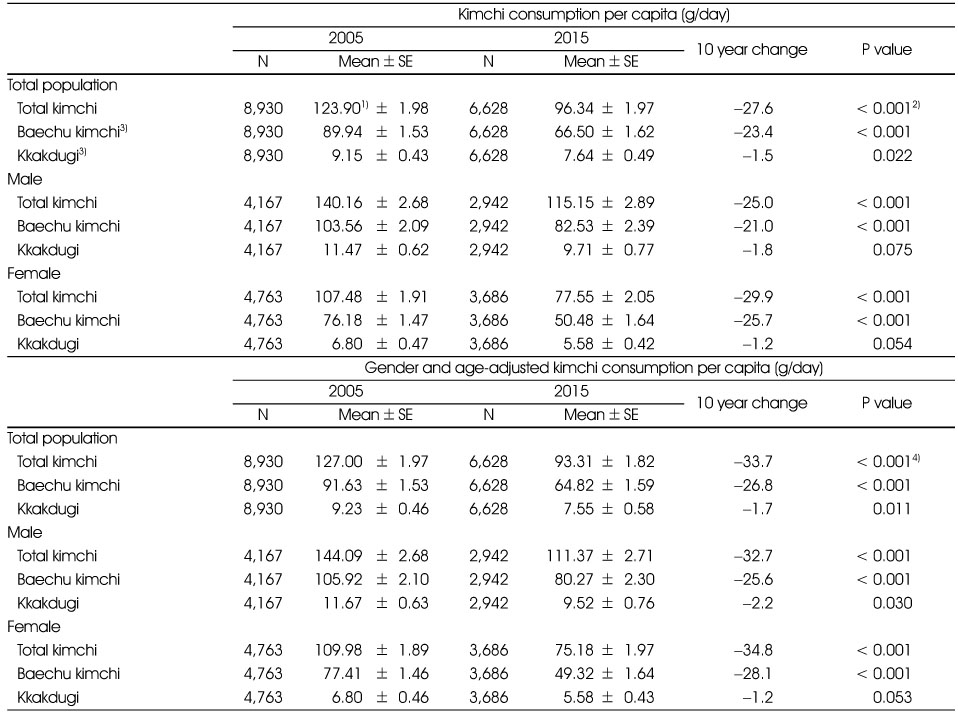
- Kimchi intake has significantly decreased by 27.6 g/day per capita during the last decade in Korea; 25.0 g for males and 29.9 g for females, respectively. Over the past decade, the decline of kimchi intake has been particularly significant in Seoul, Busan, Incheon, Gyeonggi, and Gwangju, while there has been no significant change in males living in rural areas. The consumption of kimchi across all income levels has decreased, however, the decrease was higher in ‘middle and low income level’. The amount of kimchi consumption in 2015 was the highest in ‘low income level’. The results were similar after adjusting for gender and age.
-
Conclusions
- For the past decade, the overall intake of kimchi in Korea has decreased, however, it has been found that the decrease of kimchi intake for males living in the rural areas was not significant. Therefore, in order to keep our traditional kimchi culture and promote a balanced diet including kimchi for Korean, it is necessary to develop more efficient policies and approaches. A variety of dishes using kimchi should be developed, besides merely serving kimchi with rice as a side dish, to increase the consumption of kimchi.
Acknowledgments
Acknowledgments
- 1. Jang DJ, Chung KR, Yang HJ, Kim KS, Kwon DY. Discussion on the origin of kimchi, representative of Korean unique fermented vegetables. J Ethn Food 2015; 2(3): 126-136.Article
- 2. Korea Health Industry Development Institute (KHIDI). National Food & Nutrition Statistics 2013: based on 2013 Korea National Health and Nutrition Examination Survey. Korea Health Industry Development Institute (KHIDI); 2015; cited 2017 Feb 16]. Available from: https://www.khidi.or.kr/.
- 3. Choi J, Moon HK. Comparison of dietary patterns by sex and urbanization in different economic status. Korean J Community Nutr 2008; 13(3): 346-358.
- 4. Song Y, Joung H. A traditional Korean dietary pattern and metabolic syndrome abnormalities. Nutr Metab Cardiovasc Dis 2012; 22(5): 456-462.ArticlePubMed
- 5. Kim EK, Park YK, Ju SY, Choi EO. A study on the kimchi consumption of Korean adults: Using Korea National Health and Nutrition Examination Survey (2010~2012). Korean J Food Cult 2015; 30(4): 406-412.Article
- 6. Kang M, Joung H, Lim JH, Lee YS, Song YJ. Secular trend in dietary patterns in a Korean adult population, using the 1998, 2001, and 2005 Korean National Health and Nutrition Examination Survey. Korean J Nutr 2011; 44(2): 152-161.Article
- 7. Park YH, Kang M, Baik HW, Oh SW, Park SJ, Paik HY. A study on the perception as HANSIK (Korean food) for the common dishes in Korean adults residing in Seoul and metropolitan area. Korean J Community Nutr 2012; 17(5): 555-578.Article
- 8. Kim JH, Yoon HR. A survey on the nationwide customers' usage of kimchi consumption. Korean J Food Nutr 2012; 25(2): 299-307.Article
- 9. Kim DY, Lee H, Choue R. Comparative study on awareness, preference and sensory evaluation of kimchi in Chinese and Korean students residing in Korea. Korean J Food Cult 2013; 28(2): 158-166.Article
- 10. Ryu JC, Park KY. Anticlastogenic effect of baechu (Chinese cabbage) kimchi and buchu (leek) kimchi in mitomycin C-induced micronucleus formations by supravital staining of mouse peripheral reticulocytes. Environ Mutagen Carcinog 2001; 21(1): 51-56.
- 11. Hur YM, Kim SH, Park KY. Inhibitory effects of kimchi extracts on the growth and DNA synthesis of human cancer cells. J Food Sci Nutr 1999; 4(2): 107-112.
- 12. Kim BK, Choi JM, Kang SA, Park KY, Cho EJ. Antioxidative effects of kimchi under different fermentation stage on radical-induced oxidative stress. Nutr Res Pract 2014; 8(6): 638-643.ArticlePubMedPMC
- 13. Kim JH, Ryu JD, Song YO. The effect of kimchi intake on free radical production and the inhibition of oxidation in young adults and the elderly people. Korean J Community Nutr 2002; 7(2): 257-265.
- 14. Sousa R, Halper J, Zhang J, Lewis SJ, Li WIO. Effect of lactobacillus acidophilus supernatants on body weight and leptin expression in rats. BMC Complement Altern Med 2008; 8(1): 5.ArticlePubMedPMCPDF
- 15. Kwon JY, Cheigh HS, Song YO. Weight reduction and lipid lowering effects of kimchi lactic acid powder in rats fed high fat diets. Korean J Food Sci Technol 2004; 36(6): 1014-1019.
- 16. Cheigh HS. Critical review on biochemical characteristics of kimchi (Korean fermented vegetable products). J East Asian Soc Diet Life 1995; 5(2): 89-101.
- 17. Kim HR, Kim MS, Kim MH, Son CW, Kwak ES, Heo OS. Analysis of sodium(Na) and potassium(K) content of side dishes purchased from traditional and super market in Daejeon area. J East Asian Soc Dietary Life 2009; 19(3): 350-355.
- 18. Song MR, Lee KJ. Salinity and consumption patterns of kimchi and soup stew in Jeonju area. Korean J Food Cookery Sci 2008; 24(1): 84-91.
- 19. Song DY, Park JE, Shim JE, Lee JE. Trends in the major dish groups and food groups contributing to sodium intake in the Korea National Health and Nutrition Examination Survey 1998-2010. Korean J Nutr 2013; 46(1): 72-85.Article
- 20. Karppanen H, Mervaala E. Sodium intake and hypertension. Prog Cardiovasc Dis 2006; 49(2): 59-75.ArticlePubMed
- 21. Jang YJ. Low sodium policy status and discussion in domestic and overseas. National Assembly Research Service; 2013; cited 2017 Feb 20]. Available from: https://www.nars.go.kr/brdView.do?brd_Seq=1589&cmsCd=CM0018.
- 22. Park H, Lee M, Yoon E, Chung H. Sodium reduction in traditional fermented foods. Food Sci Ind 2016; 49(2): 34-44.
- 23. Song HJ, Lee HJ. Consumption of kimchi, a salt fermented vegetable, is not associated with hypertension prevalence. J Ethn Food 2014; 1(1): 8-12.Article
- 24. Song HJ, Park SJ, Jang DJ, Kwon DY, Lee HJ. High consumption of salt-fermented vegetables and hypertension risk in adults: a 12-year follow-up study. Asia Pac J Clin Nutr 2016;
- 25. Zhao X, Yin X, Li X, Yan LL, Lam CT, Li S. Using a low-sodium, high-potassium salt substitute to reduce blood pressure among Tibetans with high blood pressure: A patient-blinded randomized controlled trial. PLoS One 2014; 9(10): e110131.ArticlePubMedPMC
- 26. Rodrigues SL, Baldo MP, Machado RC, Forechi L, Molina MDCB, Mill JG. High potassium intake blunts the effect of elevated sodium intake on blood pressure levels. J Am Soc Hypertens 2014; 8(4): 232-238.ArticlePubMed
- 27. Kim IW, Cho YB. A study on preference for purchase and ingestion of kimchi among Busan residents. Culi Sci Hos Res 2006; 12(4): 187-198.
- 28. Kim JH, Park WP, Kim JS, Park JH, Ryu JD, Lee HG. A survey on the actual state in kimchi in Kyung-nam(II): The study of the notion and preference of kimchi products for sale. Korean J Diet Cult 2000; 15(2): 147-153.
- 29. Lee GY, Park ES, Park KY. Survey on kimchi intake patterns and attitudes towards development of functional kimchi among middle and high school students in Busan area. J Korean Soc Food Sci Nutr 2015; 44(8): 1226-1233.Article
- 30. Korea Health Industry Development Institute (KHIDI). The Third National Health & Nutrition Examination Survey, 2005: Nutrition Survey. Korea Health Industry Development Institute (KHIDI); 2006; cited 2017 Feb 16]. Available from: https://www.khidi.or.kr/.
- 31. Kang JH, Lee KA. The perception, preferences, and intake of Korean traditional foods of elementary school students: Focusing on kimchi, tteok and eumcheong varieties. Korean J Food Cult 2008; 23(5): 543-555.
- 32. Ha AW, Ju SY. Nutrient intakes and frequently consumed foods among Korean adults according to the intake frequency of Baechu (Chinese cabbage) kimchi: Based on the 2012~2013 Korea National Health and Nutrition Examination Survey. J Nutr Health 2016; 49(2): 125-133.ArticlePDF
- 33. World Institute of Kimchi. Mission and Function [Internet]. World Institute of Kimchi; 2017; cited 2017 Feb 14]. Available from: https://www.wikim.re.kr/.
- 34. Korea Rural Economic Institute. A Study on the Status of the Elderly in Rural Area and Policy Improvement Plan. Ministry of Agriculture, Food and Rural Affairs; 2015; cited 2017 Mar 10]. Available from: http://www.krei.re.kr/web/www/23?p_p_id=EXT_BBS&p_p_lifecycle=0&p_p_state=normal&p_p_mode=view&_EXT_BBS_struts_action=%2Fext%2Fbbs%2Fview_message&_EXT_BBS_messageId=407784.
- 35. Kim HR, Kim MS, Kim MH, Son CW, Kwak ES, Heo OS. Analysis of sodium(Na) and potassium(K) content of side dishes purchased from traditional and super market in Daejeon area. J East Asian Soc Dietary Life 2009; 19(3): 350-355.
- 36. Song MR, Lee KJ. Salinity and consumption patterns of kimchi and soup stew in Jeonju area. Korean J Food Cookery Sci 2008; 24(1): 84-91.
- 37. Moon HK, Choi SO, Kim JE. Dishes contributing to sodium intake of elderly living in rural areas. Korean J Community Nutr 2009; 14(1): 123-136.
- 38. Song YJ, Paik HY, Joung H. A comparision of cluster and factor analysis to derive dietary patterns in Korean adults using data from the 2005 Korea National Health and Nutrition Examination Survey. Korean J Community Nutr 2009; 14(6): 722-733.
REFERENCES
Appendix
Changes in kimchi consumption in KNHANES 2005 and 2015 by age

Mean difference (g) in per capita kimchi consumption by region and between 2005 and 2015

Adjusted mean difference (g) in per capita kimchi consumption by region and by gender between 2005 and 2015

Changes of kimchi consumption in KNHANES 2005 and 2015 by income level

1) Mean daily per capita kimchi consumption
2) Student t-test was conducted to compare means per capita kimchi consumption between 2005 and 2015.
Means in a column without a common letter are significantly different at α=0.05 by GLM/PDIFF
3) Baechu kimchi: napa cabbage kimchi, Kkakdugi: Korean radish kimchi
4) ANCOVA was performed and gender and age were adjusted.
Figure & Data
REFERENCES
Citations

- Effects of kimchi consumption on body fat and intestinal microbiota in overweight participants: A randomized, double-blind, placebo-controlled, single-center clinical trial
Wooje Lee, Min-Sung Kwon, Ye-Rang Yun, Hasun Choi, Mi-Ja Jung, Hyelyeon Hwang, Myung-Jun Shin, Jong-Hwan Park, Du-Ri Kim, Ji Yoon Chang, So Young Moon, Ho Jae Lee, Tae-Woon Kim, Tae Woong Whon, Sung Wook Hong
Journal of Functional Foods.2024; 121: 106401. CrossRef - Kimchi throughout millennia: a narrative review on the early and modern history of kimchi
Reggie Surya, David Nugroho
Journal of Ethnic Foods.2023;[Epub] CrossRef - Analysis of intake trends of kimchi, fruits and vegetables (1998–2020) and factors associated with the intake (2016–2020): based on the Korea National Health and Nutrition Examination Survey
Jiwon Jeong, Jungmin Park, Yu Kyung Lee, Sung Wook Hong, Sangah Shin
Journal of Nutrition and Health.2023; 56(4): 404. CrossRef - Exploring the philosophical values of kimchi and kimjang culture
Reggie Surya, Anne Ga-Yeon Lee
Journal of Ethnic Foods.2022;[Epub] CrossRef - Association of Korean fermented cabbage kimchi consumption with an incidence of metabolic syndrome: 10-year follow-up results of the Korean Genome and Epidemiology Study
Suk Hyeon Seo, Jiyoun Hong, Im Huei Son, Young Hee Han, Taisun Hyun
Journal of Nutrition and Health.2019; 52(6): 569. CrossRef - Comparison of the periodontal condition in Korean and Japanese adults: a cross-sectional study
Michiko Furuta, Kenji Takeuchi, Yoshihiro Shimazaki, Toru Takeshita, Yukie Shibata, Jun Hata, Daigo Yoshida, Deok-Young Park, Toshiharu Ninomiya, Yoshihisa Yamashita
BMJ Open.2018; 8(11): bmjopen-2018-024332. CrossRef - Inhibitory effects on N-nitrosodimethylamine formation by decrease of salted-fermented fish products and increase of condiments in kimchi
Sung Hyun Kim, Jeong Gyun Kim, Sanghyun Lee, Kyung Hun Kang, Sang-Hyun Kim, Soo-Jung Lee, Nak-Ju Sung, Mi Ja Chung
Food Science and Biotechnology.2017; 26(5): 1447. CrossRef
- Figure
- We recommend
- Related articles
-
- Analysis of the relationship between sugar intake and cancer prevalence: a cross-sectional study using the 8th Korea National Health and Nutrition Examination Survey
- Trends in growth and nutritional status of Korean toddlers and preschoolers: a cross-sectional study using 2010–2021 Korea National Health and Nutrition Examination Survey data
- Total sugar intake and its contributed foods by age groups in Koreans using the 8th (2019–2021) Korea National Health and Nutrition Examination Survey: a cross-sectional study
- Estimating and evaluating usual total fat and fatty acid intake in the Korean population using data from the 2019–2021 Korea National Health and Nutrition Examination Surveys: a cross-sectional study


Fig. 1
Fig. 2A
Fig. 2B
Distribution of socio-demographic factors in KNHANES 2005 and 2015
1) Korea National Health and Nutrition Examination Survey (KNHANES)
2) Chi-squared test was applied to compare the percent between 2005 and 2015.
3) Original number (weighted percent, %)
Changes of kimchi consumption in KNHANES 2005 and 2015 by gender
1) Mean daily per capita kimchi consumption
2) Student t-test was conducted to compare means per capita kimchi consumption between 2005 and 2015.
3) Baechu kimchi: napa cabbage kimchi, Kkakdugi: Korean radish kimchi
4) ANCOVA was performed and gender and age were adjusted.
Changes of kimchi consumption in KNHANES 2005 and 2015 by 16 cities and provinces of Korea
1) Mean daily per capita kimchi consumption
2) Student t-test was conducted to compare means per capita kimchi consumption between 2005 and 2015.
3) Baechu kimchi: napa cabbage kimchi, Kkakdugi: Korean radish kimchi
4) ANCOVA was performed and gender and age were adjusted.
Changes of kimchi consumption in KNHANES 2005 and 2015 by income level
1) Mean daily per capita kimchi consumption
2) Student t-test was conducted to compare means per capita kimchi consumption between 2005 and 2015.
Means in a column without a common letter are significantly different at α=0.05 by GLM/PDIFF
3) Baechu kimchi: napa cabbage kimchi, Kkakdugi: Korean radish kimchi
4) ANCOVA was performed and gender and age were adjusted.
1) Korea National Health and Nutrition Examination Survey (KNHANES) 2) Chi-squared test was applied to compare the percent between 2005 and 2015. 3) Original number (weighted percent, %)
1) Mean daily per capita kimchi consumption 2) Student t-test was conducted to compare means per capita kimchi consumption between 2005 and 2015. 3) Baechu kimchi: napa cabbage kimchi, Kkakdugi: Korean radish kimchi 4) ANCOVA was performed and gender and age were adjusted.
1) Mean daily per capita kimchi consumption 2) Student t-test was conducted to compare means per capita kimchi consumption between 2005 and 2015. 3) Baechu kimchi: napa cabbage kimchi, Kkakdugi: Korean radish kimchi 4) ANCOVA was performed and gender and age were adjusted.
1) Mean daily per capita kimchi consumption 2) Student t-test was conducted to compare means per capita kimchi consumption between 2005 and 2015. Means in a column without a common letter are significantly different at α=0.05 by GLM/PDIFF 3) Baechu kimchi: napa cabbage kimchi, Kkakdugi: Korean radish kimchi 4) ANCOVA was performed and gender and age were adjusted.

 KSCN
KSCN


 PubReader
 Cite
Cite


