
Articles
- Page Path
- HOME > Korean J Community Nutr > Volume 18(4); 2013 > Article
-
Original Article
- Wanting Extremely Low BMI May be Associated with Higher Depression and Undesirable Dietary Habits in High School Girls Who were Not Overweight
- Hyeyoung Park, Hongmie Lee
-
Korean Journal of Community Nutrition 2013;18(4):344-353.
DOI: https://doi.org/10.5720/kjcn.2013.18.4.344
Published online: August 31, 2013
Graduate School of Nutrition Education, Daejin University, Pocheon, Korea.
1Department of Food Science & Nutrition, Daejin University, Pocheon, Korea.
- Corresponding author: Hongmie Lee, Department of Food Science & Nutrition, Daejin University, Pocheon 487-711, Korea. Tel: (031) 539-1862, Fax: (031) 539-1860, hmlee@daejin.ac.kr
• Received: May 20, 2013 • Revised: August 5, 2013 • Accepted: August 5, 2013
Copyright © 2013 The Korean Society of Community Nutrition
This is an Open-Access article distributed under the terms of the Creative Commons Attribution Non-Commercial License (http://creativecommons.org/licenses/by-nc/3.0/) which permits unrestricted non-commercial use, distribution, and reproduction in any medium, provided the original work is properly cited.
- 1,840 Views
- 1 Download
- 5 Crossref
Abstract
- The widespread pursuit for the thin physique may have detrimental impact on the wellbeing of the young generation, especially females. This study aimed to determine the effect of wanting very low body weight on dietary habits and psychological factors of female adolescents. Participants were 619 girls from 5 high schools in Kyeonggi, Korea. Information on dietary behaviors, psychological factors as well as current heights and weights and the desired weight for current height were obtained by questionnaire. Of total subjects, 38.1%, 35.5%, and 26.5% desired weights corresponding to normal (10~85 percentile), low (3~10 percentile) and very low BMI (< 3 percentile), respectively. The subjects who wanted to be very low weight had the average BMI of 18.57 kg/m2, which was significantly lower than 21.21 kg/m2 of those who wanted to be normal weight (p < 0.001). The subjects who desired very low weight had significantly higher scores for depression symptoms (p < 0.05), while there were no differences in obsession to lose weight and obesity stress. Moreover, more subjects in this group had undesirable dietary habits such as eating fast foods more than weekly (p < 0.05). These findings suggest that the desire for extreme thinness may lead female adolescents to have not only unreasonably similar obesity stress and obsession to lose weight but also higher depression symptoms, along with undesirable dietary habits. The findings suggest the potential harm from excessive weight concerns of female adolescents; thus efforts to teach this group about healthy weights are urgently needed.
- 1. Al Sabbah H, Vereecken C, Abdeen Z, Coats E, Maes L. Associations of overweight and of weight dissatisfaction among Palestinian adolescents: findings from the national study of Palestinian schoolchildren (HBSC-WBG2004). J Hum Nutr Diet 2008; 22: 40-49.ArticlePubMed
- 2. Ali MM, Fang H, Rizzo JA. Body weight, self-perception and mental health outcomes among adolescents. J Ment Health Policy Econ 2010; 13: 53-63.PubMed
- 3. American Academy of Pediatrics, Committee on Sports Medicine and Fitness. Promotion of healthy weight-control practices in young athletes. Pediatrics 2005; 116(6): 1557-1564.ArticlePubMedPDF
- 4. Anschutz DJ, Engels RCME, Becker ES, Strien TV. The bold and the beatiful. Influence of body size of televised media models on body dissatisfaction and actual food intake. Appetite 2008; 51: 530-537.ArticlePubMed
- 5. Beck AT. Depression: Clinical, experimental and theoretical aspects. New York: Harper & Row; 1967.
- 6. Ben-Tovim DI, Walker MK. The influence of age and weight on women's body attitudes as measured by Body Attitudes Questionnaire (BAQ). J Psychosom Res 1994; 38: 477-481.PubMed
- 7. Cho SJ, Jeon HJ, Kim JK, Suh TW, Kim SU, Hahm BJ, Suh DH, Chung SJ, Cho MJ. Prevalence factors of suicide attempts in junior and high school adolescents. J Korean Neuropsychiatr Assoc 2002; 41(6): 1142-1155.
- 8. Choi HM, Kim JH, Kim CI, Jang KJ, Min HS, Yim KS, Byun KW, Lee HM, Kim KW, Kim HS, Kim HA. Essentials of Nutrition. 3rd ed. Paju: Kyomunsa; 2011. p. 151-152.
- 9. Cuypers K, Kvaloy K, Bratberg G, Midthjell K, Holmen J, Holmen TL. Being normal weight but feeling overweight in adolescence may affect weight development into young adulthood-an 11-year followup: The HUNT study, Norway. J Obes 2012; 2012: 601872; doi: 10.1155/2012/601872.ArticlePubMedPMCPDF
- 10. Ehrenberg HM, Dierker KL, Milluzzi C, Mercer BM. Low maternal weight, failure to thrive in pregnancy, and adverse pregnancy outcomes. Am J Obstet Gynecol 2003; 189(6): 1726-1730.ArticlePubMed
- 11. French SA, Story M, Downes B, Resnick MD, Blum RW. Frequent dieting among adolescents: psychosocial and health behavior correlates. Am J Public Health 1995; 85(5): 695-701.ArticlePubMedPMC
- 12. Garner DM, Garfinkel PE. Eating attitude test: an index of the symptoms of anorexia nervosa. Psychol Med 1979; 9(2): 273-279.ArticlePubMed
- 13. Gualdi-Russo E, Albertini A, Argnani L, Celenza F, Nicholucci M, Toselli S. Weight status and body image perception in Italian children. J Hum Nutr Diet 2008; 21: 39-45.ArticlePubMed
- 14. Ha EH, Oh KJ, Song DH, Kang JH. The effects of cognitive-behavioral group therapy for depression and anxiety disorders in adolescents: A preliminary study. Korean J Clin Psychol 2004; 23(2): 263-279.
- 15. Jansen W, vande Looij-Jansen PM, de Wilde EJ, Brug J. Feeling fat rather than being fat may be associated with psychological well-being in young Dutch adolescents. J Adolesc Health 2008; 42: 128-136.ArticlePubMed
- 16. Kelly TM, Lynch KG, Donovan JE, Clark DB. Alcohol use disorder and risk factor interactions for adolescents suicidal ideation and attempts. Suicide Life Threat Behav 2001; 31(2): 181-193.PubMed
- 17. Kim MS, Lee HM. Overestimation of own body weights in female university students: associations with lifestyles, weight control behaviors and depression. Nutr Res Pract 2010; 4(6): 499-506.ArticlePubMedPMC
- 18. Kim JH, Jung IK. A study on body image perception and eating disorders by gender in junior high school students in Seoul. J Korean Home Econ Assoc 2006; 45: 101-109.
- 19. Kim O, Kim K. Body weight, self-esteem, and depression in Korean female. Adolescence 2001; 36(142): 315-322.PubMed
- 20. Kim YK, Shin WS. A comparison study on perception of body image and dietary habits of high school students between urban and rural areas. Korean J Community Nutr 2008; 13(2): 153-163.
- 21. Kim YS, Kong SS. A study on weight-control behaviors, eating disorder symptoms and depression among femaleadolescents. J Korean Acad Psychiatr Ment Health Nurs 2004; 13: 304-314.ArticlePDF
- 22. Korea Center for Disease Control and Prevention. 2007 Growth Chart. 2007; cited 2013 May 23]. Available from http://www.cdc.go.kr/CDC/notice/CdcKrTogether0302.jsp?menuIds=HOME001-MNU0004-MNU0085-MNU0088&cid=9838.
- 23. Lee HJ, Choi MR, Koo JO. A study of body image, weight control and dietary habits with different BMI in female high school students. Korean J Community Nutr 2005; 10(6): 805-813.
- 24. Lee S, Ahn HS. Relation of obesity-related attitudes, knowledge, and eating behaviors with body weight and body shape satisfaction in 5th-grade Korean children. Nutr Res Pract 2007; 1: 126-130.ArticlePubMedPMC
- 25. Lee YH, Song JY. A study of the reliability and the validity of BDI, SDS, and MMPI-D scales. Korean J Clin Psychol 1991; 10: 98-113.
- 26. Lee YJ, Lee SJ, Kim CG. Korean adolescents weight control behaviors by BMI (Body Mass Index) and body shape perception-Korea Youth Risk Behavior web-based Survey from 2010. J Digit Policy Manage 2012; 10(3): 227-232.
- 27. Ministry of Education, Science and Technology. Adolescent Health Behavior Online Survey 2013. 2013; cited 2013 May 23]. Available from http://yhs.cdc.go.kr/.
- 28. Ministry of Health and Welfare. Korea Health Statistics 2011. Korea National Health and Nutrition Examination Survey V-2.. 2012; cited 2013 May 23]. Available from http://knhanes.cdc.go.kr/knhanes/index.do.
- 29. Miyazaki M, Babazono A, Ishii T, Sugie T, Momose Y, Iwahashi M, Une H. Effects of low body mass index and smoking on all-cause mortality among middle-aged and elderly Japanese. J Epidemiol 2002; 12: 40-44.ArticlePubMedPMC
- 30. Nam HJ, Kim YS. Study on association between risk of eating disorder and self-esteem on body image. Korean J Food Nutr 2005; 18(2): 115-126.
- 31. Park E. Overestimation and underestimation: adolescents' weight perception in comparison to BMI-based weight status and how it varies across socio-demographic factors. J Sch Health 2011; 81: 57-64.ArticlePubMed
- 32. Park HS, Koo HY, Schepp KG. Predictors of suicidal ideation for adolescents by gender. J Korean Acad Nurs 2005; 35(8): 1433-1442.ArticleLink
- 33. Patton GC, Johnson-Sabine E, Wood K, Mann AH, Wakeling A. Abnormal eating attitudes in London schoolgirls-prospective epidemiological study: outcome at twelve month follow-up. Psychol Med 1990; 20: 383-394.ArticlePubMed
- 34. Pruzansky ME, Turano M, Luckey M, Senie R. Low body weight as a risk factor for hip fracture in both black and white women. J Orthop Res 1989; 7(2): 192-197.ArticlePubMed
- 35. Seo JS, Lee JH, Yoon JS, Cho SH, Choi YS. Nutritional assessment. Seoul: Powerbook; 2012. p. 56-57.
- 36. Suh YS, Kang HJ, Chung YJ. Difference in weight control status and eating behavior between dissatisfied and satisfied female high school students regarding their own body shape. Korean J Food Cult 2011; 26(4): 354-363.
- 37. Tang J, Yu Y, Du Y, Ma Y, Zhu H, Liu Z. Association between actual weight status, perceived weight and depressive, anxious symptoms in Chinese adolescents: a cross-sectional study. BMC Public Health 2010; 10: 594.ArticlePubMedPMCPDF
- 38. Wolf's models guide. 2013; cited 2013 May 27]. Available from http://www.wolfkettler.co.uk/models/pro-models/index.html.
- 39. Yim KS. Effects of obesity, body image dissatisfaction and dietary habits on the risk of disturbed eating attitudes among high school students in Gyunggi province, Korea. Korean J Community Nutr 2010; 15(5): 656-669.
- 40. Yu Z, Han S, Zhu J, Sun X, Ji C, Guo X. Pre-pregnancy body mass index in relation to infant birth weight and offspring overweight/obesity: a systematic review and meta-analysis. PLoS One 2013; 8(4): e61627.ArticlePubMedPMC
REFERENCES


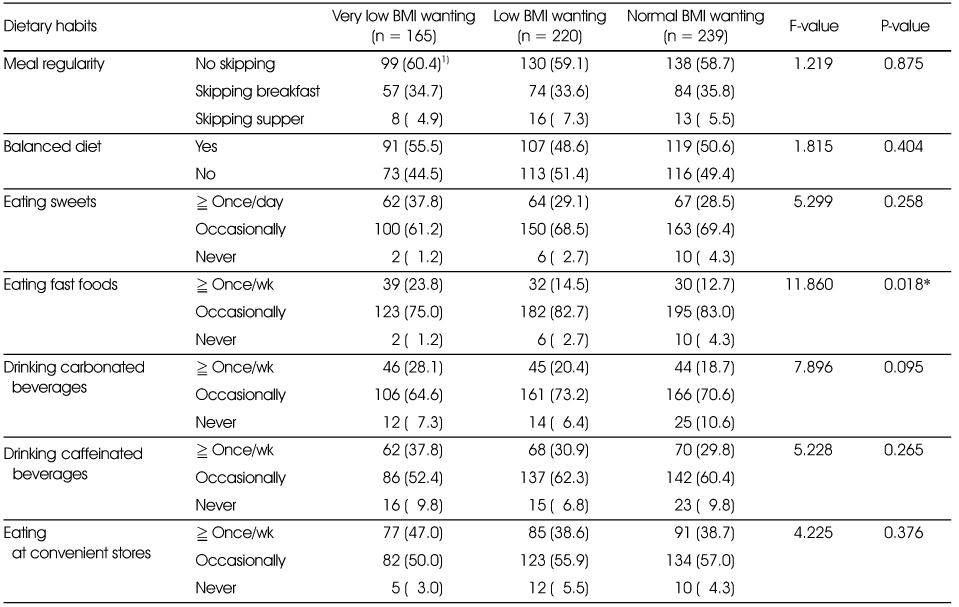

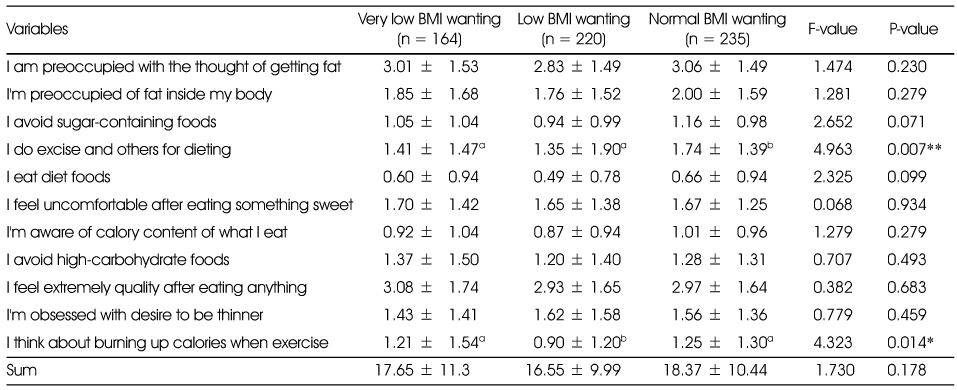


Figure & Data
REFERENCES
Citations
Citations to this article as recorded by 
- Facing Sexual Objectification: A Qualitative Study on South Korean Adolescent Girls’ Perspectives
In Chi Hwang, Keunyoung Baek
The Counseling Psychologist.2026; 54(3): 354. CrossRef - Body Image Perception and Eating Behaviors among Male Middle and High School Students according to Weight Status in Seoul
Bo-Mi Kim, Kyung-Hee Kim
Journal of the East Asian Society of Dietary Life.2018; 28(2): 123. CrossRef - Agreement Between Actual and Perceived Body Weight in Adolescents and Their Weight Control Behaviors
Sun Mi Shin
Journal of Obesity & Metabolic Syndrome.2017; 26(2): 138. CrossRef - Body Image Perception, Eating Disorder Risk, and Depression Level according to Dieting Experience of Female High School Students in Seoul
Jisun Min, Kyunghee Song, Hongmie Lee
Journal of the Korean Dietetic Association.2016; 22(4): 241. CrossRef - The Associations between Discordance of Body Image and Physical Activities among Adults Aged 19 to 64 Years: Based on the Data from 2010 Community Health Survey
In Ae Chun, So Yeon Ryu, Jong Park, Mi Ah Han, Seong Woo Choi, Dae Sik Ko
The Korean Journal of Obesity.2014; 23(4): 274. CrossRef
 Cite
CiteWanting Extremely Low BMI May be Associated with Higher Depression and Undesirable Dietary Habits in High School Girls Who were Not Overweight
Wanting Extremely Low BMI May be Associated with Higher Depression and Undesirable Dietary Habits in High School Girls Who were Not Overweight
Desired BMI of high school students according to gender
1) N (%)
Actual weight status of high school girls according to groups with BMI desired
1) N (%), 2) Mean ± SD
abc: Different superscripts in the same row mean significant difference among groups by Duncan's multiple range test.
***: p < 0.001
Health related lifestyle of high school girls according to BMI desired
1) N (%)
*: p < 0.05 by χ2 test.
Dietary habits of high school girls according to desired BMI
1) N (%)
*: p < 0.05 by χ2 test.
Weight control behaviors of high school girls according to desired BMI
1) N (%)
***: p < 0.001 by χ2 test.
Obsession to lose weights of high school girls according to desired BMI
1) Mean ± SD
ab: Different superscripts in the same row mean significant difference among groups by Duncan's multiple range test.
*: p < 0.05, **: p < 0.01 by one-way ANOVA.
Obesity stress of high school girls according to desired BMI
1) Mean ± SD
ab: Different superscripts in the same row mean significant difference among groups by Duncan's multiple range test.
*: p < 0.05, **: p < 0.01 by one-way ANOVA.
Depression symptoms of high school girls according to desired BMI
1) Mean ± SD
ab: Different superscripts in the same row mean significant difference among groups by Duncan's multiple range test.
*: p < 0.05, ***: p < 0.001 by one-way ANOVA.
Table 1
Desired BMI of high school students according to gender
1) N (%)
Table 2
Actual weight status of high school girls according to groups with BMI desired
1) N (%), 2) Mean ± SD abc: Different superscripts in the same row mean significant difference among groups by Duncan's multiple range test. ***: p < 0.001
Table 3
Health related lifestyle of high school girls according to BMI desired
1) N (%) *: p < 0.05 by χ2 test.
Table 4
Dietary habits of high school girls according to desired BMI
1) N (%) *: p < 0.05 by χ2 test.
Table 5
Weight control behaviors of high school girls according to desired BMI
1) N (%) ***: p < 0.001 by χ2 test.
Table 6
Obsession to lose weights of high school girls according to desired BMI
1) Mean ± SD ab: Different superscripts in the same row mean significant difference among groups by Duncan's multiple range test. *: p < 0.05, **: p < 0.01 by one-way ANOVA.
Table 7
Obesity stress of high school girls according to desired BMI
1) Mean ± SD ab: Different superscripts in the same row mean significant difference among groups by Duncan's multiple range test. *: p < 0.05, **: p < 0.01 by one-way ANOVA.
Table 8
Depression symptoms of high school girls according to desired BMI
1) Mean ± SD ab: Different superscripts in the same row mean significant difference among groups by Duncan's multiple range test. *: p < 0.05, ***: p < 0.001 by one-way ANOVA.


