Articles
- Page Path
- HOME > Korean J Community Nutr > Volume 19(2); 2014 > Article
-
Research Article
- Investigation on Influencing Environmental Factors on Health Status of Korean Septuagenarians Dwelling in Longevity Region in Jeonla Province
- Chung Shil Kwak, Miyong Yon, Mee Sook Lee, Se In Oh, Sang Chul Park
-
Korean Journal of Community Nutrition 2014;19(2):142-162.
DOI: https://doi.org/10.5720/kjcn.2014.19.2.142
Published online: April 30, 2014
1Institute on Aging, Seoul National University, Seoul, Korea.
2Nutrition Policy Team, Department of Health Industry & Policy, Korea Heallth Industry Development Institute, Chungwon, Korea.
3Department of Food and Nutrition, Hannam University, Daejeon, Korea.
4Department of Food and Nutrition, Seoil University, Seoul, Korea.
- Corresponding author: Chung Shil Kwak. Institute on Aging, Seoul National University, 199-1 Dongsoong-dong, Jongno-gu, Seoul 110-810, Korea. Tel: (02) 740-8506, Fax: (02) 742-0626, kwakcs@snu.ac.kr
Copyright © 2014 The Korean Society of Community Nutrition
This is an Open-Access article distributed under the terms of the Creative Commons Attribution Non-Commercial License (http://creativecommons.org/licenses/by-nc/3.0/) which permits unrestricted non-commercial use, distribution, and reproduction in any medium, provided the original work is properly cited.
- 1,181 Views
- 2 Download
- 6 Crossref
Abstract
-
Objectives
- To evaluate the critical environmental factors on healthy-aging of Korean people, we investigated the significant factors influencing health status of septuagenarians living in rural area of Jeonla province, known to be one of the representative longevity regions in Korea.
-
Methods
- We divided subjects into healthy group (36M/25F) or poor-health group (26M/73F) based on self-reported health status, body mass index, a number of prescription, and blood test data. General characteristics, physical measurements, lifestyle, dietary behavior and nutrient intake, physical health and mental health data were statistically compared between the two groups.
-
Results
- Average age was not different between healthy group and poor-health group in men and women, respectively. In men, significantly favorable factors to health were observed to be higher education, regular exercise, higher grip strength and walking function, body mass index (≥ 18.5 kg/m2), moderate frequency of drinking and eating-out, non-smoking, normal red blood cell (RBC) count, higher serum dehydroepiandrosterone-sulfate (DHEAS) level, good digestive function and appetite, normal hearing function, regular meals, adequate vegetable and fruit intake, diverse food intake, adequate energy and nutrients (protein, vitamin B1, B6, C and E, folate, niacin, P, Zn and K) intake, higher mini-nutrient status assessment (MNA) score and low level of depression. On the other hand, in women, those were literacy, living arrangement, moderate frequency of drinking, healthy teeth, higher grip strength and walking function, bone mineral density, normal RBC and white blood cell (WBC) count, higher DHEAS concentration, higher MNA score, normal cognition and memory function, having snack and adequate fruit intake.
-
Conclusions
- These results could be useful to plan effective strategies to increase health-life expectancy of Korean old people living in rural areas.
-
This work was supported by Ministry of Health and Welfare and Soonchang County in 2009 through Institute on Aging at Seoul National University
NOTES
- 1. Ahmadi SM, Mohammadi MR, Mostafavi SA, Keshavarzi S, Kooshesh SM, Joulaei H, Sarikhani Y, Peimani P, Heydari ST, Lankarani KB. Dependence of the geriatric depression on nutritional status and anthropometric indices in elderly population. Iran J Psychiatry 2013; 8(2): 92-96.PubMedPMC
- 2. American Diabetes Association. Diagnosis and classification of diabetes mellitus. Diabetes care 2010; 33: S62-S69.ArticlePubMedPMCPDF
- 3. Bang SM, Lee JO, Kim YJ, Lee KW, Lim S, Kim JH, Park YJ, Chin HJ, Kim KW, Jang HC, Lee JS. Anemia and activities of daily living in the Korean urban elderly population: Results from the Korean longitudinal study on health and aging (KLoSHA). Ann Hematol 2013; 92: 59-65.ArticlePubMedPDF
- 4. Berliner N. Anemia in the elderly. Trans Am Clin Climatol Assoc 2013; 124: 230-237.PubMedPMC
- 5. Bollwein J, Volkert D, Diekmann R, Kaiser MJ, Uter W, Vidal K, Sieber CC, Bauer JM. Nutritional status according to the mini nutritional assessment(MNA) and frailty in community dwelling older persons: a close relationship. J Nutr Health Aging 2013; 17(4): 351-356.ArticlePubMedPDF
- 6. Bourne PA. Self-rated health of the educated and uneducated classes in Jamaica. N Am J Med Sci 2010; 2(1): 27-35.PubMedPMC
- 7. Campion EW, deLabry LO, Glynn RJ. The effect of age on serum albumin in healthy males: report from the Normotive Aging Study. J Gerontol 1988; 43(1): M18-M20.PubMed
- 8. Choe JS, Kwon SO, Paik HY. Nutritional status and related factors of the elderly in longevity areas. III. Relation among self-rated health, health-related behaviors, and nutrient intake in rural elderly. Korean J Nutr 2006; 39(3): 286-298.
- 9. Chun H, Khang YH, Kim IH, Cho SI. Explaining gender differences in ill-health in South Korea: the roles of socio-structural, phycosocial, and behavioral factors. Soc Sci Med 2008; 67(6): 988-1001.PubMed
- 10. Cooper JK, Gardner C. Effect of aging on serum albumin. J Am Geriatr Soc 1989; 37(11): 1039-1042.ArticlePubMed
- 11. Dean M, Raats MM, Grunert KG, Lumbers M. Factors influencing eating a varied diet in old age. Public Health Nutr 2009; 12(12): 2421-2427.ArticlePubMed
- 12. Guthrie HA, Scheer JC. Validity of a dietary score for assessing nutrient adequacy. J Am Diet Assoc 1981; 78: 240-245.ArticlePubMed
- 13. Hamer M, Lavoie KL, Bacon SL. Taking up physical activity in later life and healthy ageing: the English longitudinal study of aging. Br J Sports Med 2013; 48(3): 239-243.ArticlePubMed
- 14. Hansen RG, Wyse BW. Expression of nutrient allowances per 1,000 kcal. J Am Diet Assoc 1980; 76(3): 223-227.PubMed
- 15. Hardy R, Cooper R, Aihie Sayer A, Ben-Shlomo Y, Cooper C, Deary IJ, Demakakos P, Gallacher J, Martin RM, McNeill G, Starr JM, Steptoe A, Syddall H, Kuh D. HALCyon study team. Body mass index, muscle strength and physical performance in older adults from eight cohort studies: The HALCyon programme. PLoS One 2013; 8(2): e56483.ArticlePubMedPMC
- 16. Haveman-Nies A, Groot LPGM, Cruz JAA, Osler M, van Staveren WA. Dietary quality and lifestyle factors in relation to 10-year mortality in older Europeans. The SENECA study. Am J Epidemiol 2002; 156: 962-968.ArticlePubMed
- 17. Herrmann M, Widmann T, Colaianni G, Colucci S, Zallone A, Herrmann W. Increased osteoclast activity in the presence of increased homocysteine concentration. Clin Chem 2005; 51(12): 2348-2353.PubMed
- 18. Hooshmand B, Solomon A, Kreholt I, Rusanen M, Hnninen T, Leivisk J, Winblad B, Laatikainen T, Soininen H, Kivipelto M. Associations between serum homocysteine, holotranscobalamin, folate and cognition in the elderly: a longitudinal study. J Intern Med 2012; 271: 204-212.ArticlePubMed
- 19. Houston DK, Johnson MA, Nozza RJ, Gunter EW, Shea KJ, Cutler GM. Age-related hearing loss, vitamin B12 and folate in elderly women. Am J Clin Nutr 1999; 69: 564-571.ArticlePubMed
- 20. Idler EL, Kasl SV. Self-rating of health: do they also predict change in functional ability? J Gerontol B Psychol Sci Soc Sci 1995; 50(6): s344-s353.PubMed
- 21. Iizaka S, Tadaka E, Sanada H. Comprehensive assessment of nutritional status and associated factors in the healthy, community-dwelling elderly. Geriatr Gerontol Int 2008; 8: 24-31.ArticlePubMed
- 22. Kang Y, Kim MY, Eliza L. The relationship of perceived health status, activities of daily living and nutrition status in the community-dwelling Korean elderly. J Korean Acad Nurs 2008; 38(1): 122-130.Article
- 23. Kasayama S, Morita S, Otsuki M, Asanuma N, Saito H, Mukai M, Koga M. Independent association between insulin-like growth factor-1 and dehydroepiandrosterone sulphate in women in middle adulthood. Clin Endocrinol (Oxf) 2007; 66: 797-802.PubMed
- 24. Kato K, Zweig R, Schchter C, Verghese J, Barzilai N, Atzmon G. Personality, self-rated health and cognition in centenarians : Do personality and self-rated health relate to cognitive function in advanced age? Aging (Albany NY) 2013; 5(3): 183-191.ArticlePubMedPMC
- 25. Kilpatrick ES, Bloomgarden Z, Zimmet P. Is hemoglobin A1c a step forward for diagnosis diabetes? BMJ 2009; 339: b4432.ArticlePubMed
- 26. Kitamura K, Nakamura K, Kobayashi R, Oshiki R, Saito T, Oyama M, Takahashi S, Nishiwaki T, Iwasaki M, Yoshihara A. Physical activity and 5-year changes in physical performance tests and bone mineral density in postmenopausal women: The Yokogoshi study. Maturitas 2011; 70: 80-84.ArticlePubMed
- 27. Korea National Statistics Office. 2013 Statistics on aged population. 2013; cited December 10, 2013]. Available from http://kostat.go.kr.
- 28. Korean Geriatric Society. Tools for the assessment of cognitive function for elderly. Korean-MMSE. 2009; cited January 4, 2009]. Available from http://www.geriatrics.or.kr.
- 29. Korean Nutrition Society. Dietary reference intakes for Koreans. Seoul: Kookjin publishing; 2010.
- 30. Korean Society for the Study of Obesity. Diagnosis and therapy of obesity: Asia-Pacific area guideline. Seoul: 2000.
- 31. Krebs-Smith SM, Wright HS, Guthrie HA, Krebs-Smith J. The effects of variety in food choices on dietary quality. J Am Diet Assoc 1987; 87(7): 897-903.ArticlePubMed
- 32. Kuo HK, Sorond FA, Chen JH, Hashmi A, Milberg WP, Lipsitz LA. The role of homocysteine in multisystem age-related problems: a systematic review. J Gerontol A Biol Sci Med Sci 2005; 60: 1190-1201.ArticlePubMed
- 33. Kwon J, Suzuki T, Kumagai S, Shinkai S, Yukawa H. Risk factors for dietary variety decline among Japanese elderly in a rural community: a 8-year follow-up study from TMIG-LISA. Eur J Clin Nutr 2006; 60(3): 305-311.ArticlePubMedPDF
- 34. Kwon J, Suzuki T, Yoshida H, Kim H, Yoshida Y, Iwasa M, Furuna T. Association between change in bone mineral density and decline in usual walking speed in elderly community-dwelling Japanese women during 2 years of follow-up. J Am Geriatr Soc 2007; 55(2): 240-244.ArticlePubMed
- 35. Lee IM, Shiroma EJ, Lobelo F, Puska P, Blair SN, Katzmarzyk PT. Lancet Physical Activity Series Working Group. Effect of physical inactivity on major non-communicable diseases worldwide: an analysis of burden of disease and life expectancy. Lancet 2012; 380: 219-229.ArticlePubMedPMC
- 36. Lee KS, Cheong HW, Kim EA, Kim KR, Oh BH, Hong CH. Nutritional risk and cognitive impairment in the elderly. Arch Gerontol Geriatr 2009; 48: 95-99.ArticlePubMed
- 37. Lee YH, Choi KS, Kang IO. Determinants of self-rated health among the Korean elderly living in the community. J Korea Gerontol Soc 1998; 18(2): 110-124.
- 38. Lengyel CO, Tate PB, Obirek BLatz AK. The relationships between food group consumption, self-rated health, and life satisfaction of community-dwelling canadian older men: the manitoba follow-up study. J Nutr Elder 2009; 28(2): 158-173.ArticlePubMed
- 39. Meng S, Ciment S, Jan M, Tran T, Pham H, Cueto R, Yang XF, Wang H. Homocysteine induces inflammatory transcriptional signaling in monocytes. Front Biosci (Landmark Ed) 2013; 18: 685-695.ArticlePubMedPMC
- 40. Meng X, D'Arcy C. Successful aging in Canada:Prevalence and predictors from a population-based sample of older adults. Gerontology 2014; 60: 65-72.ArticlePubMedLink
- 41. Montlahuc C, Soumare A, Dufouil C, Berr C, Dartigues JF, Poncet M, Tzourio C, Alperovotch A. A self-rated health and risk of incident dementia: A community-based elderly cohort, the 3C study. Neurology 2011; 77: 1457-1464.ArticlePubMed
- 42. Park SC. Korean centenarians. Seoul: Seoul National University Publishing; 2002.
- 43. Ravaglia G, Forti P, Maioli F, Martelli M, Servadei L, Brunetti N, Porcellini E, Licastro F. Homocysteine and folate as risk factors for dementia and Alzheimer disease. Am J Clin Nutr 2005; 82: 636-643.ArticlePubMed
- 44. Rowe JW, Kahn RL. Successful aging. Gerontologist 1997; 37: 433-440.PubMed
- 45. Sakamoto W, Isomura H, Fujie K, Deyama Y, Kato A, Nishihira J, Izumi H. Homocysteine attenuates the expression of osteocalcin but enhances osteopontin in MC3T3-E1 preosteoblastic cells. Biochim Biophys Acta 2005; 1740: 12-16.ArticlePubMed
- 46. Sieber CC. Nutritional screening tools - How dose the MNA compare? Proceeding of the session held in Chicago May 2-3, 2006 (15 Years of Mini Nutritional Assessment). J Nutr Health Aging 2006; 10(6): 488-492.PubMed
- 47. Sheikh JI, Yesavage JA. Geriatric depression scale(GDS), recent evidence and development of a shorter version. Clin Gerontology 1986; 5: 165-172.
- 48. Sorenson AW, Wyse BW, Wittwer AJ, Hansen RG. An index of nutritional quality for a balanced diet. New help for an old problem. J Am Diet Assoc 1976; 68(3): 236-242.PubMed
- 49. Stevens PJ, Syddall HE, Patal HP, Martin HJ, Cooper C, Aihie Sayer A. Is grip strength a good marker of physical performance among community-dwelling older people? J Nutr Health Aging 2012; 16(9): 769-774.ArticlePubMedPDF
- 50. Tsai AC, Kai MY. Mini nutritional assessment and short-form mini nutritional assessment can predict the future risk of falling in older adults-Results of a national cohort study. Clin Nutr 2013; doi: 10.1016/j.clnu.2013.10.010. [Epub ahead of print].Article
- 51. Vuorisalmi M, Lintonen T, Jylha M. Comparative vs global self-rated health: associations with age and functional ability. Aging Clin Exp Res 2006; 18(3): 211-217.ArticlePubMedPDF
- 52. Weisen SF, Frishman WH, Aronson MK, Wassertheil-Smoller S. Self-rated health assessment and development of both cardiovascular and dementing illness in an ambulatory elderly population: A report from the Bronx Longitudinal aging study. Heart Dis 1999; 1(4): 201-205.PubMed
- 53. Yatabe MS, Taguchi F, Ishida I, Sato A, Kameda T, Ueno S, Takano K, Watanabe T, Sanada H, Yatabe J. Mini nutritional assessment as a useful method of predicting the development of pressure ulcers in elderly patients. J Am Geriatr Soc 2013; 61(10): 1698-1704.PubMed
REFERENCES
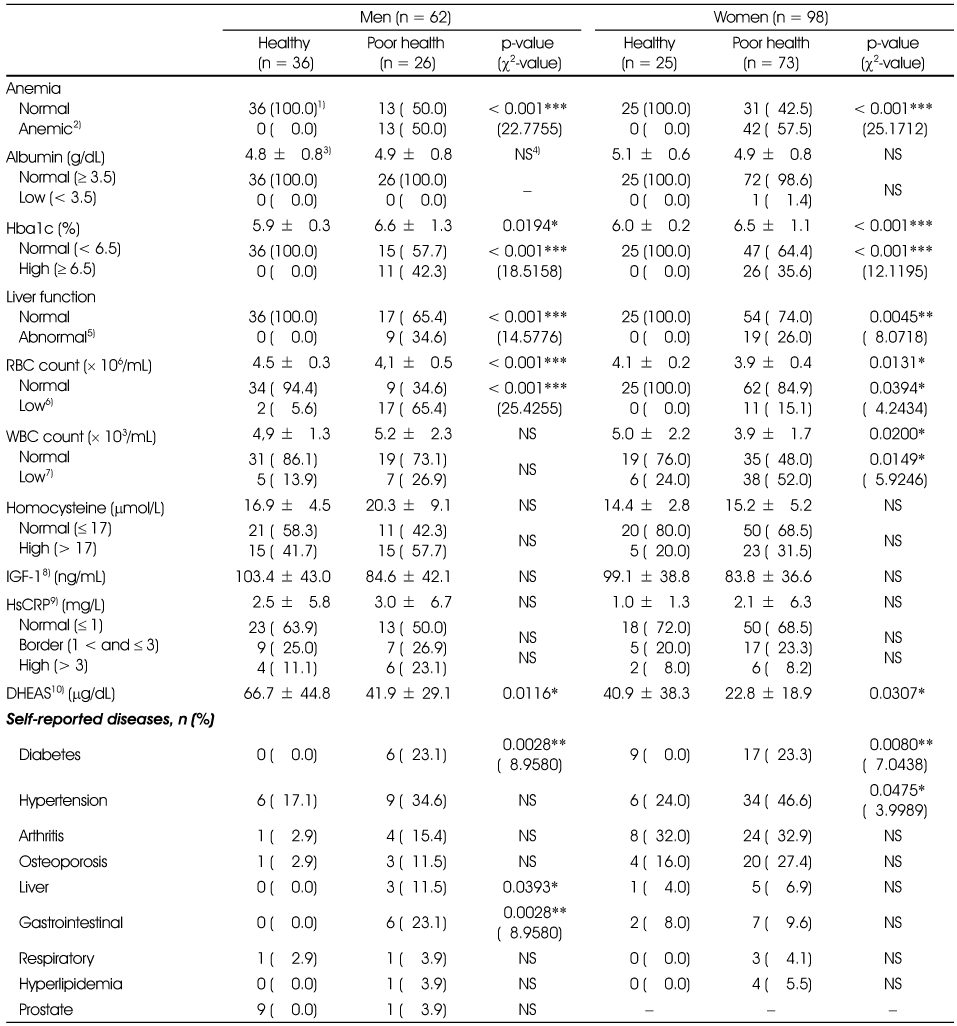
1) n (%), 2) Low hemoglobin (< 13 g/dL for men, < 12 g/dL for women) or low hematocrit (< 38% for men, < 36% for women), 3) Mean ± SD, 4) Not significant, 5) GOT > 40 IU/L or GPT > 40 IU/L, 6) Red blood cell < 4.2 × 10⁶/mL for men, < 3.6 × 10⁶/mL for women, 7) White blood cell < 3.8 × 10³/mL for men, < 3.15 × 10³/mL for women, 8) Insulin-like growth factor, 9) High sensitive C-reactive protein, 10) Dehydroepiandrosterone sulphate
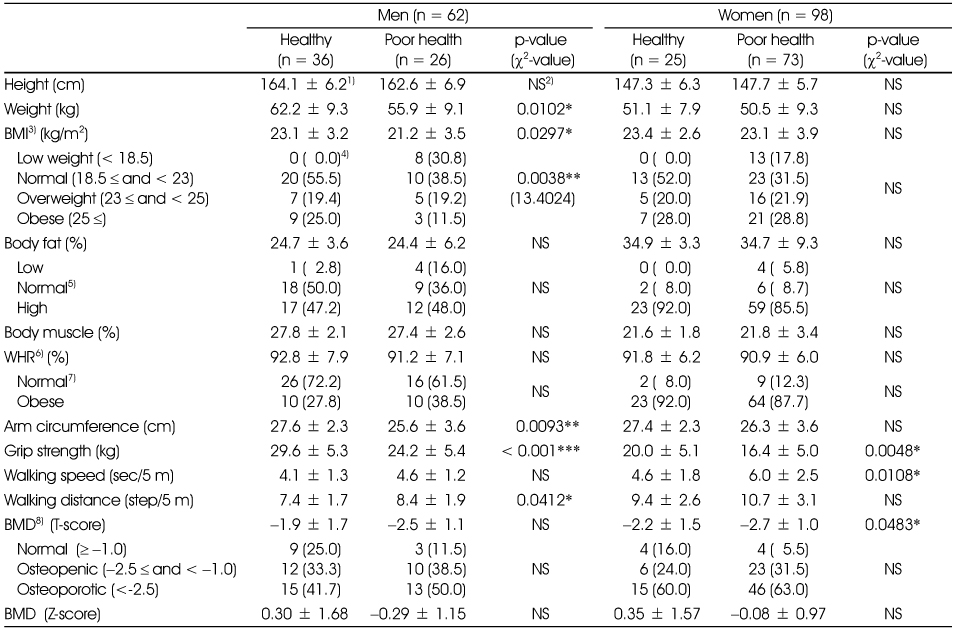
1) Mean ± SD, 2) Not significant, 3) Body mass index, 4) n (%), 5) Normal range of body fat (%): 19 ≤ and < 25 for men, 26 ≤ and < 30 for women, 6) Waist-hip circumstance ratio, 7) Normal range of WHR (%): < 95 for men, < 85 for women, 8) Bone mineral density
*: p < 0.05, **: p < 0.01, ***: p < 0.001
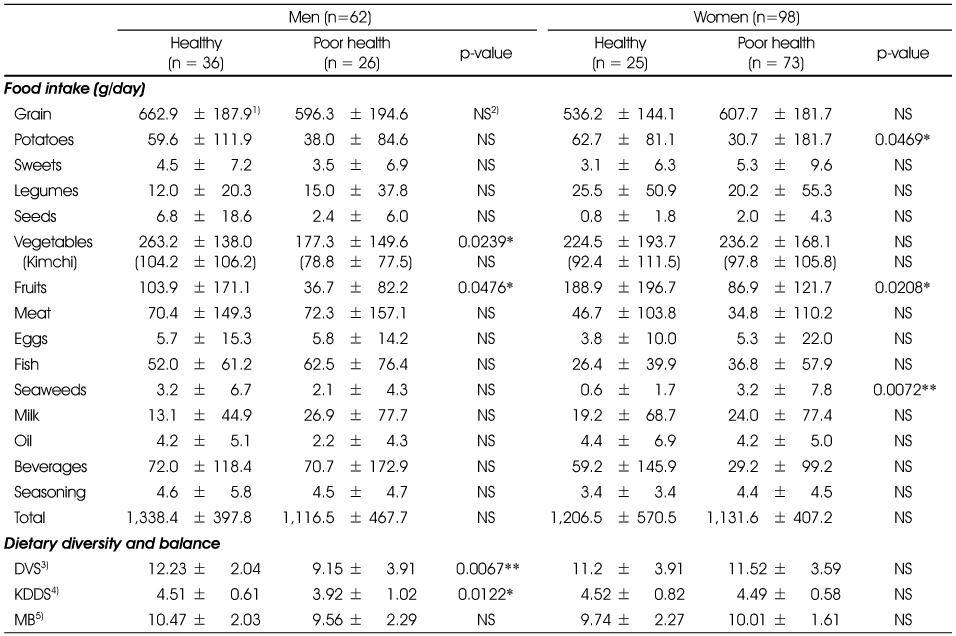
1) Mean ± SD, 2) Not significant, 3) Dietary variety score, 4) Korean dietary diversity score: number of taken food group in a day from 6 food groups such as grain & potatoes, meat, eggs & fish, legumes, milk & its product, vegetables and fruits, 5) Meal balance
*: p < 0.05, **: p < 0.01, ***: p < 0.001
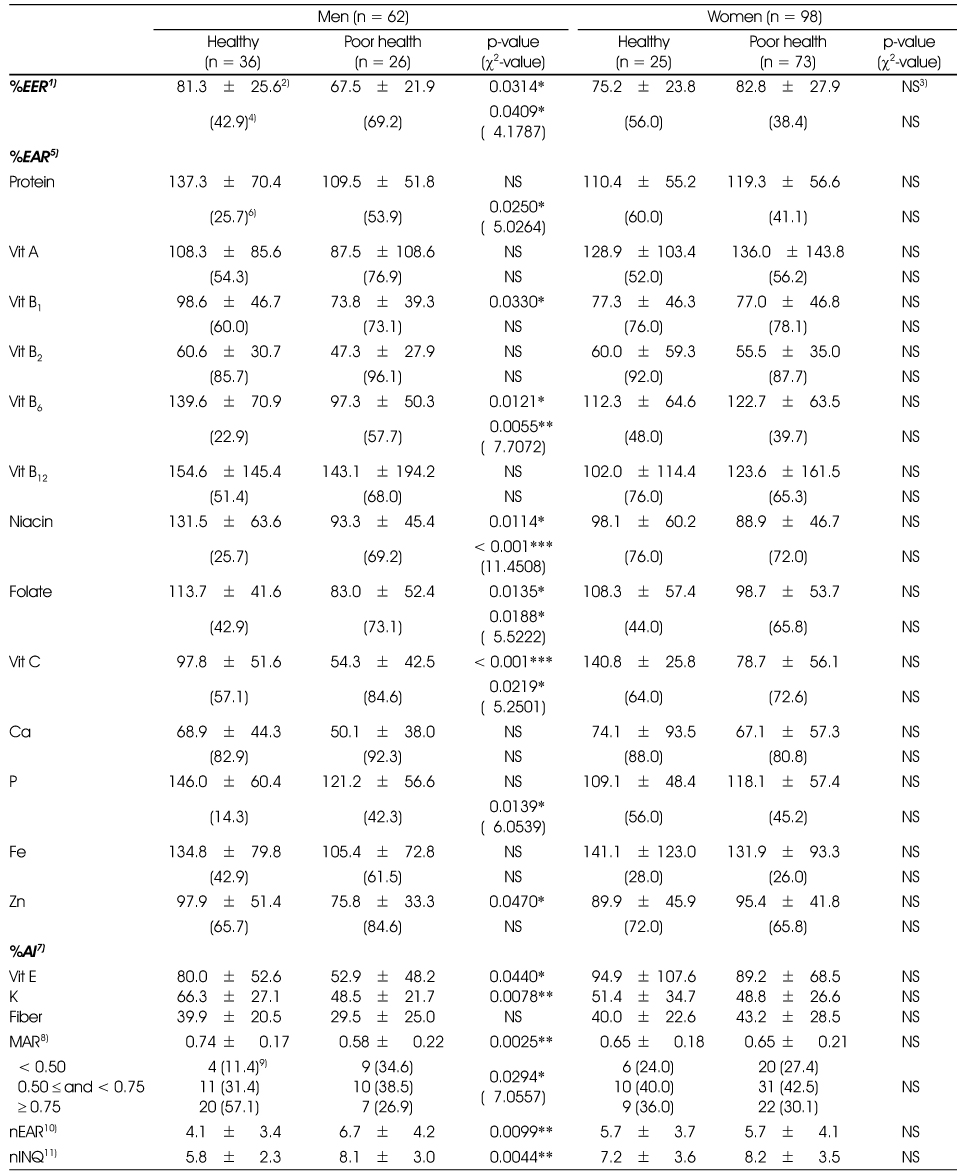
1) Estimated energy requirement, 2) Mean ± SD, 3) Not significant, 4) Percent of subjects taking energy below 75% EER, 5) Estimated average requirement, 6) Percent of subjects taking nutrient below EAR, 7) Adequate intake, 8) Mean adequacy ratio of 13 nutrients established EAR, 9) n (%), 10) Number of nutrient taken below EAR, 11) Number of nutrient of which INQ < 1
*: p < 0.05, **: p < 0.01, ***: p < 0.001
Figure & Data
REFERENCES
Citations

- Development and Validation of the Yonsei Lifestyle Profile-Satisfaction (YLP-S) Using the Rasch Measurement Model
Kang-Hyun Park, Ickpyo Hong, Ji-Hyuk Park
INQUIRY: The Journal of Health Care Organization, Provision, and Financing.2021;[Epub] CrossRef - Comparative analysis of dietary behavior and nutrient intake of elderly in urban and rural areas for development of “Village Lunch Table” program: Based on 2014 Korea National Health and Nutrition Examination Survey data
Youngmi Lee, Yourim Choi, Hae Ryun Park, Kyung Hee Song, Kyung Eun Lee, Chang Hee Yoo, Young Suk Lim
Journal of Nutrition and Health.2017; 50(2): 171. CrossRef - A Study on the Body Composition, Physical Activity Level, Basal Metabolic Rate, and Daily Energy Expenditure of Elderly in Busan
Hwa-Jae Lim
Korean Journal of Community Nutrition.2016; 21(2): 178. CrossRef - The Comparative Analysis of Health Risk Factor according to HbA1c Level of Elderly Women Dwelling in Jeonla Province - Blood Health Status, Food Habit and Nutrient Intake -
Se In Oh, Chung Shil Kwak, Mee Sook Lee
The Korean Journal of Food And Nutrition.2016; 29(3): 392. CrossRef - Changes in the Nutrition Status of Elderly Females in Health Promotion Programs of Health Centers in Chungbuk Province
Myoung-Sook Kim
The Korean Journal of Community Living Science.2015; 26(2): 225. CrossRef - A Study on the Blood Health Status and Nutrient Intake in Elderly Women Dwelling in Longevity Region in Jeonla Province according to Family Arrangement
Se In Oh, Chung Shil Kwak, Miyong Yon, Mee Sook Lee
The Korean Journal of Food And Nutrition.2014; 27(5): 940. CrossRef
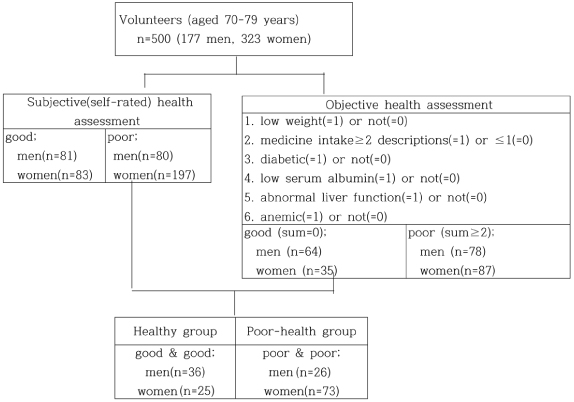
Fig. 1
Distribution of the initial volunteers in health status parameters
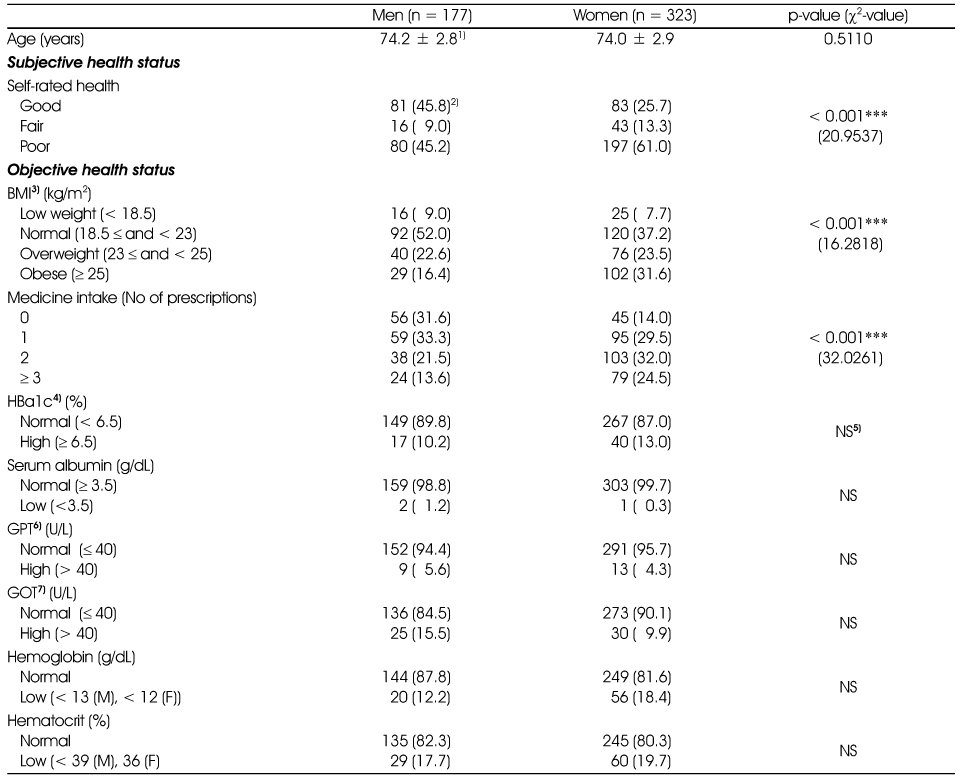
1) Mean ± SD, 2) n (%), 3) Body mass index, 4) Hemoglobin a1c, 5) Not significant, 6) Glutamic pyruvic transaminase, 7) Glutamic oxaloacetic transaminase
***: p < 0.001
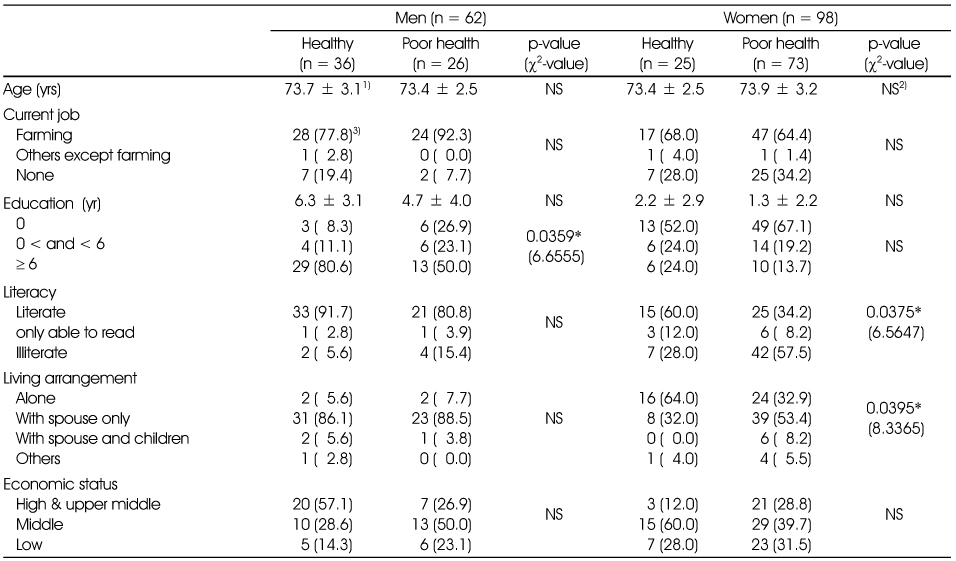
General characteristics of the subjects
1) Mean ± SD, 2) Not significant, 3) n (%)
*: p < 0.05
Blood test and self-reported disease prevalence
1) n (%), 2) Low hemoglobin (< 13 g/dL for men, < 12 g/dL for women) or low hematocrit (< 38% for men, < 36% for women), 3) Mean ± SD, 4) Not significant, 5) GOT > 40 IU/L or GPT > 40 IU/L, 6) Red blood cell < 4.2 × 10⁶/mL for men, < 3.6 × 10⁶/mL for women, 7) White blood cell < 3.8 × 10³/mL for men, < 3.15 × 10³/mL for women, 8) Insulin-like growth factor, 9) High sensitive C-reactive protein, 10) Dehydroepiandrosterone sulphate
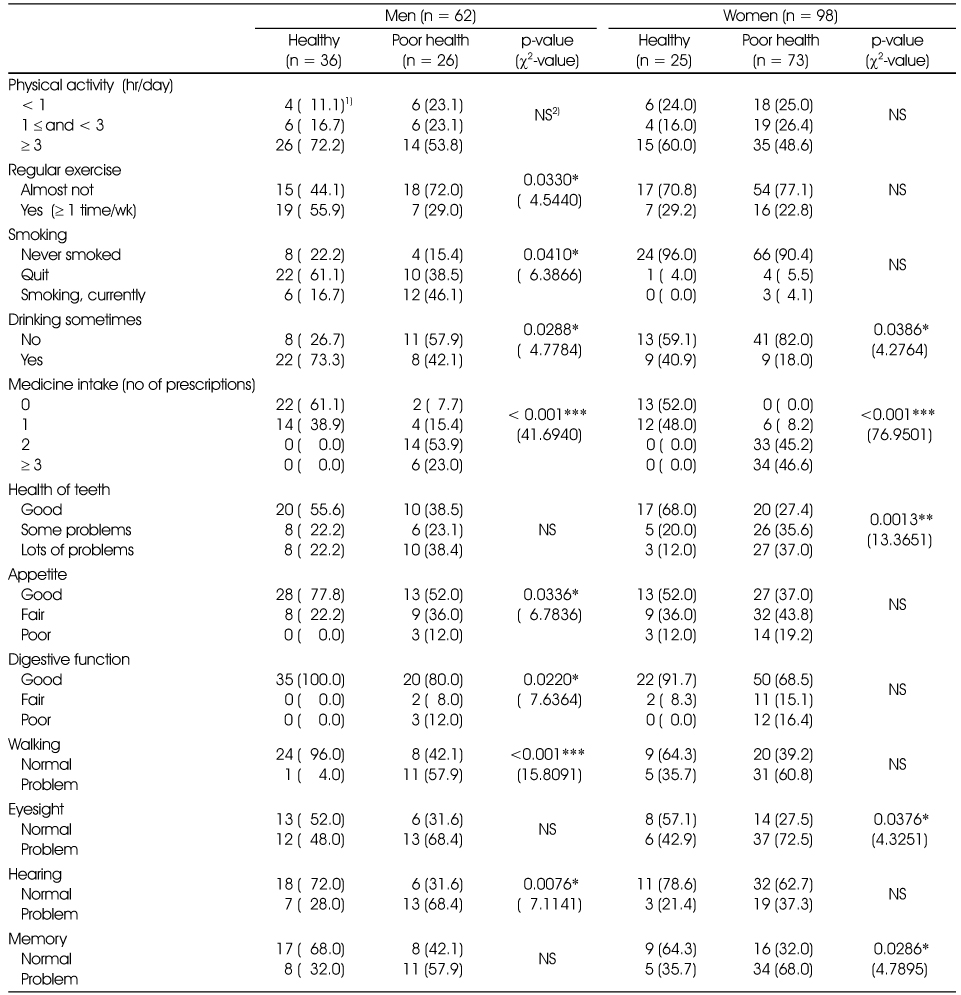
Life style and aging-associated basic functions
1) n (%), 2) Not significant
*: p < 0.05, **: p < 0.01, ***: p < 0.001
Physical measurement, muscle strength and bone mineral density
1) Mean ± SD, 2) Not significant, 3) Body mass index, 4) n (%), 5) Normal range of body fat (%): 19 ≤ and < 25 for men, 26 ≤ and < 30 for women, 6) Waist-hip circumstance ratio, 7) Normal range of WHR (%): < 95 for men, < 85 for women, 8) Bone mineral density
*: p < 0.05, **: p < 0.01, ***: p < 0.001
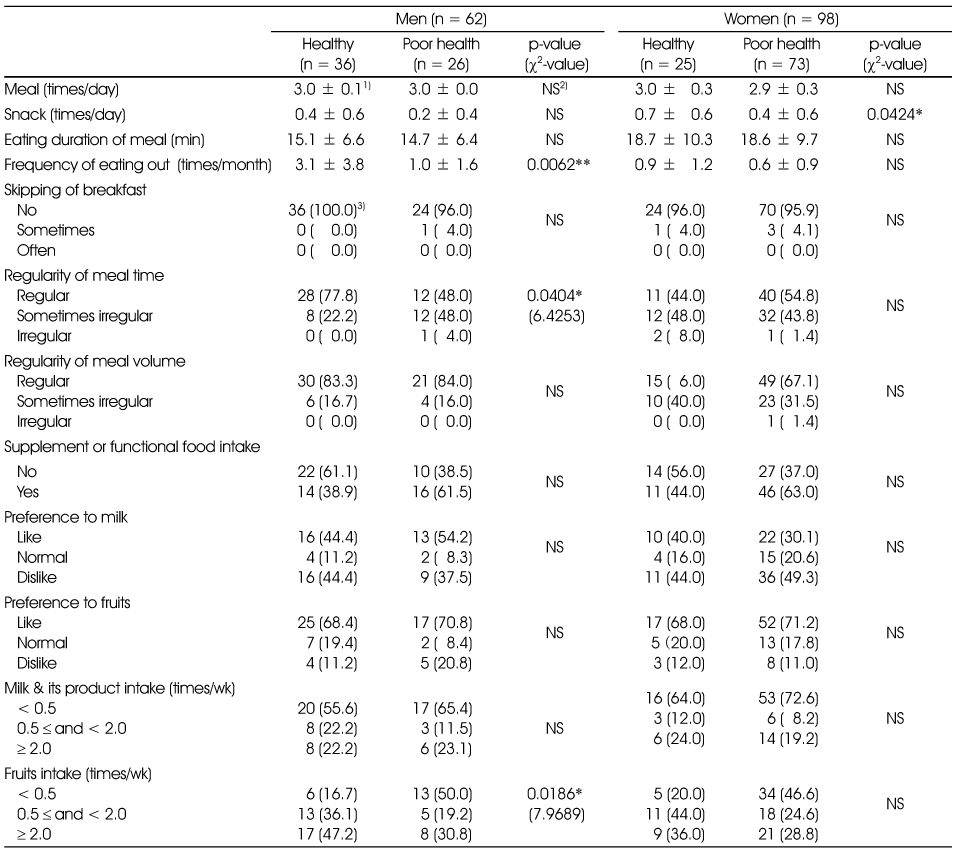
Dietary behavior
1) Mean ± SD, 2) Not significant, 3) n (%)
*: p < 0.05, **: p < 0.01, ***: p < 0.001
Average daily food intake, meal balance and diversity
1) Mean ± SD, 2) Not significant, 3) Dietary variety score, 4) Korean dietary diversity score: number of taken food group in a day from 6 food groups such as grain & potatoes, meat, eggs & fish, legumes, milk & its product, vegetables and fruits, 5) Meal balance
*: p < 0.05, **: p < 0.01, ***: p < 0.001
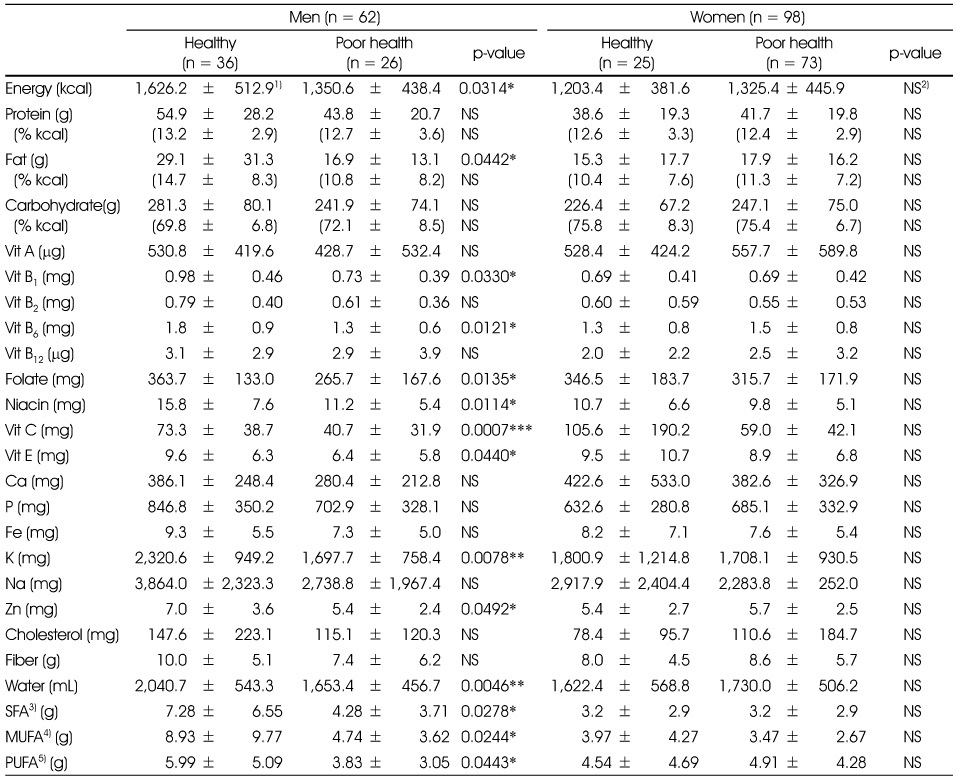
Average daily nutrient intakes
1) Mean ± SD, 2) Not significant, 3) Saturated fatty acid, 4) Monounsaturated fatty acid, 5) Polyunsaturated fatty acid
*: p < 0.05, **: p < 0.01, ***: p < 0.001
Proportions of daily energy and nutrient intakes to Korean dietary recommendation, mean adequacy ratio (MAR) and index of nutrient quality (INQ) of diet
1) Estimated energy requirement, 2) Mean ± SD, 3) Not significant, 4) Percent of subjects taking energy below 75% EER, 5) Estimated average requirement, 6) Percent of subjects taking nutrient below EAR, 7) Adequate intake, 8) Mean adequacy ratio of 13 nutrients established EAR, 9) n (%), 10) Number of nutrient taken below EAR, 11) Number of nutrient of which INQ < 1
*: p < 0.05, **: p < 0.01, ***: p < 0.001
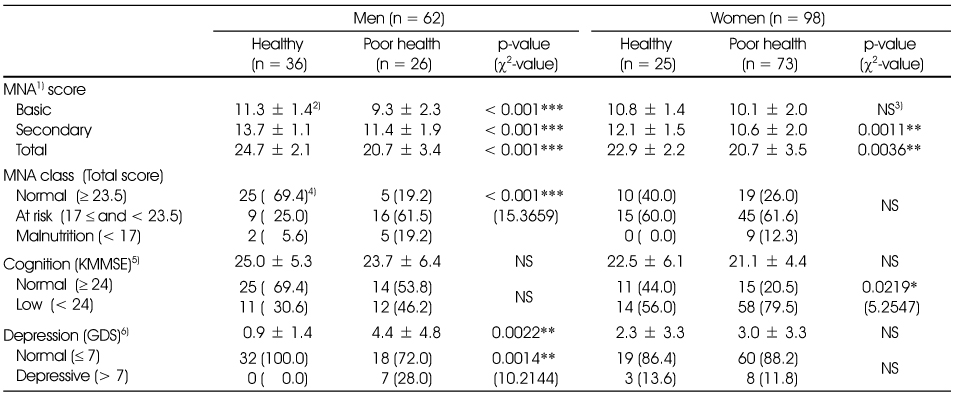
Mini-nutrient status assessment, depression and cognitive function
1) Mini-nutrient status assessment, 2) Mean ± SD, 3) Not significant, 4) n (%), 5) Korean mini-mental status examination, 6) Geriatric depression scale
*: p < 0.05, **: p < 0.01, ***: p < 0.001
1) Mean ± SD, 2) n (%), 3) Body mass index, 4) Hemoglobin a1c, 5) Not significant, 6) Glutamic pyruvic transaminase, 7) Glutamic oxaloacetic transaminase ***: p < 0.001
1) Mean ± SD, 2) Not significant, 3) n (%) *: p < 0.05
1) n (%), 2) Low hemoglobin (< 13 g/dL for men, < 12 g/dL for women) or low hematocrit (< 38% for men, < 36% for women), 3) Mean ± SD, 4) Not significant, 5) GOT > 40 IU/L or GPT > 40 IU/L, 6) Red blood cell < 4.2 × 10⁶/mL for men, < 3.6 × 10⁶/mL for women, 7) White blood cell < 3.8 × 10³/mL for men, < 3.15 × 10³/mL for women, 8) Insulin-like growth factor, 9) High sensitive C-reactive protein, 10) Dehydroepiandrosterone sulphate
1) n (%), 2) Not significant *: p < 0.05, **: p < 0.01, ***: p < 0.001
1) Mean ± SD, 2) Not significant, 3) Body mass index, 4) n (%), 5) Normal range of body fat (%): 19 ≤ and < 25 for men, 26 ≤ and < 30 for women, 6) Waist-hip circumstance ratio, 7) Normal range of WHR (%): < 95 for men, < 85 for women, 8) Bone mineral density *: p < 0.05, **: p < 0.01, ***: p < 0.001
1) Mean ± SD, 2) Not significant, 3) n (%) *: p < 0.05, **: p < 0.01, ***: p < 0.001
1) Mean ± SD, 2) Not significant, 3) Dietary variety score, 4) Korean dietary diversity score: number of taken food group in a day from 6 food groups such as grain & potatoes, meat, eggs & fish, legumes, milk & its product, vegetables and fruits, 5) Meal balance *: p < 0.05, **: p < 0.01, ***: p < 0.001
1) Mean ± SD, 2) Not significant, 3) Saturated fatty acid, 4) Monounsaturated fatty acid, 5) Polyunsaturated fatty acid *: p < 0.05, **: p < 0.01, ***: p < 0.001
1) Estimated energy requirement, 2) Mean ± SD, 3) Not significant, 4) Percent of subjects taking energy below 75% EER, 5) Estimated average requirement, 6) Percent of subjects taking nutrient below EAR, 7) Adequate intake, 8) Mean adequacy ratio of 13 nutrients established EAR, 9) n (%), 10) Number of nutrient taken below EAR, 11) Number of nutrient of which INQ < 1 *: p < 0.05, **: p < 0.01, ***: p < 0.001
1) Mini-nutrient status assessment, 2) Mean ± SD, 3) Not significant, 4) n (%), 5) Korean mini-mental status examination, 6) Geriatric depression scale *: p < 0.05, **: p < 0.01, ***: p < 0.001

 KSCN
KSCN

 Cite
Cite


