
Articles
- Page Path
- HOME > Korean J Community Nutr > Volume 19(2); 2014 > Article
-
Research Article
- Investigation on Influencing Environmental Factors on Health Status of Korean Septuagenarians Dwelling in Longevity Region in Jeonla Province
- Chung Shil Kwak, Miyong Yon, Mee Sook Lee, Se In Oh, Sang Chul Park
-
Korean Journal of Community Nutrition 2014;19(2):142-162.
DOI: https://doi.org/10.5720/kjcn.2014.19.2.142
Published online: April 30, 2014
1Institute on Aging, Seoul National University, Seoul, Korea.
2Nutrition Policy Team, Department of Health Industry & Policy, Korea Heallth Industry Development Institute, Chungwon, Korea.
3Department of Food and Nutrition, Hannam University, Daejeon, Korea.
4Department of Food and Nutrition, Seoil University, Seoul, Korea.
- Corresponding author: Chung Shil Kwak. Institute on Aging, Seoul National University, 199-1 Dongsoong-dong, Jongno-gu, Seoul 110-810, Korea. Tel: (02) 740-8506, Fax: (02) 742-0626, kwakcs@snu.ac.kr
• Received: December 27, 2013 • Revised: March 14, 2014 • Accepted: March 14, 2014
Copyright © 2014 The Korean Society of Community Nutrition
This is an Open-Access article distributed under the terms of the Creative Commons Attribution Non-Commercial License (http://creativecommons.org/licenses/by-nc/3.0/) which permits unrestricted non-commercial use, distribution, and reproduction in any medium, provided the original work is properly cited.
- 1,854 Views
- 2 Download
- 6 Crossref
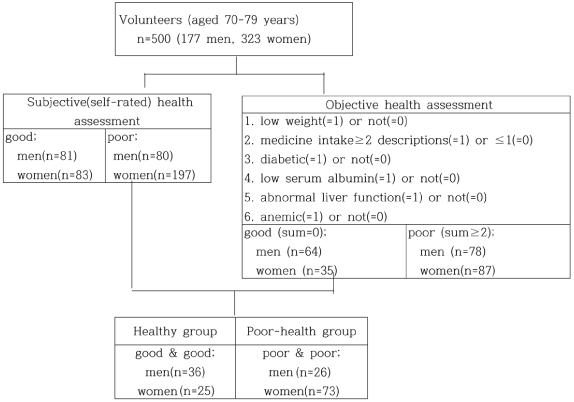
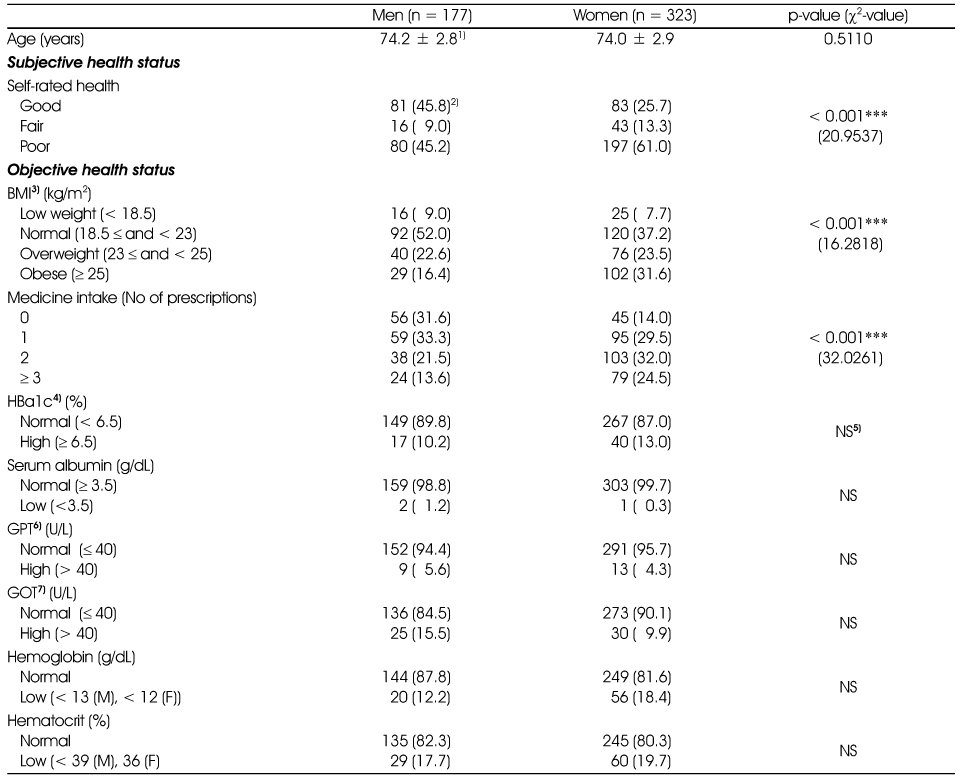
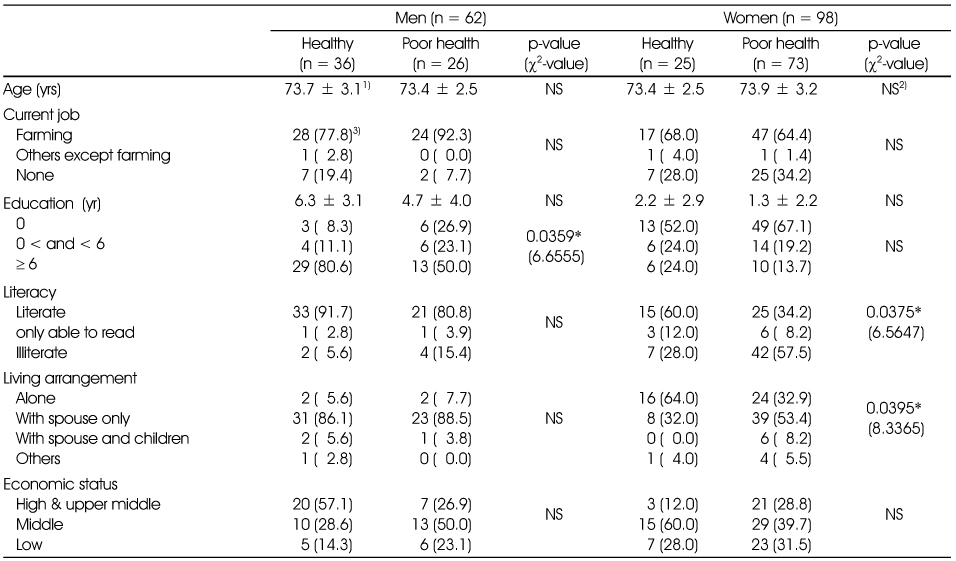
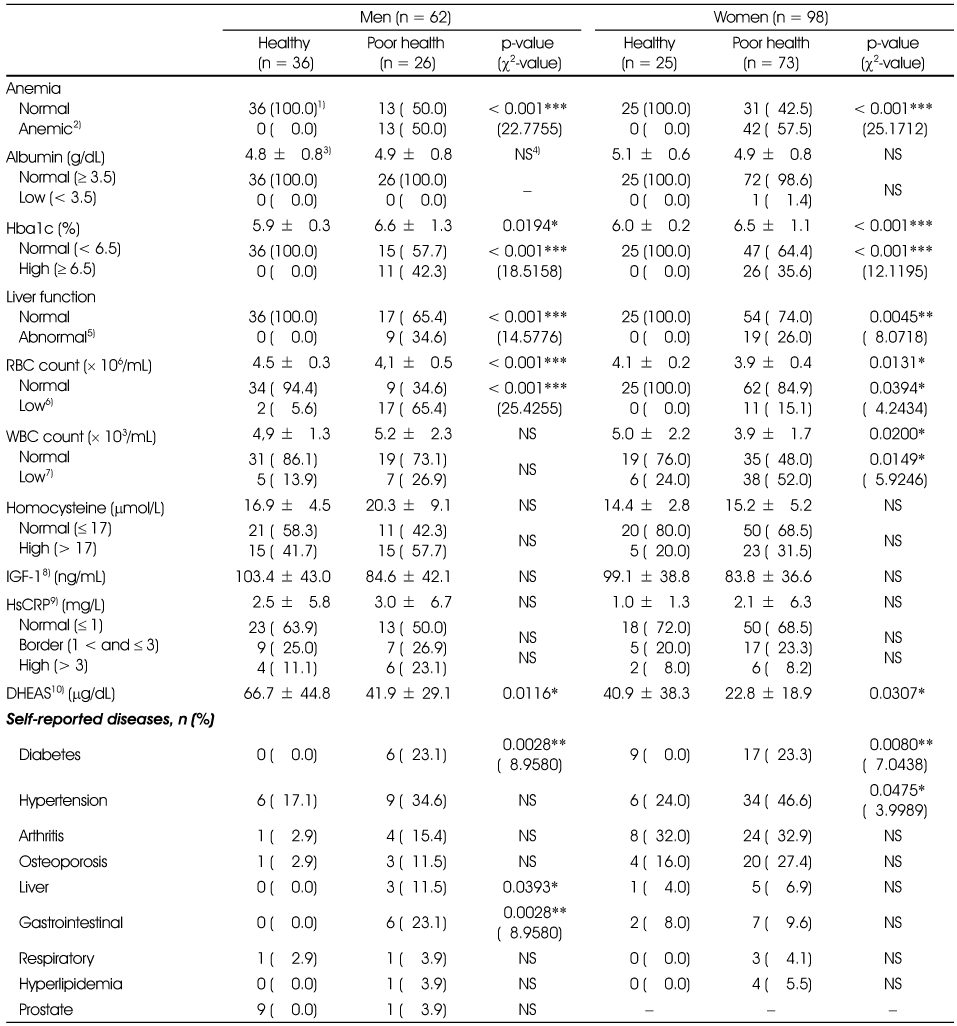
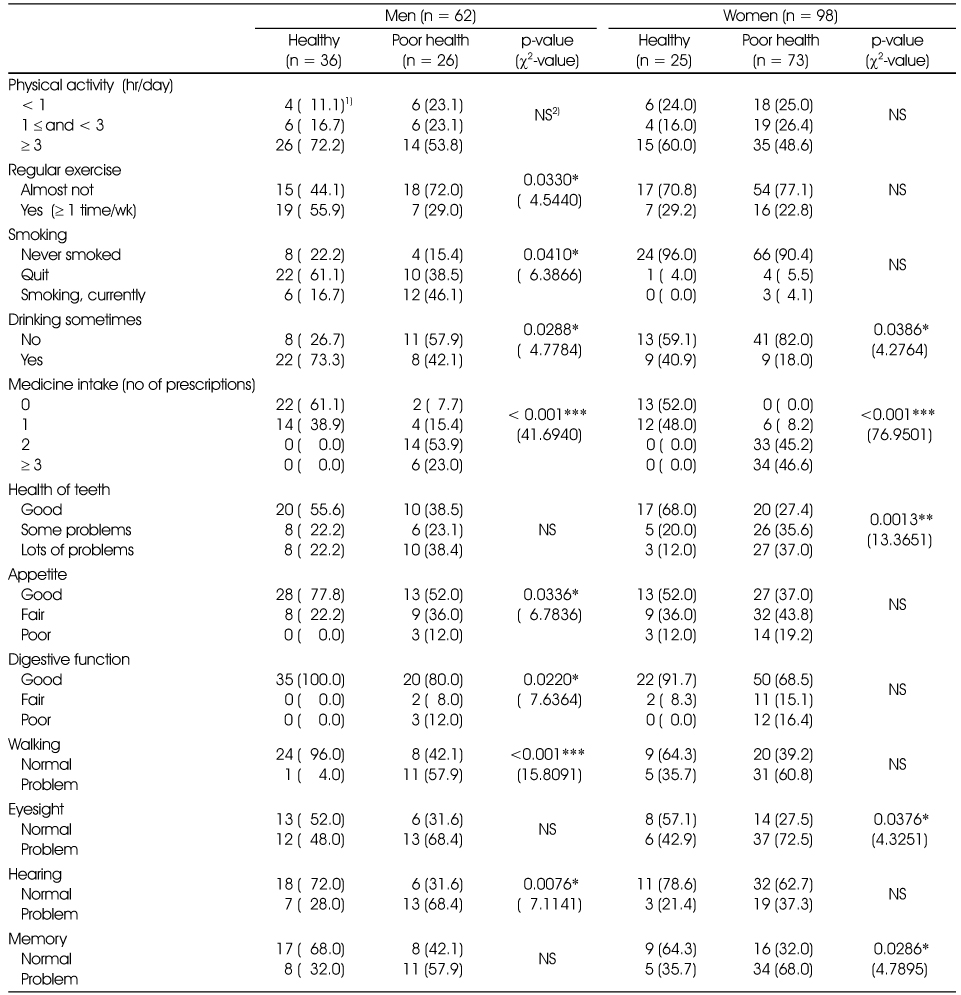
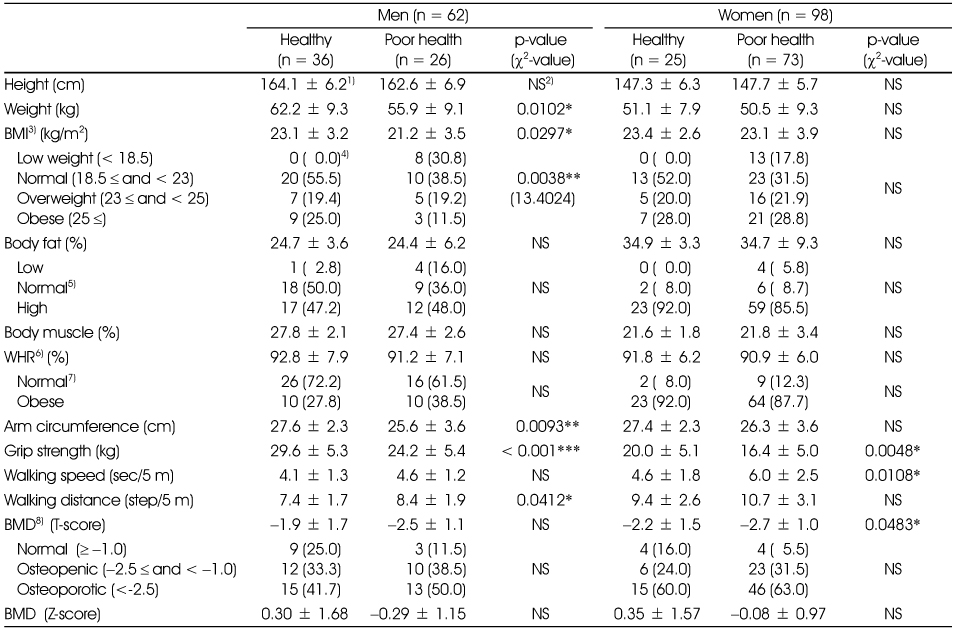
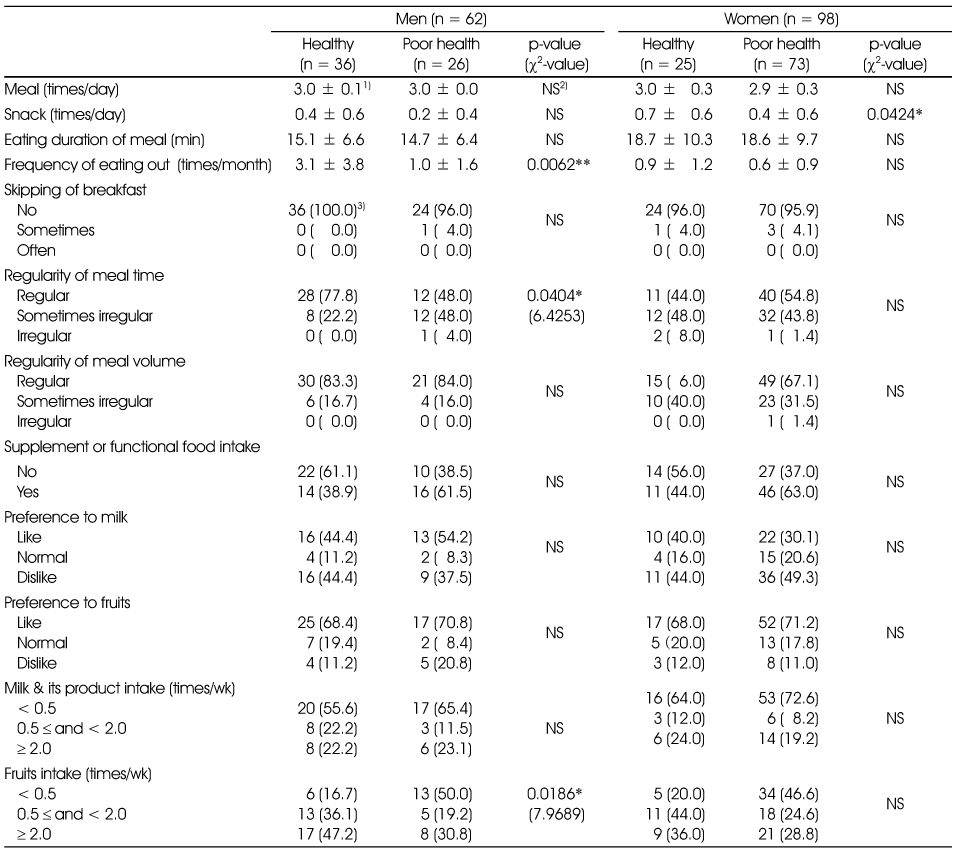
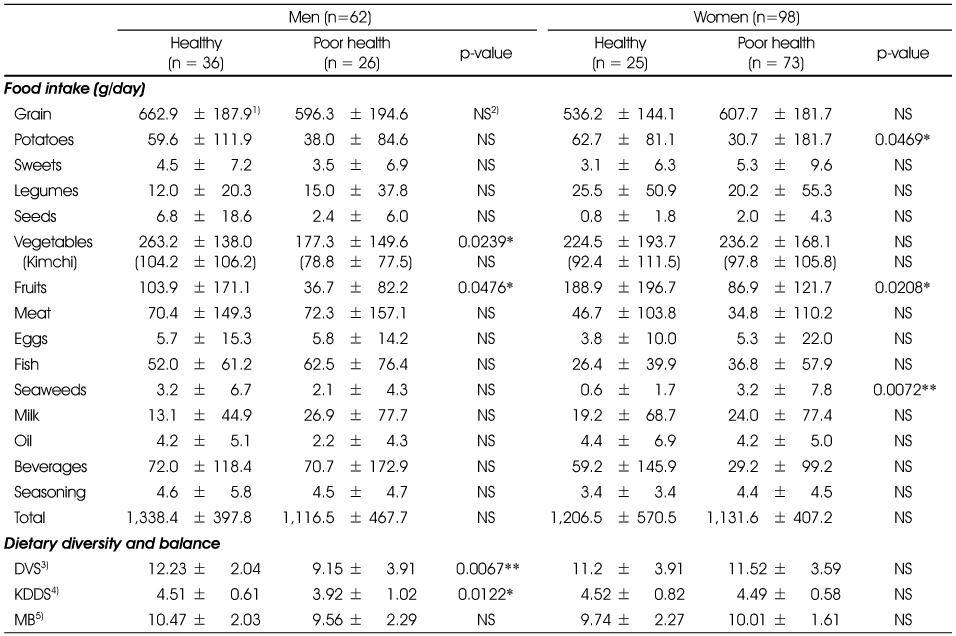
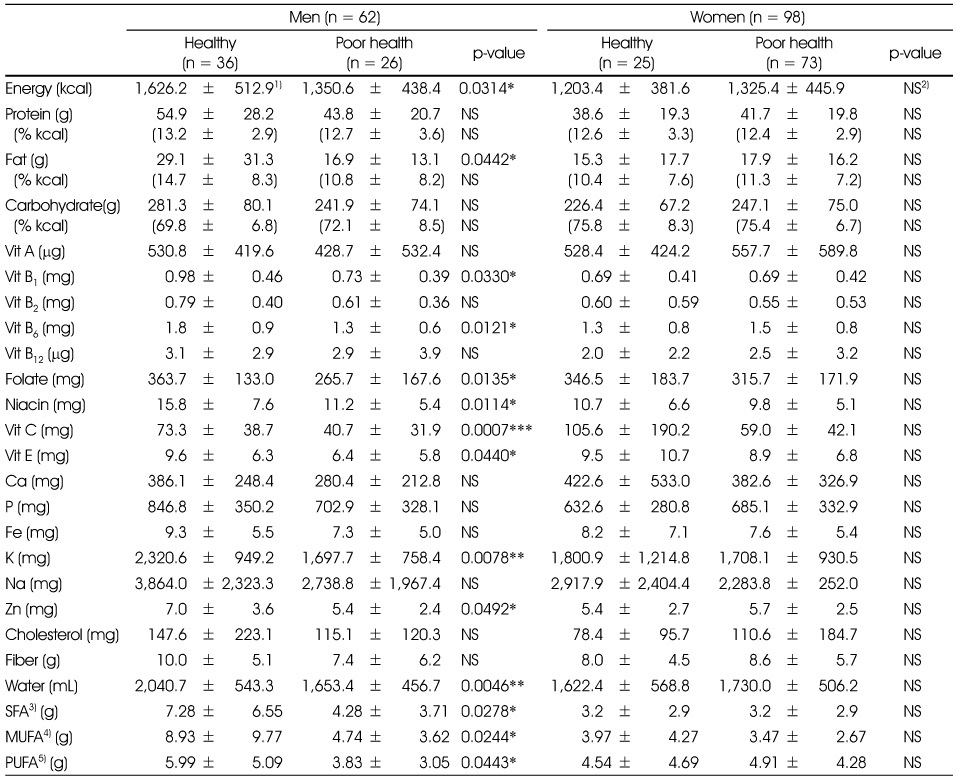
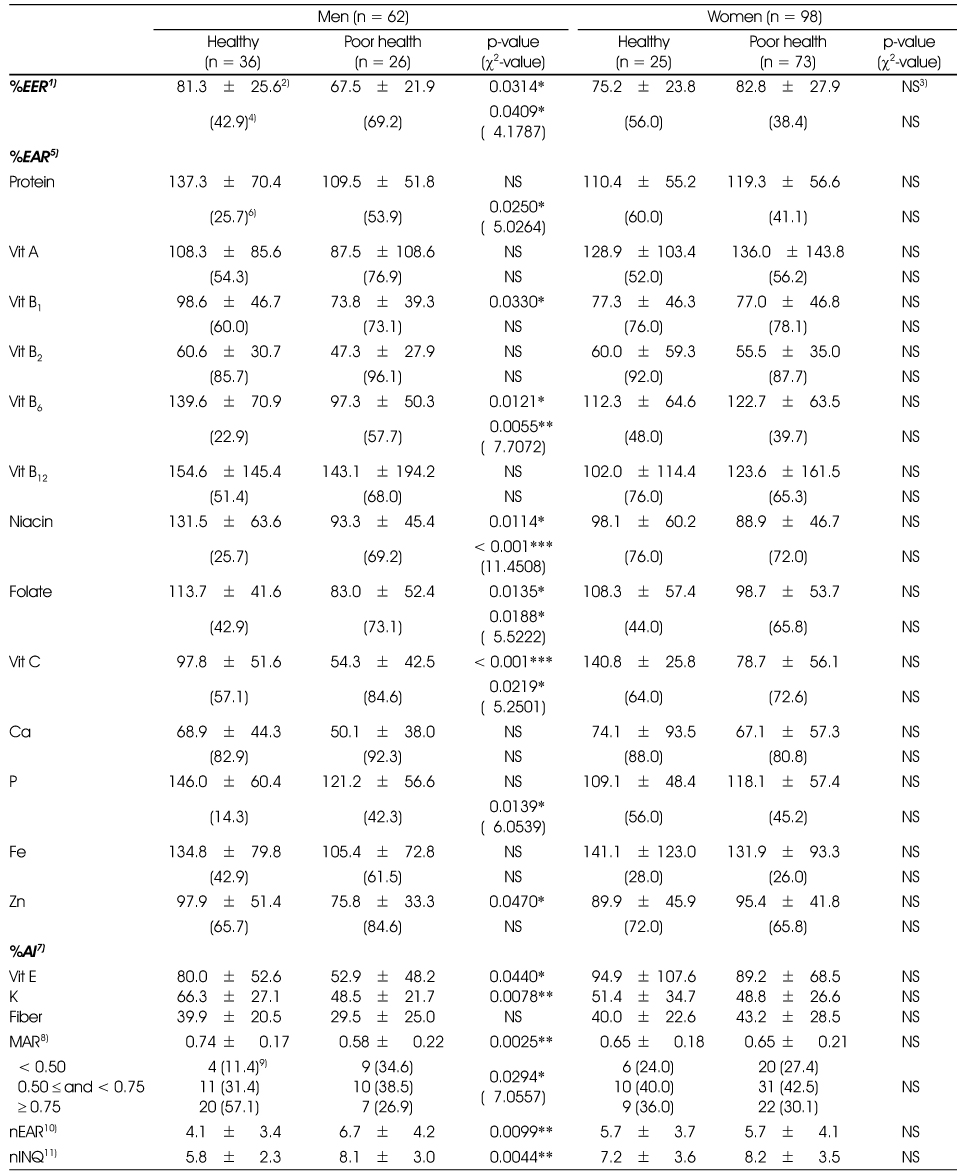
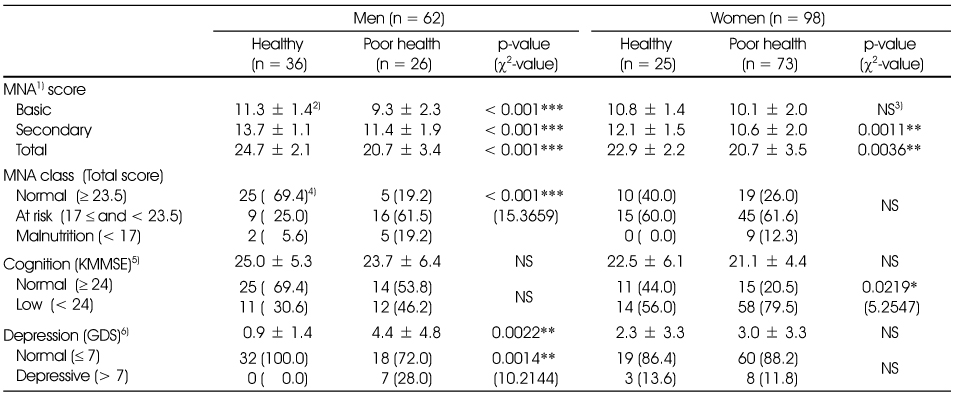
Figure & Data
REFERENCES
Citations
Citations to this article as recorded by 
- Development and Validation of the Yonsei Lifestyle Profile-Satisfaction (YLP-S) Using the Rasch Measurement Model
Kang-Hyun Park, Ickpyo Hong, Ji-Hyuk Park
INQUIRY: The Journal of Health Care Organization, Provision, and Financing.2021;[Epub] CrossRef - Comparative analysis of dietary behavior and nutrient intake of elderly in urban and rural areas for development of “Village Lunch Table” program: Based on 2014 Korea National Health and Nutrition Examination Survey data
Youngmi Lee, Yourim Choi, Hae Ryun Park, Kyung Hee Song, Kyung Eun Lee, Chang Hee Yoo, Young Suk Lim
Journal of Nutrition and Health.2017; 50(2): 171. CrossRef - A Study on the Body Composition, Physical Activity Level, Basal Metabolic Rate, and Daily Energy Expenditure of Elderly in Busan
Hwa-Jae Lim
Korean Journal of Community Nutrition.2016; 21(2): 178. CrossRef - The Comparative Analysis of Health Risk Factor according to HbA1c Level of Elderly Women Dwelling in Jeonla Province - Blood Health Status, Food Habit and Nutrient Intake -
Se In Oh, Chung Shil Kwak, Mee Sook Lee
The Korean Journal of Food And Nutrition.2016; 29(3): 392. CrossRef - Changes in the Nutrition Status of Elderly Females in Health Promotion Programs of Health Centers in Chungbuk Province
Myoung-Sook Kim
The Korean Journal of Community Living Science.2015; 26(2): 225. CrossRef - A Study on the Blood Health Status and Nutrient Intake in Elderly Women Dwelling in Longevity Region in Jeonla Province according to Family Arrangement
Se In Oh, Chung Shil Kwak, Miyong Yon, Mee Sook Lee
The Korean Journal of Food And Nutrition.2014; 27(5): 940. CrossRef
 Cite
CiteInvestigation on Influencing Environmental Factors on Health Status of Korean Septuagenarians Dwelling in Longevity Region in Jeonla Province

Fig. 1
Flow chart of selection process of healthy or poor-health persons.
Fig. 1
Investigation on Influencing Environmental Factors on Health Status of Korean Septuagenarians Dwelling in Longevity Region in Jeonla Province
Distribution of the initial volunteers in health status parameters
1) Mean ± SD, 2) n (%), 3) Body mass index, 4) Hemoglobin a1c, 5) Not significant, 6) Glutamic pyruvic transaminase, 7) Glutamic oxaloacetic transaminase
***: p < 0.001
General characteristics of the subjects
1) Mean ± SD, 2) Not significant, 3) n (%)
*: p < 0.05
Blood test and self-reported disease prevalence
1) n (%), 2) Low hemoglobin (< 13 g/dL for men, < 12 g/dL for women) or low hematocrit (< 38% for men, < 36% for women), 3) Mean ± SD, 4) Not significant, 5) GOT > 40 IU/L or GPT > 40 IU/L, 6) Red blood cell < 4.2 × 10⁶/mL for men, < 3.6 × 10⁶/mL for women, 7) White blood cell < 3.8 × 10³/mL for men, < 3.15 × 10³/mL for women, 8) Insulin-like growth factor, 9) High sensitive C-reactive protein, 10) Dehydroepiandrosterone sulphate
Life style and aging-associated basic functions
1) n (%), 2) Not significant
*: p < 0.05, **: p < 0.01, ***: p < 0.001
Physical measurement, muscle strength and bone mineral density
1) Mean ± SD, 2) Not significant, 3) Body mass index, 4) n (%), 5) Normal range of body fat (%): 19 ≤ and < 25 for men, 26 ≤ and < 30 for women, 6) Waist-hip circumstance ratio, 7) Normal range of WHR (%): < 95 for men, < 85 for women, 8) Bone mineral density
*: p < 0.05, **: p < 0.01, ***: p < 0.001
Dietary behavior
1) Mean ± SD, 2) Not significant, 3) n (%)
*: p < 0.05, **: p < 0.01, ***: p < 0.001
Average daily food intake, meal balance and diversity
1) Mean ± SD, 2) Not significant, 3) Dietary variety score, 4) Korean dietary diversity score: number of taken food group in a day from 6 food groups such as grain & potatoes, meat, eggs & fish, legumes, milk & its product, vegetables and fruits, 5) Meal balance
*: p < 0.05, **: p < 0.01, ***: p < 0.001
Average daily nutrient intakes
1) Mean ± SD, 2) Not significant, 3) Saturated fatty acid, 4) Monounsaturated fatty acid, 5) Polyunsaturated fatty acid
*: p < 0.05, **: p < 0.01, ***: p < 0.001
Proportions of daily energy and nutrient intakes to Korean dietary recommendation, mean adequacy ratio (MAR) and index of nutrient quality (INQ) of diet
1) Estimated energy requirement, 2) Mean ± SD, 3) Not significant, 4) Percent of subjects taking energy below 75% EER, 5) Estimated average requirement, 6) Percent of subjects taking nutrient below EAR, 7) Adequate intake, 8) Mean adequacy ratio of 13 nutrients established EAR, 9) n (%), 10) Number of nutrient taken below EAR, 11) Number of nutrient of which INQ < 1
*: p < 0.05, **: p < 0.01, ***: p < 0.001
Mini-nutrient status assessment, depression and cognitive function
1) Mini-nutrient status assessment, 2) Mean ± SD, 3) Not significant, 4) n (%), 5) Korean mini-mental status examination, 6) Geriatric depression scale
*: p < 0.05, **: p < 0.01, ***: p < 0.001
Table 1
Distribution of the initial volunteers in health status parameters
1) Mean ± SD, 2) n (%), 3) Body mass index, 4) Hemoglobin a1c, 5) Not significant, 6) Glutamic pyruvic transaminase, 7) Glutamic oxaloacetic transaminase ***: p < 0.001
Table 2
General characteristics of the subjects
1) Mean ± SD, 2) Not significant, 3) n (%) *: p < 0.05
Table 3
Blood test and self-reported disease prevalence
1) n (%), 2) Low hemoglobin (< 13 g/dL for men, < 12 g/dL for women) or low hematocrit (< 38% for men, < 36% for women), 3) Mean ± SD, 4) Not significant, 5) GOT > 40 IU/L or GPT > 40 IU/L, 6) Red blood cell < 4.2 × 10⁶/mL for men, < 3.6 × 10⁶/mL for women, 7) White blood cell < 3.8 × 10³/mL for men, < 3.15 × 10³/mL for women, 8) Insulin-like growth factor, 9) High sensitive C-reactive protein, 10) Dehydroepiandrosterone sulphate
Table 4
Life style and aging-associated basic functions
1) n (%), 2) Not significant *: p < 0.05, **: p < 0.01, ***: p < 0.001
Table 5
Physical measurement, muscle strength and bone mineral density
1) Mean ± SD, 2) Not significant, 3) Body mass index, 4) n (%), 5) Normal range of body fat (%): 19 ≤ and < 25 for men, 26 ≤ and < 30 for women, 6) Waist-hip circumstance ratio, 7) Normal range of WHR (%): < 95 for men, < 85 for women, 8) Bone mineral density *: p < 0.05, **: p < 0.01, ***: p < 0.001
Table 6
Dietary behavior
1) Mean ± SD, 2) Not significant, 3) n (%) *: p < 0.05, **: p < 0.01, ***: p < 0.001
Table 7
Average daily food intake, meal balance and diversity
1) Mean ± SD, 2) Not significant, 3) Dietary variety score, 4) Korean dietary diversity score: number of taken food group in a day from 6 food groups such as grain & potatoes, meat, eggs & fish, legumes, milk & its product, vegetables and fruits, 5) Meal balance *: p < 0.05, **: p < 0.01, ***: p < 0.001
Table 8
Average daily nutrient intakes
1) Mean ± SD, 2) Not significant, 3) Saturated fatty acid, 4) Monounsaturated fatty acid, 5) Polyunsaturated fatty acid *: p < 0.05, **: p < 0.01, ***: p < 0.001
Table 9
Proportions of daily energy and nutrient intakes to Korean dietary recommendation, mean adequacy ratio (MAR) and index of nutrient quality (INQ) of diet
1) Estimated energy requirement, 2) Mean ± SD, 3) Not significant, 4) Percent of subjects taking energy below 75% EER, 5) Estimated average requirement, 6) Percent of subjects taking nutrient below EAR, 7) Adequate intake, 8) Mean adequacy ratio of 13 nutrients established EAR, 9) n (%), 10) Number of nutrient taken below EAR, 11) Number of nutrient of which INQ < 1 *: p < 0.05, **: p < 0.01, ***: p < 0.001
Table 10
Mini-nutrient status assessment, depression and cognitive function
1) Mini-nutrient status assessment, 2) Mean ± SD, 3) Not significant, 4) n (%), 5) Korean mini-mental status examination, 6) Geriatric depression scale *: p < 0.05, **: p < 0.01, ***: p < 0.001


