
Articles
- Page Path
- HOME > Korean J Community Nutr > Volume 29(2); 2024 > Article
-
Research Article
- Impact of postoperative dietary types on nutrition and treatment prognosis in hospitalized patients undergoing oral and maxillofacial surgery: a comparative study
-
Sung Bin Youn1)
 , Se-Hui Ahn2), Dong-Ho Cho1), Hoon Myoung3),†
 -
Korean Journal of Community Nutrition 2024;29(2):129-143.
DOI: https://doi.org/10.5720/kjcn.2024.29.2.129
Published online: April 24, 2024
1)Doctoral Student, Department of Oral and Maxillofacial Surgery, Dental Research Institute, School of Dentistry, Seoul National University, Seoul, Korea
2)Master Student, Department of Oral and Maxillofacial Surgery, Dental Research Institute, School of Dentistry, Seoul National University, Seoul, Korea
3)Professor, Department of Oral and Maxillofacial Surgery, Dental Research Institute, School of Dentistry, Seoul National University, Seoul, Korea
- †Corresponding author: Hoon Myoung Department of Oral and Maxillofacial Surgery, Dental Research Institute, School of Dentistry, Seoul National University, 101 Daehak-ro, Jongno-gu, Seoul 03080, Korea. Tel: +82-2-6256-3131 Fax: +82-2-6256-3098 Email: myoungh@snu.ac.kr
• Received: February 2, 2024 • Revised: March 28, 2024 • Accepted: April 16, 2024
© 2024 The Korean Society of Community Nutrition
This is an Open-Access article distributed under the terms of the Creative Commons Attribution Non-Commercial License (http://creativecommons.org/licenses/by-nc/4.0) which permits unrestricted non-commercial use, distribution, and reproduction in any medium, provided the original work is properly cited.
- 3,455 Views
- 102 Download
- 3 Crossref
Abstract
-
Objectives
- The objective of this study is to compare a nutritionally balanced soft blend diet (SBD) with a soft fluid diet (SFD) on the health of inpatients who have undergone oral and maxillofacial (OMF) surgery, ultimately aiming to enhance care outcomes, improve health-related quality of life (QOL), and increase satisfaction with the hospital.
-
Methods
- Thirty-two patients were randomized into two groups: sixteen received SFD and sixteen received SBD. Anthropometric, laboratory evaluations were conducted upon admission and discharge. Patients filled out questionnaires on demographics, diet satisfaction, food intake amount, and health-related QOL on the day of discharge, assessed using the EuroQoL 5 Dimensions 3 Level and EuroQoL Visual Analogue Scale (EQ-VAS) instruments. Data were analyzed with descriptive statistics, χ2 tests for group differences, and paired nonparametric t-tests for within-group comparisons. The Mann-Whitney U test evaluated inter-group differences in preoperative weight and body mass index (BMI), postoperative changes, meal satisfaction, intake, health-related QOL, and self-assessed health status. P-values were set at a significance level of 0.05.
-
Results
- The SBD group had higher dietary intake (63.2% vs. 51.0%) and greater diet satisfaction (80.6 vs. 48.1, P < 0.0001) compared to SFD group. Health-related QOL, measured by EQ-VAS, was better in SBD group (70.3 vs. 58.8, P < 0.05). Postoperative weight and BMI decreased in SFD group but increased in SBD group (P < 0.01). Changes in laboratory results showed more stability in the SBD group. No postoperative infections were reported in SBD group, whereas SFD group had a 31.25% complication rate.
-
Conclusions
- While SFD is often recommended after OMF surgery to protect oral wound healing process, our study reveals that SBD not only enhances physical and psychological outcomes but also, somewhat unexpectedly, supports wound healing and reduces complications. Essentially, SBD promotes physical recovery and enhances health-related QOL than SFD by supporting both somatic and mental healing aspects.
INTRODUCTION
METHODS
RESULTS
DISCUSSION
CONCLUSIONS
-
Conflict of Interest
There are no financial or other issues that might lead to a conflict of interest.
-
Data Availability
The participants of this study did not give written consent for their data to be shared publicly, so due to the sensitive nature of the research supporting data is not available.
-
ACKNOWLEDGMENTS
The authors would like to thank the patient, who allowed us to report this clinical case.
NOTES
SUPPLEMENTARY MATERIALS
Supplementary Fig. 1.

Fig. 2.
The course of studies.
ASA, American Society of Anesthesiologists; SFD, soft fluid diet; SBD, soft blend diet; BMI, body mass index.
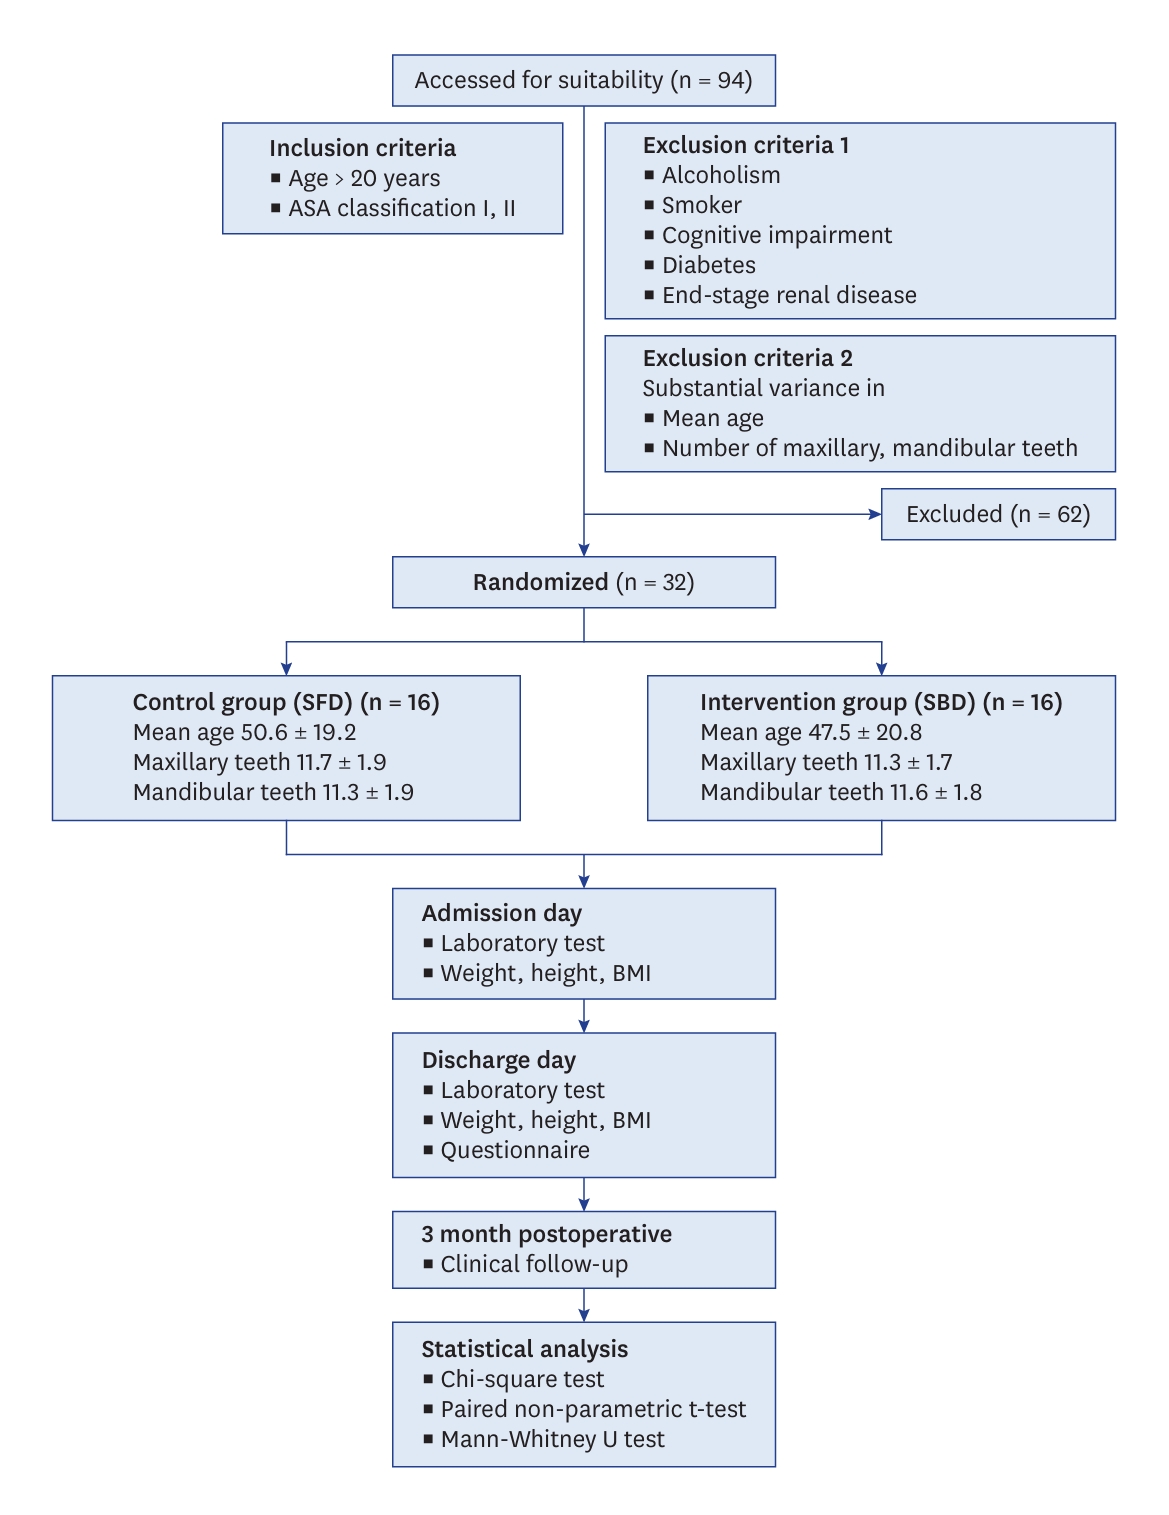
Fig. 3.
(A) Overall meal satisfaction. (B) EQ-VAS.
SFD, soft fluid diet; SBD, soft blend diet; EQ-VAS, EuroQoL Visual Analogue Scale.
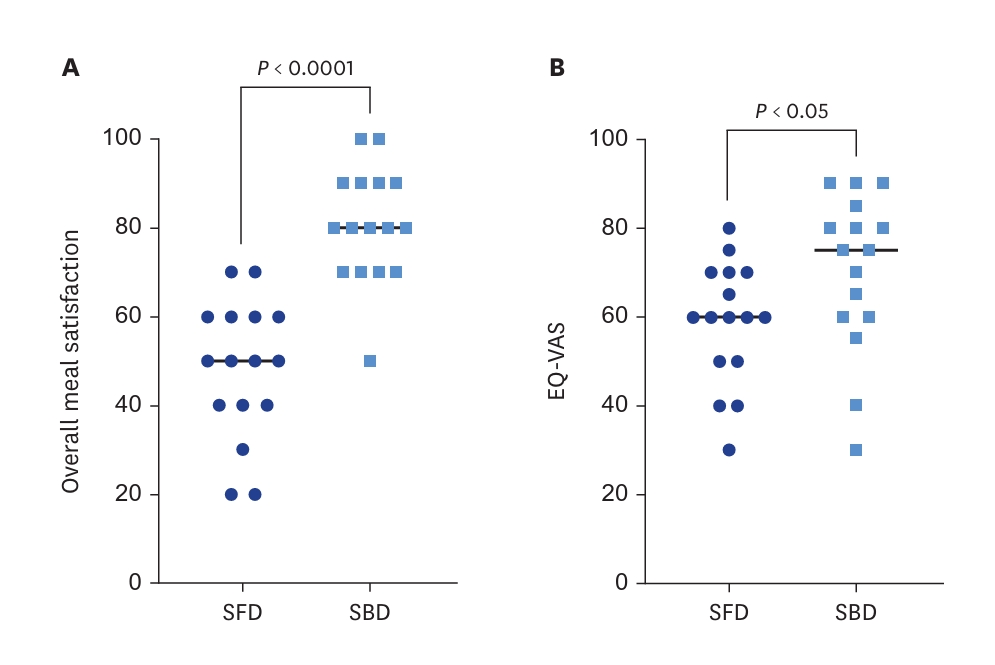
Table 1.Dietary composition of the provided diet (SFD, SBD)
Table 2.General characteristics of the participants
| Variables | Total (n = 32) | SFD group (n = 16) | SBD group (n = 16) | P-value1) |
|---|---|---|---|---|
| Sex | 0.937 | |||
| Male | 19 | 10 | 9 | |
| Female | 13 | 6 | 7 | |
| Age (years) | 49.0 ± 20.1 | 50.6 ± 19.2 | 47.5 ± 20.8 | 0.992 |
| 20–29 | 7 | 3 | 4 | |
| 30–39 | 5 | 2 | 3 | |
| 40–49 | 7 | 4 | 3 | |
| 50–59 | 1 | 1 | 0 | |
| ≥ 60 | 12 | 6 | 6 | |
| Hospital stay (days) | 3.6 ± 2.2 | 3.1 ± 1.2 | 4.2 ± 2.9 | 0.883 |
| 1–2 | 4 | 2 | 2 | |
| 3–4 | 24 | 13 | 11 | |
| ≥ 5 | 4 | 1 | 3 | |
| Maxillary teeth2) | 11.5 ± 1.9 | 11.7 ± 1.9 | 11.3 ± 1.7 | 0.533 |
| Mandibular teeth2) | 11.5 ± 1.8 | 11.3 ± 1.9 | 11.6 ± 1.8 | 0.553 |
Table 3.The characteristics of dietary intake
| Characteristics | SFD (n = 16) | SBD (n = 16) | P-value1) |
|---|---|---|---|
| Post-operative appetite (of 5) | 2.4 | 2.9 | 0.0211 |
| Intakes of served amount (of 100%) | |||
| Rice gruel/Rice porridge | 69.3% | 75.9% | |
| Side dishes | 40.0% | 52.1% | |
| Soup | 42.6% | 61.5% | |
| Total | 51.0% | 63.2% | |
| The reasons for left-over | |||
| Dissatisfaction with taste | 4 (25.00) | 4 (25.00) | |
| Concerns of sanitation | 0 (0.00) | 0 (0.00) | |
| Provided too much | 2 (12.50) | 1 (6.25) | |
| Insufficient salt | 5 (31.25) | 1 (6.25) | |
| Inappropriate eating time | 0 (0.00) | 1 (6.25) | |
| Lack of appetite | 6 (37.50) | 4 (25.00) | |
| Feeling of fullness | 1 (6.25) | 3 (18.75) | |
| Others | 1 (6.25) | 2 (12.50) | |
| Meal satisfaction | |||
| Taste | 1 (6.25) | 4 (25.00) | |
| Seasoning | 3 (18.75) | 4 (25.00) | |
| Smell | 1 (6.25) | 0 (0.00) | |
| Appearance | 0 (0.00) | 0 (0.00) | |
| Portion size | 1 (6.25) | 3 (18.75) | |
| Softness of rice | 9 (56.25) | 3 (18.75) | |
| Temperature | 2 (12.50) | 2 (12.50) | |
| Nutrition | 1 (6.25) | 0 (0.00) | |
| Overall meal satisfaction (of 100) | 48.1 ± 15.0 | 80.6 ± 12.4 | 0.0324 |
Table 4.Health-related quality of life
| Characteristics | SFD (n = 16) | SBD (n = 16) | P-value1) |
|---|---|---|---|
| EQ-VAS | 58.75 | 70.31 | 0.0296 |
| EQ-5D-3L | |||
| Physical ability | 2.8 ± 1.2 | 1.0 ± 0.2 | < 0.0001 |
| Self-management | 2.3 ± 1.2 | 1.5 ± 0.7 | 0.0795 |
| Daily activities | 2.7 ± 1.0 | 1.9 ± 0.8 | 0.0494 |
| Pain, discomfort | 2.4 ± 0.9 | 2.2 ± 0.6 | 0.7519 |
| Anxiety, depression | 2.0 ± 1.0 | 1.1 ± 0.4 | 0.0044 |
Table 5.Anthropometric measurement
| Variables |
SFD (n = 16) |
SBD (n = 16) |
Total |
Post-Pre |
||||||||
|---|---|---|---|---|---|---|---|---|---|---|---|---|
| Pre | Post | P-value1) | Pre | Post | P-value1) | Pre | Post | P-value1) | SFD | SBD | P-value2) | |
| Weight (kg) | 61.8 ± 12.5 | 60.9 ± 12.4 | 0.0207 | 63.7 ± 10.1 | 64.2 ± 10.4 | 0.0123 | 62.7 ± 11.6 | 62.5 ± 11.7 | 0.6805 | −1.0 ± 1.5 | 0.6 ± 0.8 | 0.0041 |
| BMI (kg/m2) | 22.7 ± 3.6 | 22.4 ± 3.7 | 0.0182 | 23.3 ± 2.9 | 23.5 ± 3.1 | 0.1876 | 23.0 ± 3.3 | 22.9 ± 3.5 | 0.3082 | −0.3 ± 0.5 | 0.2 ± 0.4 | 0.0058 |
Table 6.Laboratory test
| Variables |
SFD (n = 16) |
SBD (n = 16) |
Post-Pre |
||||||
|---|---|---|---|---|---|---|---|---|---|
| Pre | Post | P-value1) | Pre | Post | P-value1) | SFD | SBD | P-value2) | |
| Albumin | 4.5 ± 0.3 | 4.0 ± 0.3 | 0.0002 | 4.5 ± 0.3 | 4.3 ± 0.3 | 0.0084 | −0.5 ± 0.3 | −0.3 ± 0.3 | 0.0465 |
| TLC | 3,013.1 ± 763.2 | 1,499.4 ± 674.5 | 0.0002 | 3,650.0 ± 947.5 | 2,834.4 ± 1,035.1 | 0.0136 | −1,513.8 ± 967.5 | −815.6 ± 1,175.2 | 0.0426 |
| Hgb | 13.8 ± 1.9 | 13.3 ± 1.6 | 0.0721 | 13.6 ± 1.3 | 13.4 ± 1.3 | 0.2156 | −0.4 ± 0.8 | −0.2 ± 0.8 | 0.5699 |
| Hct | 41.0 ± 5.2 | 39.9 ± 4.8 | 0.0854 | 41.1 ± 3.6 | 38.5 ± 7.4 | 0.1708 | −1.1 ± 2.6 | −2.6 ± 8.2 | 0.9926 |
| ANC | 3,746.1 ± 1,313.2 | 8,518.4 ± 3,741.5 | 0.0004 | 3,835.8 ± 1,781.4 | 7,564.0 ± 2,731.4 | < 0.0001 | 4,772.3 ± 3,478.3 | 3,728.2 ± 2,866.9 | 0.3045 |
| NRI | 109.3 ± 4.9 | 102.2 ± 4.2 | 0.0002 | 111.0 ± 4.2 | 107.1 ± 4.8 | 0.0088 | −7.1 ± 5.0 | −3.9 ± 5.3 | 0.0465 |
| PNI | 60.0 ± 6.0 | 47.7 ± 4.2 | < 0.0001 | 63.6 ± 5.4 | 57.0 ± 5.1 | 0.0013 | −12.3 ± 7.0 | −6.6 ± 5.9 | 0.0318 |
| hs-CRP | 0.4 ± 0.5 | 0.9 ± 1.4 | 0.3715 | 0.1 ± 0.1 | 0.4 ± 0.4 | 0.0055 | 0.8 ± 1.44 | 0.3 ± 0.3 | 0.5027 |
Mean ± SD.
SFD, soft fluid diet; SBD, soft blend diet; TLC, total lymphocyte count (cells/mm3); Hgb, hemoglobin (g/dL); Hct, hematocrit (%); ANC, absolute neutrophil count (cells/μL); NRI, nutritional risk index; PNI, prognostic nutritional index; hs-CRP, high-sensitivity C-reactive protein.
1)P-value was determined by paired nonparametric t-test.
2)P-value was determined by Mann-Whitney U test.
Table 7.Clinical follow-up result
- 1. Giridhar VU. Role of nutrition in oral and maxillofacial surgery patients. Natl J Maxillofac Surg 2016; 7(1): 3-9.ArticlePubMedPMC
- 2. Hébuterne X, Lemarié E, Michallet M, de Montreuil CB, Schneider SM, Goldwasser F. Prevalence of malnutrition and current use of nutrition support in patients with cancer. JPEN J Parenter Enteral Nutr 2014; 38(2): 196-204.ArticlePubMedPDF
- 3. Mahat AK, Panta N, Shrewastwa MK, Puri R, Basnet LB. Short and long term impact on oral health related quality of life after maxillofacial trauma. J Nepal Health Res Counc 2023; 21(1): 76-80.ArticlePubMed
- 4. Soh CL, Tan PG, Mohd Nor N. Oral health related quality of life after treatment in maxillofacial trauma patients. J Oral Maxillofac Surg Med Pathol 2021; 33(3): 267-271.Article
- 5. Qian SJ, Liu B, Shi J, Zhang X, Deng K, Shen J, et al. Effects of dental implants and nutrition on elderly edentulous subjects: protocol for a factorial randomized clinical trial. Front Nutr 2022; 9: 930023.ArticlePubMedPMC
- 6. Beluci ML, de Barros SP, Borgo HC, Fontes CM, Arena EP. Postsurgical alveolar bone graft patients: elaboration and application of a data-gathering instrument for nutrition and nursing. Cleft Palate Craniofac J 2014; 51(2): 172-177.ArticlePubMedPDF
- 7. Obayemi A Jr, Tatum SA. Enhanced Recovery after Surgery (ERAS) protocols in craniomaxillofacial surgery: an evidence-based review. Curr Opin Otolaryngol Head Neck Surg 2022; 30(4): 265-269.ArticlePubMed
- 8. Ludwig DC, Huang K, Lynch S, Koceja L, Tressel W, Dillon JK. What is the role of nutrition counseling in the management of isolated mandible fractures? Oral Surg Oral Med Oral Pathol Oral Radiol 2019; 128(5): 464-471.ArticlePubMedPMC
- 9. Kehlet H. ERAS implementation-time to move forward. Ann Surg 2018; 267(6): 998-999.ArticlePubMed
- 10. Cziperle DJ, Avitene TM. Avitene™ microfibrillar collagen hemostat for adjunctive hemostasis in surgical procedures: a systematic literature review. Med Devices (Auckl) 2021; 14: 155-163.ArticlePubMedPMCPDF
- 11. Hush SE, Chen JT, Brady CM, Soldanska M, Nusz DJ, Rhinehart DL, et al. Implementation of a modified enhanced recovery protocol in cleft palate repairs. J Craniofac Surg 2019; 30(7): 2154-2158.ArticlePubMed
- 12. Deo PN, Deshmukh R. Oral microbiome: unveiling the fundamentals. J Oral Maxillofac Pathol 2019; 23(1): 122-128.ArticlePubMedPMC
- 13. Mioton LM, Jordan SW, Hanwright PJ, Bilimoria KY, Kim JY. The relationship between preoperative wound classification and postoperative infection: a multi-institutional analysis of 15,289 patients. Arch Plast Surg 2013; 40(5): 522-529.ArticlePubMedPMC
- 14. McCaffrey N, Kaambwa B, Currow DC, Ratcliffe J. Health-related quality of life measured using the EQ-5D-5L: South Australian population norms. Health Qual Life Outcomes 2016; 14(1): 133.ArticlePubMedPMCPDF
- 15. Feng Y, Parkin D, Devlin NJ. Assessing the performance of the EQ-VAS in the NHS PROMs programme. Qual Life Res 2014; 23(3): 977-989.ArticlePubMedPMCPDF
- 16. Buzby GP, Mullen JL, Matthews DC, Hobbs CL, Rosato EF. Prognostic nutritional index in gastrointestinal surgery. Am J Surg 1980; 139(1): 160-167.ArticlePubMed
- 17. Hua X, Long ZQ, Huang X, Deng JP, He ZY, Guo L, et al. The value of prognostic nutritional index (PNI) in predicting survival and guiding radiotherapy of patients with T1-2N1 breast cancer. Front Oncol 2020; 9: 1562.ArticlePubMedPMC
- 18. Heys SD, Walker LG, Eremin O. The value of peri-operative nutrition in the sick patient. Proc Nutr Soc 1997; 56: 443-457.ArticlePubMed
- 19. Sánchez-Ayala A, Lagravère MO, Gonçalves TM, Lucena SC, Barbosa CM. Nutritional effects of implant therapy in edentulous patients--a systematic review. Implant Dent 2010; 19(3): 196-207.ArticlePubMed
- 20. Kyle UG, Genton L, Pichard C. Hospital length of stay and nutritional status. Curr Opin Clin Nutr Metab Care 2005; 8(4): 397-402.ArticlePubMed
- 21. Schneider J, Peterli R, Gass M, Slawik M, Peters T, Wölnerhanssen BK. Laparoscopic sleeve gastrectomy and Roux-en-Y gastric bypass lead to equal changes in body composition and energy metabolism 17 months postoperatively: a prospective randomized trial. Surg Obes Relat Dis 2016; 12(3): 563-570.ArticlePubMed
- 22. Kuvat SV, Güven E, Hocaoğlu E, Başaran K, Marşan G, Cura N, et al. Body fat composition and weight changes after double-jaw osteotomy. J Craniofac Surg 2010; 21(5): 1516-1518.ArticlePubMed
- 23. Vellas B, Guigoz Y, Garry PJ, Nourhashemi F, Bennahum D, Lauque S, et al. The Mini Nutritional Assessment (MNA) and its use in grading the nutritional state of elderly patients. Nutrition 1999; 15(2): 116-122.ArticlePubMed
- 24. Hannan JL, Radwany SM, Albanese T. In-hospital mortality in patients older than 60 years with very low albumin levels. J Pain Symptom Manage 2012; 43(3): 631-637.ArticlePubMed
- 25. Friedman AN, Fadem SZ. Reassessment of albumin as a nutritional marker in kidney disease. J Am Soc Nephrol 2010; 21(2): 223-230.ArticlePubMed
- 26. Galata C, Busse L, Birgin E, Weiß C, Hardt J, Reißfelder C, et al. Role of albumin as a nutritional and prognostic marker in elective intestinal surgery. Can J Gastroenterol Hepatol 2020; 2020: 7028216.ArticlePubMedPMCPDF
- 27. Cabrerizo S, Cuadras D, Gomez-Busto F, Artaza-Artabe I, Marín-Ciancas F, Malafarina V. Serum albumin and health in older people: review and meta analysis. Maturitas 2015; 81(1): 17-27.ArticlePubMed
- 28. Okadome K, Baba Y, Yagi T, Kiyozumi Y, Ishimoto T, Iwatsuki M, et al. Prognostic nutritional index, tumor-infiltrating lymphocytes, and prognosis in patients with esophageal cancer. Ann Surg 2020; 271(4): 693-700.ArticlePubMed
- 29. Safak O, Yildirim T, Emren V, Avci E, Argan O, Aktas Z, et al. Prognostic nutritional index as a predictor of no-reflow occurrence in patients with ST-segment elevation myocardial infarction who underwent primary percutaneous coronary intervention. Angiology 2023; 33197231193223.ArticlePubMedPDF
REFERENCES
Figure & Data
REFERENCES
Citations
Citations to this article as recorded by 
- Comparative Evaluation of Effect of Therapeutic Nutrition on Serum Albumin Levels and Nutritional Indices in Patients Undergoing Open Reduction and Internal Fixation for Maxillofacial Fractures – A Prospective Clinical Trial
B. R. Rajanikanth, Amruta T. Achar, Kavitha Prasad, Hema Arvind
Journal of Maxillofacial and Oral Surgery.2025; 24(1): 110. CrossRef - Nutritional management for breast cancer patients
Minjeong Kim, Minkyoung Lee, Jisun Sa
The Ewha Medical Journal.2025;[Epub] CrossRef - A Holistic Approach to Postendodontic Pain Management: A Narrative Review
Hmoud A. Algarni
Journal of Pharmacy and Bioallied Sciences.2024; 16(Suppl 5): S4262. CrossRef
 Cite
CiteImpact of postoperative dietary types on nutrition and treatment prognosis in hospitalized patients undergoing oral and maxillofacial surgery: a comparative study
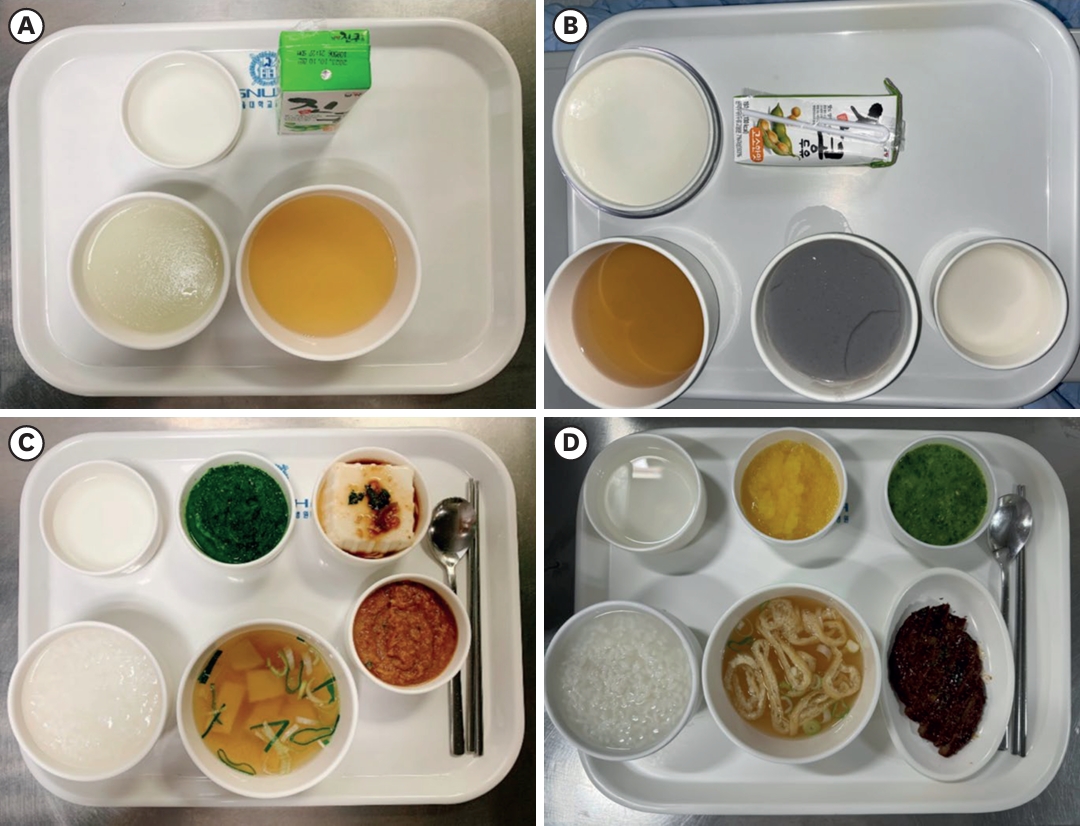


Fig. 1. (A, B) Soft fluid diet. (C, D) Soft blend diet.
Fig. 2. The course of studies.ASA, American Society of Anesthesiologists; SFD, soft fluid diet; SBD, soft blend diet; BMI, body mass index.
Fig. 3. (A) Overall meal satisfaction. (B) EQ-VAS.SFD, soft fluid diet; SBD, soft blend diet; EQ-VAS, EuroQoL Visual Analogue Scale.
Fig. 1.
Fig. 2.
Fig. 3.
Impact of postoperative dietary types on nutrition and treatment prognosis in hospitalized patients undergoing oral and maxillofacial surgery: a comparative study
| Type of diets | Breakfast | Energy | Lunch | Energy | Dinner | Energy | |
|---|---|---|---|---|---|---|---|
| SFD | |||||||
| Grain | Rice gruel (300 g) | 57 kcal (Carb 14.1 g, Protein 1 g) | Rice gruel (300 g) | 57 kcal (Carb 14.1 g, Protein 1 g) | Rice gruel (300 g) | 57 kcal (Carb 14.1 g, Protein 1 g) | |
| Soup | 150 cc (without ingredients) | 0 kcal | 150 cc (without ingredients) | 0 kcal | 150 cc (without ingredients) | 0 kcal | |
| Fish and meat | - | - | - | ||||
| Vegetable | - | - | - | ||||
| Water Kimchi | 100 cc (without ingredients) | 10 kcal | 100 cc (without ingredients) | 10 kcal | 100 cc (without ingredients) | 10 kcal | |
| Beverage | Nucare© | 200 kcal (Carb 30 g, Protein 7 g, Fat 6 g) | Soy milk | 130 kcal (Carb 15 g, Protein 6 g, Fat 5 g) | Soy milk | 130 kcal (Carb 15 g, Protein 6 g, Fat 5 g) | |
| Total energy | 267 kcal (Carb 44.1 g, Protein 8 g, Fat 6 g) | 197 kcal (Carb 29.1 g, Protein 7 g, Fat 5 g) | 197 kcal (Carb 29.1 g, Protein 7 g, Fat 5 g) | ||||
| SBD | |||||||
| Grain | Rice porridge (350 g) | 250 kcal (Carb 57.5 g, Protein 5 g) | Rice porridge (350 g) | 250 kcal (Carb 57.5 g, Protein 5 g) | Rice porridge (350 g) | 250 kcal (Carb 57.5 g, Protein 5 g) | |
| Soup | Water (150 cc) | 0 kcal | Low-salt soup 150 cc | 30 kcal (Carb 2.5 g, Protein 2.5 g, Fat 1 g) | Low-salt soup 150 cc | 30 kcal (Carb 2.5 g, Protein 2.5 g, Fat 1 g) | |
| Fish and meat | Low-salt protein dish | 130 kcal (Protein 21 g, Fat 5 g) | Low-salt protein dish | 130 kcal (Protein 21 g, Fat 5 g) | Low-salt protein dish | 130 kcal (Protein 21 g, Fat 5 g) | |
| Vegetable | Vegetable dish A | 68 kcal (Carb 10.5 g, Protein 7 g) | Vegetable dish A | 68 kcal (Carb 10.5 g, Protein 7 g) | Vegetable dish A | 68 kcal (Carb 10.5 g, Protein 7 g) | |
| Vegetable dish B | 38 kcal (Carb 6 g, Protein 4 g) | Vegetable dish B | 38 kcal (Carb 6 g, Protein 4 g) | Vegetable dish B | 38 kcal (Carb 6 g, Protein 4 g) | ||
| Water Kimchi | 100 cc | 18 kcal (Carb 3 g, Protein 1.4 g) | 100 cc | 18 kcal (Carb 3 g, Protein 1.4 g) | 100 cc | 18 kcal (Carb 3 g, Protein 1.4 g) | |
| Beverage | Milk | 125 kcal (Carb 10 g, Protein 6 g, Fat 7 g) | Fruit | 50 kcal (Carb 12 g) | - | ||
| Total energy | 629 kcal (Carb 87 g, Protein 44.4 g, Fat 12 g) | 584 kcal (Carb 91.5 g, Protein 40.9 g, Fat 6 g) | 534 kcal (Carb 79.5 g, Protein 40.9 g, Fat 6 g) | ||||
| Variables | Total (n = 32) | SFD group (n = 16) | SBD group (n = 16) | P-value |
|---|---|---|---|---|
| Sex | 0.937 | |||
| Male | 19 | 10 | 9 | |
| Female | 13 | 6 | 7 | |
| Age (years) | 49.0 ± 20.1 | 50.6 ± 19.2 | 47.5 ± 20.8 | 0.992 |
| 20–29 | 7 | 3 | 4 | |
| 30–39 | 5 | 2 | 3 | |
| 40–49 | 7 | 4 | 3 | |
| 50–59 | 1 | 1 | 0 | |
| ≥ 60 | 12 | 6 | 6 | |
| Hospital stay (days) | 3.6 ± 2.2 | 3.1 ± 1.2 | 4.2 ± 2.9 | 0.883 |
| 1–2 | 4 | 2 | 2 | |
| 3–4 | 24 | 13 | 11 | |
| ≥ 5 | 4 | 1 | 3 | |
| Maxillary teeth |
11.5 ± 1.9 | 11.7 ± 1.9 | 11.3 ± 1.7 | 0.533 |
| Mandibular teeth |
11.5 ± 1.8 | 11.3 ± 1.9 | 11.6 ± 1.8 | 0.553 |
| Characteristics | SFD (n = 16) | SBD (n = 16) | P-value |
|---|---|---|---|
| Post-operative appetite (of 5) | 2.4 | 2.9 | 0.0211 |
| Intakes of served amount (of 100%) | |||
| Rice gruel/Rice porridge | 69.3% | 75.9% | |
| Side dishes | 40.0% | 52.1% | |
| Soup | 42.6% | 61.5% | |
| Total | 51.0% | 63.2% | |
| The reasons for left-over | |||
| Dissatisfaction with taste | 4 (25.00) | 4 (25.00) | |
| Concerns of sanitation | 0 (0.00) | 0 (0.00) | |
| Provided too much | 2 (12.50) | 1 (6.25) | |
| Insufficient salt | 5 (31.25) | 1 (6.25) | |
| Inappropriate eating time | 0 (0.00) | 1 (6.25) | |
| Lack of appetite | 6 (37.50) | 4 (25.00) | |
| Feeling of fullness | 1 (6.25) | 3 (18.75) | |
| Others | 1 (6.25) | 2 (12.50) | |
| Meal satisfaction | |||
| Taste | 1 (6.25) | 4 (25.00) | |
| Seasoning | 3 (18.75) | 4 (25.00) | |
| Smell | 1 (6.25) | 0 (0.00) | |
| Appearance | 0 (0.00) | 0 (0.00) | |
| Portion size | 1 (6.25) | 3 (18.75) | |
| Softness of rice | 9 (56.25) | 3 (18.75) | |
| Temperature | 2 (12.50) | 2 (12.50) | |
| Nutrition | 1 (6.25) | 0 (0.00) | |
| Overall meal satisfaction (of 100) | 48.1 ± 15.0 | 80.6 ± 12.4 | 0.0324 |
| Characteristics | SFD (n = 16) | SBD (n = 16) | P-value |
|---|---|---|---|
| EQ-VAS | 58.75 | 70.31 | 0.0296 |
| EQ-5D-3L | |||
| Physical ability | 2.8 ± 1.2 | 1.0 ± 0.2 | < 0.0001 |
| Self-management | 2.3 ± 1.2 | 1.5 ± 0.7 | 0.0795 |
| Daily activities | 2.7 ± 1.0 | 1.9 ± 0.8 | 0.0494 |
| Pain, discomfort | 2.4 ± 0.9 | 2.2 ± 0.6 | 0.7519 |
| Anxiety, depression | 2.0 ± 1.0 | 1.1 ± 0.4 | 0.0044 |
| Variables | SFD (n = 16) |
SBD (n = 16) |
Total |
Post-Pre |
||||||||
|---|---|---|---|---|---|---|---|---|---|---|---|---|
| Pre | Post | P-value |
Pre | Post | P-value |
Pre | Post | P-value |
SFD | SBD | P-value |
|
| Weight (kg) | 61.8 ± 12.5 | 60.9 ± 12.4 | 0.0207 | 63.7 ± 10.1 | 64.2 ± 10.4 | 0.0123 | 62.7 ± 11.6 | 62.5 ± 11.7 | 0.6805 | −1.0 ± 1.5 | 0.6 ± 0.8 | 0.0041 |
| BMI (kg/m2) | 22.7 ± 3.6 | 22.4 ± 3.7 | 0.0182 | 23.3 ± 2.9 | 23.5 ± 3.1 | 0.1876 | 23.0 ± 3.3 | 22.9 ± 3.5 | 0.3082 | −0.3 ± 0.5 | 0.2 ± 0.4 | 0.0058 |
| Variables | SFD (n = 16) |
SBD (n = 16) |
Post-Pre |
||||||
|---|---|---|---|---|---|---|---|---|---|
| Pre | Post | P-value |
Pre | Post | P-value |
SFD | SBD | P-value |
|
| Albumin | 4.5 ± 0.3 | 4.0 ± 0.3 | 0.0002 | 4.5 ± 0.3 | 4.3 ± 0.3 | 0.0084 | −0.5 ± 0.3 | −0.3 ± 0.3 | 0.0465 |
| TLC | 3,013.1 ± 763.2 | 1,499.4 ± 674.5 | 0.0002 | 3,650.0 ± 947.5 | 2,834.4 ± 1,035.1 | 0.0136 | −1,513.8 ± 967.5 | −815.6 ± 1,175.2 | 0.0426 |
| Hgb | 13.8 ± 1.9 | 13.3 ± 1.6 | 0.0721 | 13.6 ± 1.3 | 13.4 ± 1.3 | 0.2156 | −0.4 ± 0.8 | −0.2 ± 0.8 | 0.5699 |
| Hct | 41.0 ± 5.2 | 39.9 ± 4.8 | 0.0854 | 41.1 ± 3.6 | 38.5 ± 7.4 | 0.1708 | −1.1 ± 2.6 | −2.6 ± 8.2 | 0.9926 |
| ANC | 3,746.1 ± 1,313.2 | 8,518.4 ± 3,741.5 | 0.0004 | 3,835.8 ± 1,781.4 | 7,564.0 ± 2,731.4 | < 0.0001 | 4,772.3 ± 3,478.3 | 3,728.2 ± 2,866.9 | 0.3045 |
| NRI | 109.3 ± 4.9 | 102.2 ± 4.2 | 0.0002 | 111.0 ± 4.2 | 107.1 ± 4.8 | 0.0088 | −7.1 ± 5.0 | −3.9 ± 5.3 | 0.0465 |
| PNI | 60.0 ± 6.0 | 47.7 ± 4.2 | < 0.0001 | 63.6 ± 5.4 | 57.0 ± 5.1 | 0.0013 | −12.3 ± 7.0 | −6.6 ± 5.9 | 0.0318 |
| hs-CRP | 0.4 ± 0.5 | 0.9 ± 1.4 | 0.3715 | 0.1 ± 0.1 | 0.4 ± 0.4 | 0.0055 | 0.8 ± 1.44 | 0.3 ± 0.3 | 0.5027 |
| Characteristics | SFD (n = 16) | SBD (n = 16) |
|---|---|---|
| Signs of infection | 5 (31.25) | 0 (0.00) |
| Positive recovery reported | 11 (68.75) | 16 (100.00) |
| Additional clinic visits | 2.4 | 0 |
| Reported symptoms | Lethargy, discomfort, pain | None |
Table 1. Dietary composition of the provided diet (SFD, SBD)
SFD, soft fluid diet; SBD, soft blend diet; Carb, carbohydrate.
Table 2. General characteristics of the participants
Mean ± SD. SFD, soft fluid diet; SBD, soft blend diet. The number of dental crowns, including prosthetics has been counted and reflected as teeth.
Table 3. The characteristics of dietary intake
n (%) or Mean ± SD. SFD, soft fluid diet; SBD, soft blend diet.
Table 4. Health-related quality of life
Mean ± SD. SFD, soft fluid diet; SBD, soft blend diet; EQ-VAS, EuroQoL Visual Analogue Scale; EQ-5D-3L, EuroQoL 5 Dimensions 3 Level.
Table 5. Anthropometric measurement
Mean ± SD. SFD, soft fluid diet; SBD, soft blend diet; BMI, body mass index.
Table 6. Laboratory test
Mean ± SD. SFD, soft fluid diet; SBD, soft blend diet; TLC, total lymphocyte count (cells/mm3); Hgb, hemoglobin (g/dL); Hct, hematocrit (%); ANC, absolute neutrophil count (cells/μL); NRI, nutritional risk index; PNI, prognostic nutritional index; hs-CRP, high-sensitivity C-reactive protein.
Table 7. Clinical follow-up result
n (%). SFD, soft fluid diet; SBD, soft blend diet.


