Articles
- Page Path
- HOME > Korean J Community Nutr > Volume 16(1); 2011 > Article
-
Original Article
- Nutritional Status and Eating Behavior of Lactating Women in Daejeon
- Jisun Kim, Myung Soon Park, Joung-Won Lee
-
Korean Journal of Community Nutrition 2011;16(1):37-50.
DOI: https://doi.org/10.5720/kjcn.2011.16.1.37
Published online: February 28, 2011
Departments of Consumers' Life Information, Chungnam National University, Daejeon, Korea.
1Department of Food and Nutrition, Chungnam National University, Daejeon, Korea.
- Corresponding author: Joung-Won Lee, Departments of Consumers' Life Information, Chungnam National University, 99 Dahak-ro, Yuseong-gu, Daejeon 305-764, Republic of Korea. Tel: (042) 821-6844, Fax: (042) 821-8887, leejw@cnu.ac.kr
Copyright © 2011 The Korean Society of Community Nutrition
- 1,054 Views
- 1 Download
- 4 Crossref
Figure & Data
REFERENCES
Citations

- A comparative study on nutritional knowledge and dietary behavior between Korean and Chinese postpartum women
Sohyun Kim, Heewon L Gray, Jia Li, Haeryun Park, Youngmi Lee, Kyunghee Song
Nutrition Research and Practice.2019; 13(6): 535. CrossRef - Nutrient Composition and Content of Vitamin and Mineral Supplements and Their Appropriateness for Pregnant and Lactating Women in Korea
Young-Hee Han, Jeong-Hyeon Seo, Gu-Rum Shin, Ju-Young Shin, Ye-Young Jo, Taisun Hyun
Korean Journal of Community Nutrition.2018; 23(4): 341. CrossRef - Development of Education Materials as a Card News Format for Nutrition Management of Pregnant and Lactating Women
Young-Hee Han, Jung Hyun Kim, Min Jun Lee, Taeksang Yoo, Taisun Hyun
Korean Journal of Community Nutrition.2017; 22(3): 248. CrossRef - The Association between Oxidative Stress and Metabolic Syndrome in Adults
So-Won Chung, Sung-Goo Kang, Jun-Seung Rho, Ha-Na Kim, In-Sun Song, Yun-Ah Lee, Soo-Jeong Heo, Sang-Wook Song
Korean Journal of Family Medicine.2013; 34(6): 420. CrossRef


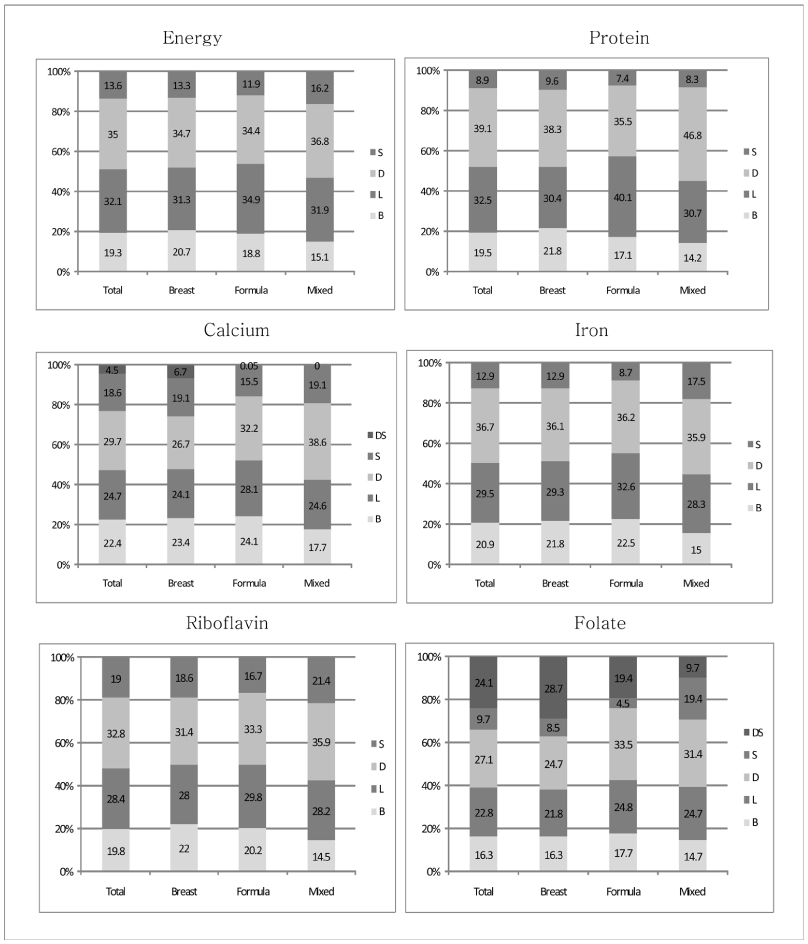
Fig. 1
Fig. 2
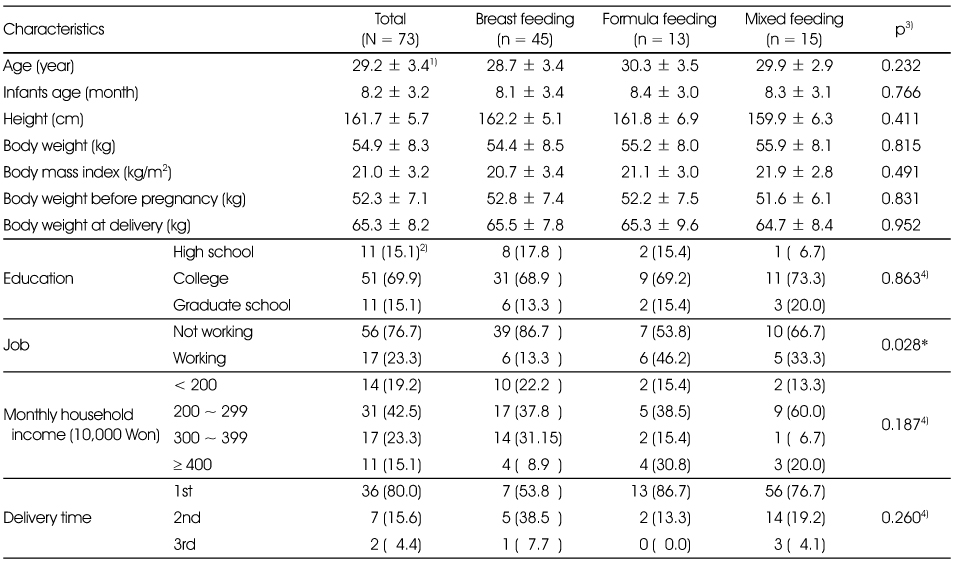
General characteristics of the subjects
1) Mean ± SD, 2) N (%), 3) by ANOVA and χ2-test *: p < 0.05, 4) Subject number of one cell and more was below 5 in the variable
Energy, protein and lipid intakes by milk feeding type
1) Mean ± SD, 2) Mean, 3) EER %, 4) AI %, 5) by ANOVA, *: p < 0.05, **: p < 0.01, ***: p < 0.001
abc: Values with different superscripts were significantly different at p < 0.05 by LSD
P/M/S = poly unsaturated fatty acid / mono unsaturated fatty acid / saturated fatty acid
Mineral and vitamin intakes by milk feeding type
1) Mean ± SD, 2) Mean, 3) Goal value %, 4) AI %, 5) by ANOVA, *: p < 0.05 **: p < 0.01 ***: p < 0.001
ab: Values with different superscripts were significantly different at p < .05 by LSD
Proportion of the subjects took nutrients less than EAR and unacceptable macronutrient distribution ranges
1) N (%), 2) by χ2 test, 3) All variables except 'Vitamin C' had one cell or more with the subject number below 5.
4) Acceptable macronutrient distribution ranges (carbohydrate : protein : lipid = 55 ~ 70 : 7 ~ 20 : 15 ~ 25)
Index of nutritional quality(INQ) by milk feeding type
1) Mean ± SD, 2) by ANOVA, *: p < 0.05 **: p < 0.01 ***: p < 0.001
ab: Values with different superscripts were significantly different at p < 0.05 by LSD
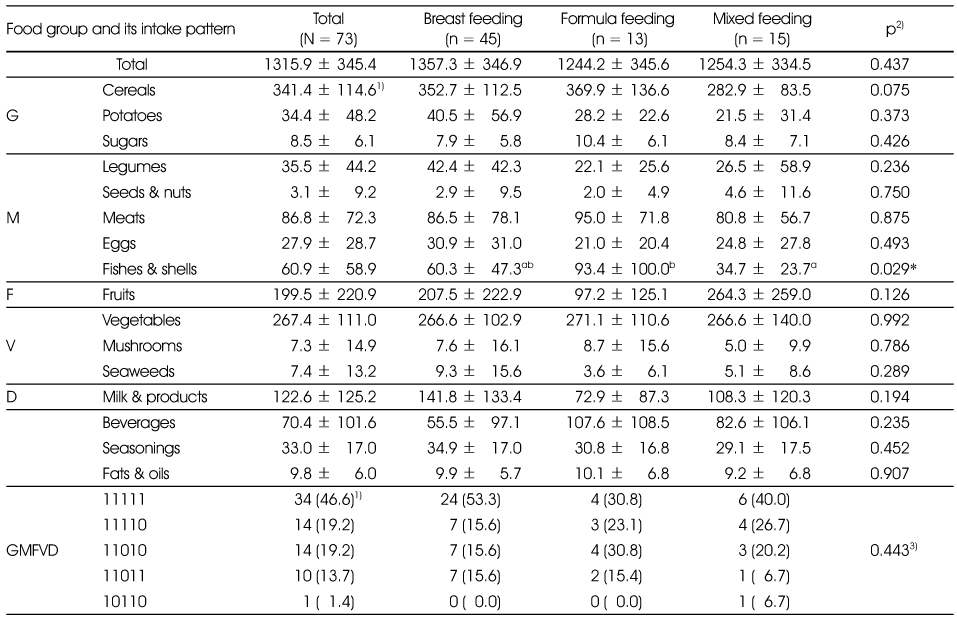
Food intakes and food group intake pattern by milk feeding type
1) Mean ± SD, 2) by ANOVA, *: p < 0.05
ab: Values with different superscripts were significantly different at p < 0.05 by LSD
3) Subject number of 10 cells were below 5
GMFVD: grain, meat, fruit, vegetable, dairy product
Dietary behavior and weight reducing trial by feeding type
1) N (%), 2) χ2 test, 3) Among subjects who did weight control trial to reduce weight
4) Subject number of one cell or more was below 5 in the variable
Comparison of food group intakes and its patterns between the subjects with MAR < 0.72 and those with MAR ≥ 0.831)
1) MAR ≥ 0.83: 100th~68th percentile, MAR < 0.72: 33th~0th percentile, 2) Mean ± SD, 3) by t-test
GMFVD: grain, meat, fruit, vegetable, dairy product, *: p < 0.05, **: p < 0.01, ***: p < 0.001
4) Subject number of 5 cells were below 5
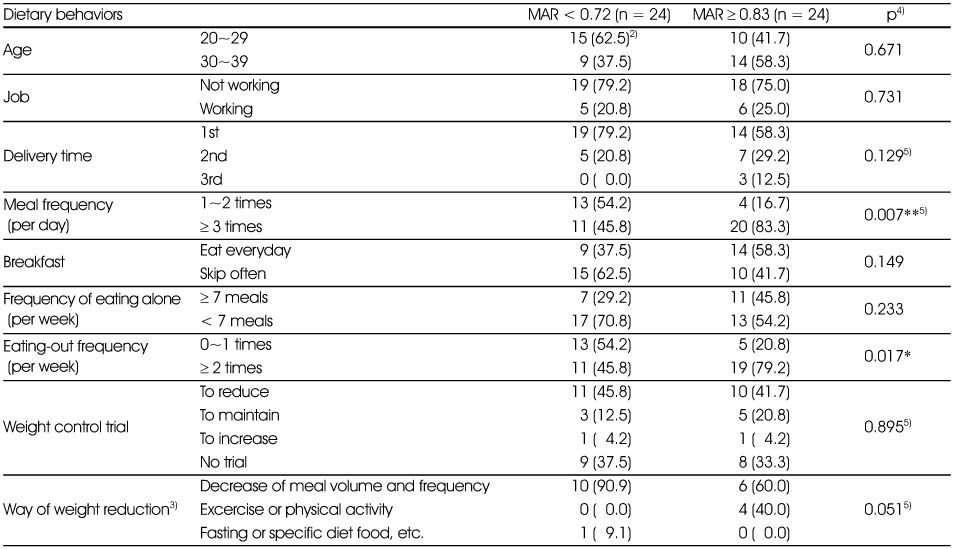
Comparison of dietary behaviors between the subjects with MAR < 0.72 and those with MAR ≥ 0.831)
1) MAR ≥ 0.83: 100th~68th percentile, MAR < 0.72: 33th~0th percentile
2) N (%), 3) Among subjects who did weight control trial to reduce weight
4) χ2 test, *: p < 0.05, **: p < 0.01, 5) Subject number of one cell or more was below 5 in the variable
1) Mean ± SD, 2) N (%), 3) by ANOVA and χ2-test *: p < 0.05, 4) Subject number of one cell and more was below 5 in the variable
1) Mean ± SD, 2) Mean, 3) EER %, 4) AI %, 5) by ANOVA, *: p < 0.05, **: p < 0.01, ***: p < 0.001 abc: Values with different superscripts were significantly different at p < 0.05 by LSD P/M/S = poly unsaturated fatty acid / mono unsaturated fatty acid / saturated fatty acid
1) Mean ± SD, 2) Mean, 3) Goal value %, 4) AI %, 5) by ANOVA, *: p < 0.05 **: p < 0.01 ***: p < 0.001 ab: Values with different superscripts were significantly different at p < .05 by LSD
1) N (%), 2) by χ2 test, 3) All variables except 'Vitamin C' had one cell or more with the subject number below 5. 4) Acceptable macronutrient distribution ranges (carbohydrate : protein : lipid = 55 ~ 70 : 7 ~ 20 : 15 ~ 25)
1) Mean ± SD, 2) by ANOVA, *: p < 0.05 **: p < 0.01 ***: p < 0.001 ab: Values with different superscripts were significantly different at p < 0.05 by LSD
1) Mean ± SD, 2) by ANOVA, *: p < 0.05 ab: Values with different superscripts were significantly different at p < 0.05 by LSD 3) Subject number of 10 cells were below 5 GMFVD: grain, meat, fruit, vegetable, dairy product
1) N (%), 2) χ2 test, 3) Among subjects who did weight control trial to reduce weight 4) Subject number of one cell or more was below 5 in the variable
1) MAR ≥ 0.83: 100th~68th percentile, MAR < 0.72: 33th~0th percentile, 2) Mean ± SD, 3) by t-test GMFVD: grain, meat, fruit, vegetable, dairy product, *: p < 0.05, **: p < 0.01, ***: p < 0.001 4) Subject number of 5 cells were below 5
1) MAR ≥ 0.83: 100th~68th percentile, MAR < 0.72: 33th~0th percentile 2) N (%), 3) Among subjects who did weight control trial to reduce weight 4) χ2 test, *: p < 0.05, **: p < 0.01, 5) Subject number of one cell or more was below 5 in the variable

 KSCN
KSCN


 Cite
Cite


