
Articles
- Page Path
- HOME > Korean J Community Nutr > Volume 17(1); 2012 > Article
-
Original Article
- A Study of Nutrient Intakes, Blood Lipids and Bone Mineral Density according to Obesity Degree by Percentage of Body Fat and Age between Male and Female Teacher in Jeonbuk Province, Korea
- Hye-Soon Chang
-
Korean Journal of Community Nutrition 2012;17(1):49-68.
DOI: https://doi.org/10.5720/kjcn.2012.17.1.49
Published online: February 29, 2012
Department of Food and Nutrition, Gunsan National University, Gunsan, Korea.
- Corresponding author: Department of Food & Nutrition, Gunsan National University, San 68 Miryong-dong, Gunsan 573-701, Korea. Tel: (063) 469-4633, Fax: (063) 468-2085, hschang@kunsan.ac.kr
• Received: September 22, 2011 • Revised: January 16, 2012 • Accepted: February 7, 2012
Copyright © 2012 The Korean Society of Community Nutrition
- 1,827 Views
- 11 Download
- 4 Crossref
Abstract
- The purpose of this study was to compare nutrient intakes, blood lipids and bone mineral density of male (n = 59) and female (n = 172) teachers according to the obesity index by percentage of body fat and age. The energy intakes of obesity group were higher than normal group in male (p < 0.05), but were not significant in female. The protein intake ratio among three energy nutrients for male was higher than female (p < 0.001), and lipid intake ratio of obesity group in female was a little higher than male that was not significant. TC, LDL, TC/HDL, risk of coronary heart disease, blood glucose and blood pressure of obesity group were higher than normal group in female (p < 0.01 ~ p < 0.001), but were little significance in male. Risk of coronary heart disease was affected by gender (p < 0.001), obesity degree (p < 0.01), age (p < 0.001), and interaction of gender and age (p < 0.001). Blood glucose was affected by obesity degree (p < 0.05), but was not affected by age. T-scores of forearm for female (= -1.42) were lower than that of male (= -0.95), and T-scores of obesity group in male (= 0.12) were higher than that of normal group (= -0.33) but were not significant in female. The T-scores of forearm for female were affected by age (p < 0.05) and gender (p < 0.01), but calcaneus was not affected by gender. These results suggest lipid intake ratio should be balanced for obesity group in female. Nutritional education for treatment obesity to prevent hyperlipidemia and arteriosclerosis is necessary for obesity group and older age groups. T-scores of forearm were lower than calcaneus, so arm exercise would be especially required to prevent osteoporosis for older age women groups.
- 1. Albala C, Yanez M, Devoto E, Sostin C, Zeballos L, Santos JL. Obesity as a protective factor for postmenopausal osteoporosis. Int J Obes Relat Metab Disord. 1996; 20: 1027-1032.PubMed
- 2. Biospace. Examination of body composition. Diagnosis and measure of obesity. 2004; Seoul: Biospace.
- 3. Chang HS. Nutrient intakes and blood lipids according to obesity degree by body fat percentage among middle-aged women in Gunsan city. Korean J Community Nutr. 2010; 15(1): 15-26.
- 4. Cho SH. The relationship between bone mineral density and body composition variables measured by DEXA in postmenopausal women. J Korean Acad Fam Med. 2005; 26: 158-166.
- 5. Choi MJ. Relations of life style, nutrient intake and blood lipids in middle-aged men with borderline hyperlipidemia. Korean J Community Nutr. 2005; 10(3): 281-289.
- 6. Choi MK, Jun YS. Comparative study of energy intake, blood pressure, and serum lipids by body mass index in Korean adults. J Korean Diet Assoc. 2007; 13(1): 30-37.
- 7. Choi YJ, Joh HK, Oh SW, Lym YL, Choi JK, Do HJ. Association between bone mineral density and obesity, waist circumference in premenopausal and postmenopausal women. Korean J Health Promot Dis Prev. 2007; 7: 187-195.
- 8. Hsu YH, Venners SA, Terwedow HA, Feng Y, Niu T, Li Z. Relation of body composition, fat mass, and serum lipids to osteoporotic fractures and bone mineral density in Chinese men and women. Am J Clin Nutr. 2006; 83: 146-154.ArticlePubMed
- 9. Hwangbo JH, Son YA, Shin SR, Yoon KS, Kim KS. Studies on the food & daily habits and lipid concentrations in serum of adult man. Food Ind Nutr. 2002; 7(2): 45-50.
- 10. Hyun WJ. The relationship between obesity, lifestyle, and dietary intake and serum lipid level in male university students. Korean J Community Nutr. 2001; 6(2): 162-171.
- 11. Jung YS, Choi MK. Studies of nutrient intake, life style, and serum lipids level in middle-aged men in Taegu. Korean J Nutr. 1997; 30(3): 277-285.
- 12. Jun YS, Choi MK, Bae YJ, Sung CJ. Effect of meals variety on obesity index, blood pressure, and lipid profiles of Korean adults. Korean J Food Cult. 2006; 21(2): 216-224.
- 13. Kim KJ, Lee WJ, Lee SJ, Ahn NY, Oh HR, Shin YJ, Park JS, Hong CB, Kim SH, Kim EM, Lee JU, Kim EJ, Jang JS. Health status and lifestyle including diet, exercise, and daily activities in obese adults. Korean J Sports Med. 2005a; 23(1): 54-63.
- 14. Kim KJ, Shin YJ. Analysis of indicators for the evaluation of obesity and body fat distribution in adult men. J Korea Sport Res. 2003; 14(5): 1529-1540.
- 15. Kim MS, Koo JO. Analysis of factors affecting bone mineral density with different age among adult women in Seoul area. Korean J Community Nutr. 2007; 12(5): 559-568.
- 16. Kim MS, Koo JO. Comparative analysis of food habits and bone density risk factors between normal and risk women living in Seoul area. Korean J Community Nutr. 2008; 13(1): 125-133.
- 17. Kim OH, Jung HN, Kim JH. Comparison of food intakes and serum lipid levels in overweight and obese women by Body Mass Index. Korean J Community Nutr. 2007; 12(1): 40-49.
- 18. Kim SH, Kim JH, Lee CH. An effect of difference in %body fat on cardiovascular system upon incremental treadmill exercise testing. Korean J Phys Educ. 2003; 42(3): 571-580.
- 19. Kim SY, Sohn CM, Chung WY. Effect of medical nutrition therapy on food habits and serum lipid level ofhypercholesterolemic patients. J Korean Diet Assoc. 2005b; 11(1): 125-132.
- 20. Korea Health Statistics 2009-. Korea National Health & Nutritional Examination Survey. 2010; cited 2011. Aug. 15. Available from http://www.knhanes.cdc.go.kr.
- 21. In-Depth Analysis on the 3rd(2005) Korea Health and Nutrition Examination Survey -Medical examination part -. Korea National Health & Nutritional Examination Survey. 2007a; cited 2011. Aug. 15. Available from http://www.knhanes.cdc.go.kr.
- 22. In-Depth Analysis on the 3rd (2005) Korea Health and Nutrition Examination Survey -Nutrition Survey -. Korea National Health & Nutritional Examination Survey. 2007b; cited 2011. Aug. 15. Available from http://www.knhanes.cdc.go.kr.
- 23. Ko SK. The effect of BMI and %Fat as an obesity index on the diagnosis of lipoprotein in adult men. Exerc Sci. 2005; 14(1): 21-30.
- 24. Kwon HT, Park JH, Lee CM, Shin CS. Relationship between bone mineral density and abdominal obesity according to BMI in postmenopausal women. Korean J Health Promot Dis Prev. 2008; 8(2): 102-107.
- 25. Lee HS, Kwon IS, Kwon CS. Prevalence of hypertension and related risk factors of the older residents on Andong rural area. J Korean Soc Food Sci Nutr. 2009; 38(7): 852-861.
- 26. Lee HS, Park MY, Kim GE, Cheong HS, Kim SH. A study on the serum lipid, apolipoprotein levels and their correlations in healthy adults of Gyeongnam area. Korean J Nutr. 2007; 40(6): 526-530.
- 27. Lee JS, Yu CH. Some factors affecting bone mineral density of Korean rural women. Korean J Nutr. 1999; 32(8): 935-945.
- 28. Lee JY, Chung SC, Cha YJ, Kwon HS, Lee SJ, Sohn IS, Kim SN. Difference in the relative contribution of body composition analysis to bone mineral density with generation in Korean women. J Korean Soc Menopause. 2005; 11(3): 213-218.
- 29. Lee RD, Nieman DC. Nutritional assessment. 1996; 2nd ed. St. Louis: Mosby.
- 30. Lohman TG. Advance in body composition assessment, current issues in exercise science series. 1992; Champaign, IL: Human Kinetic Publishers.
- 31. Moon HK, Kim EG. Comparing validity of using body mass index, waist to hip ratio, and waist circumference to cardiovascular risk factors of middle aged Koreans. J Korean Diet Assoc. 2005; 11(3): 365-374.
- 32. Moon JH, Lee JK, Lee OH, Lee SY, Kim YJ. The association between indicators of central obesity and bone mineral density in women. J Korean Acad Fam Med. 2001; 22: 192-199.
- 33. Na HB. Factors affecting bone mineral density in Korean women by menopause. Korean J Community Nutr. 2004; 9(1): 73-80.
- 34. Nam KH, Shin MS, Yoo JH, Bae JJ, Lee SH, Kim SS, Hong YS, Byun JJ, Park HK. The effect of exercise program during 16 weeks on leptin, HbA1c, BMI and body composition in middle aged men with obesity and NIDDM. J Sport Leis Stud. 2003; 20: 1115-1126.
- 35. Schmitt SB, Wasserman AG, Muesing RA, Schlesselman SE, Larosa JC, Ross AM. Lipoprotein and apolipoprotein levels in angiographically defined coronary atherosclerosis. Am J Cardiol. 1985; 55(13 Pt 1): 1459-1462.ArticlePubMed
- 36. Sizer FS, Whitney EN. Nutrition - Concepts and controversies-. 2000; 8th ed. USA: Wadsworth; 2-4.
- 37. Smalley KJ, Knerr AN, Kendrick ZV, Colliver JA, Owen OE. Reassessment of body mass indices. Am J Clin Nutr. 1990; 52: 405-408.ArticlePubMed
- 38. Solomon CG, Manson JE. Obesity and mortality: a review of the epidemiologic data. Am J Clin Nutr. 1997; 66: 4 suppl. 1044S-1050S.ArticlePubMed
- 39. The results statistical death and cause of death. Statistics Korea. 2010; cited 2011. Aug. 15. Available from http://www.kostat.go.kr.
- 40. Suh JM, Cho SB. Blood lipid profiles following to abdominal fat in middle-aged men. J Korea Sport Res. 2004; 15(3): 1596-1604.
- 41. The Korean Nutrition Society. Ministry of Health & welfare. Korea Food & Drug Administration. Dietary reference intakes for Korean (KDRIs). 2010; Seoul: The Korean Nutrition Society; 579-583.
- 42. Wang J, Thornton JC, Russell M, Burastero S, Heymsfields . Asians have lower percent body fat than whites : Comparisons of anthropometric measurements. Am J Clin Nutr. 1994; 60: 23-28.PubMed
- 43. Yoo HS, Park SH, Byun JC. Effects of aerobic exercise training on inflammatory markers and t-PA and cholesterol levels in obese men. Korean J Phys Educ. 2005; 44(4): 325-335.
- 44. Zhao LJ, Liu YJ, Liu PY, Hamilton J, Recker RR, Deng HW. Relationship of obesity with osteoporosis. J Clin Endocrinol Metab. 2007; 92: 1640-1646.ArticlePubMedPMC
REFERENCES
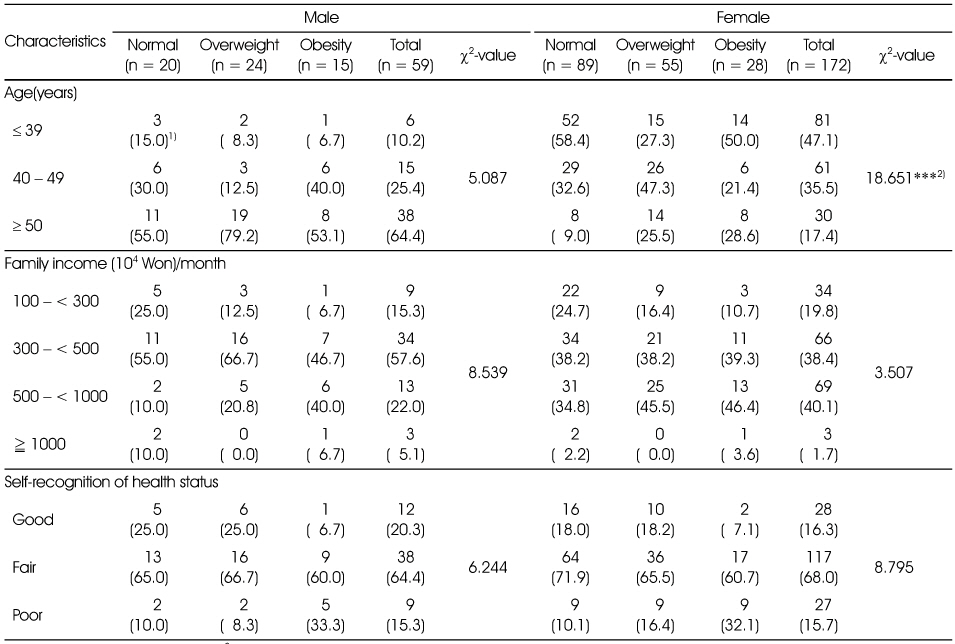
Table 2Comparisons of anthropometric measurements and body composition of the subjects according to obesity degree by %fat
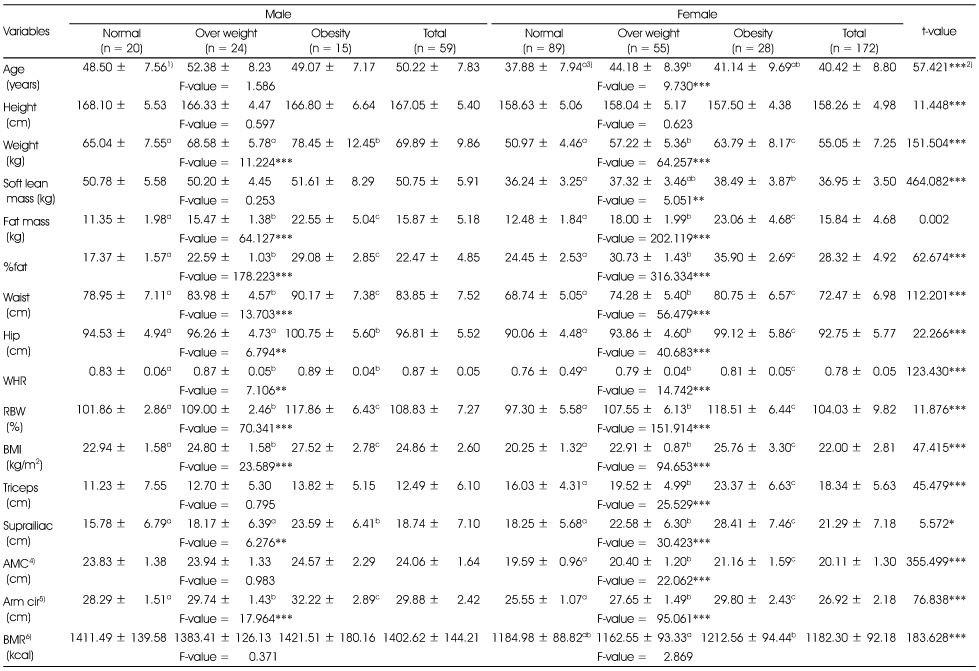
Table 3The daily caloric nutrients and cholesterol intakes, and CPF ratio of subjects according to obesity degree by %fat
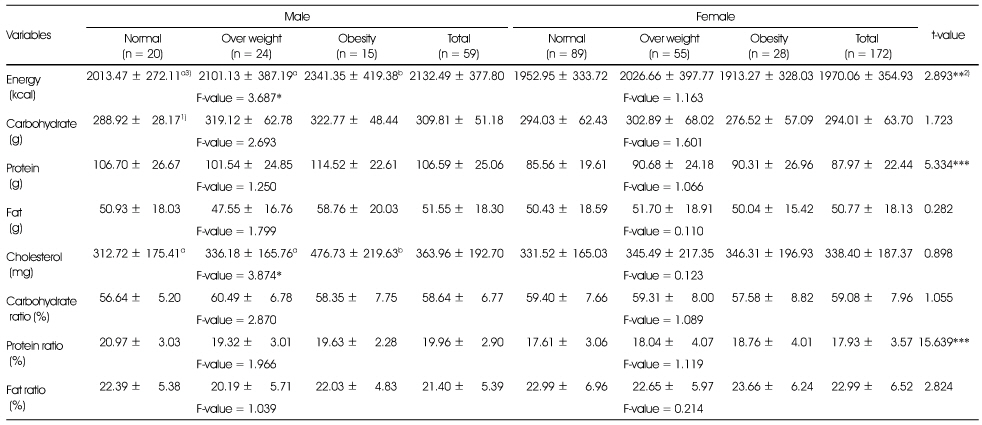
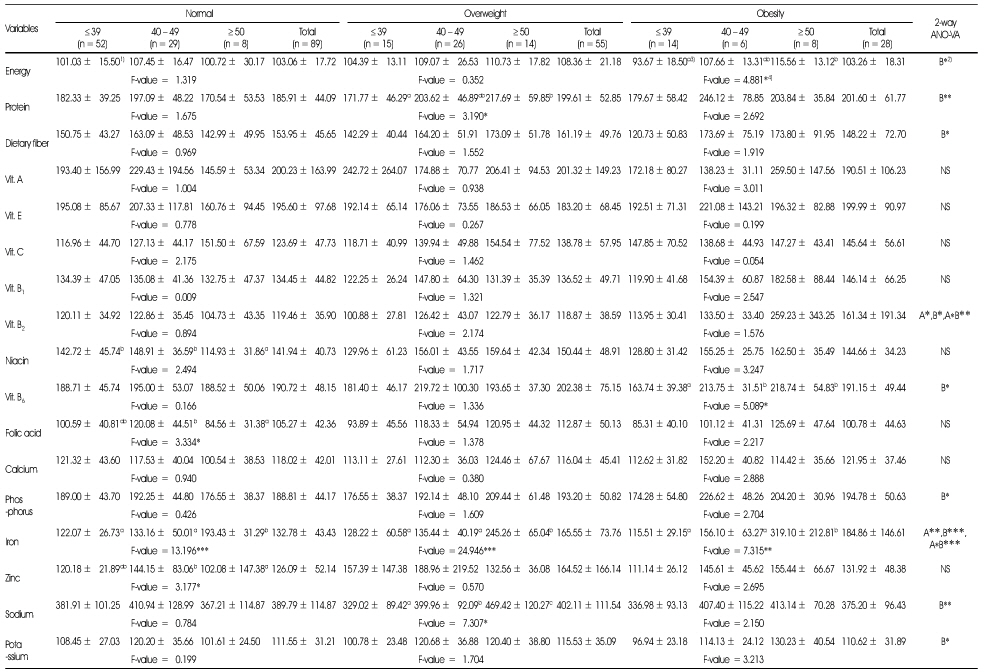
Table 4-1The percentage of nutrients intakes for the dietary reference intakes for Koreans(KDRIs) of subjects according to obesity degree by %fat
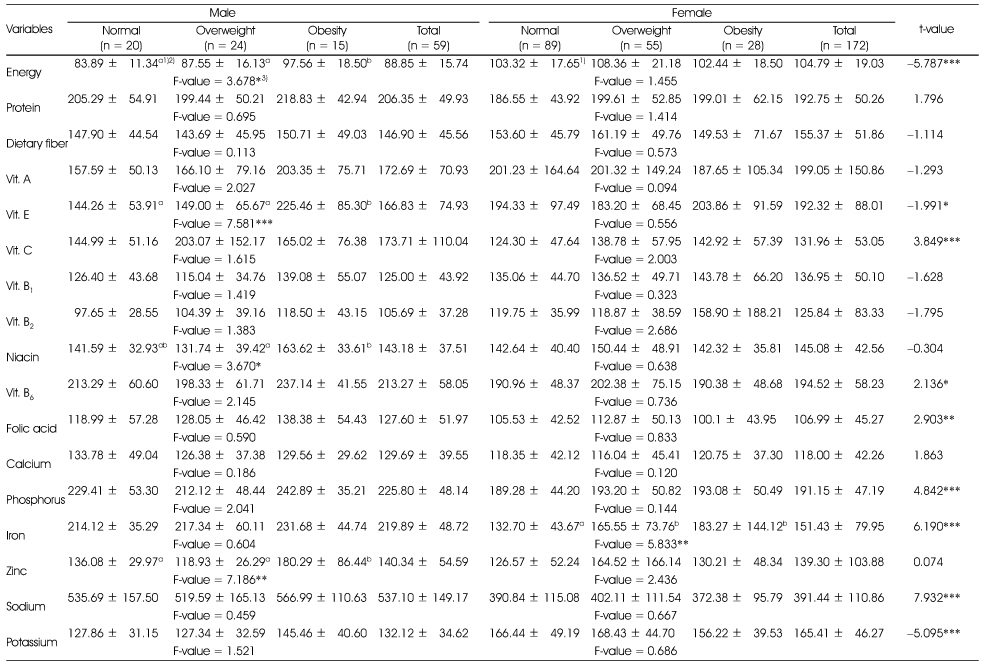
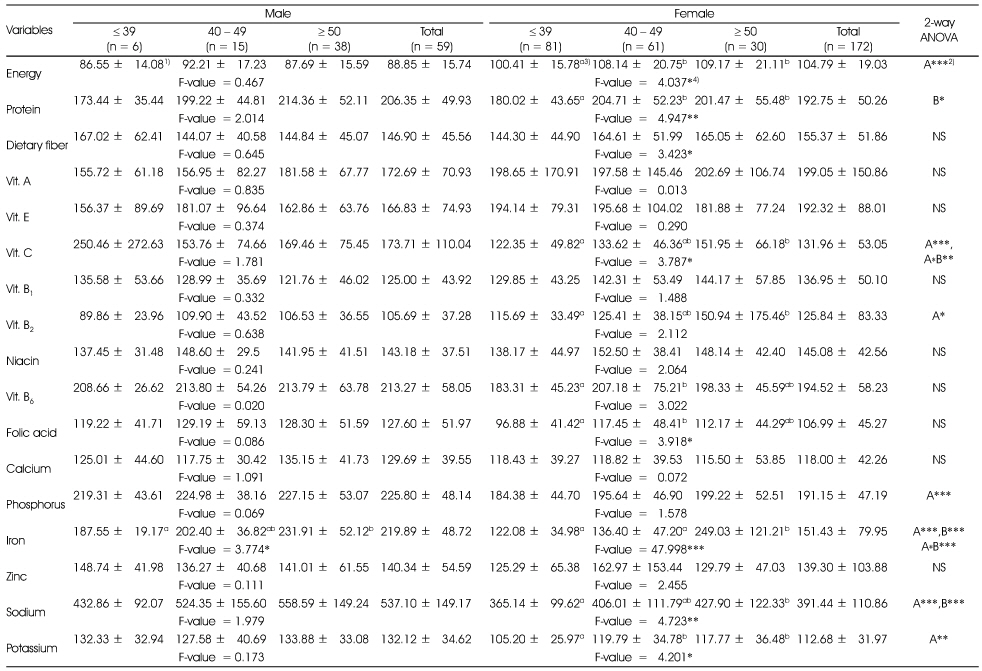
Table 4-2The percentage of nutrients intakes for the dietary reference intakes for Koreans(KDRIs) of subjects according to age
1) Mean ± SD, 2) A: effect of gender; B: effect of age; A*B: interaction of gender and age; NS: not significantly different; *: p < 0.05, **: p < 0.01, ***: p < 0.001 by two-way ANOVA, 3) Different alphabets at the same row are significantly different by Duncan's multiple test (p < 0.05), 4) *: p < 0.05, **: p < 0.01, ***: p < 0.001 by one-way ANOVA
Table 4-3The percentage of nutrients intakes for the dietary reference intakes for Koreans(KDRIs) of female subjects according to age
1) Mean ± SD, 2) A: effect of obese index; B: effect of age; A*B: interaction of obese index and age; NS: not significantly different; *: p < 0.05, **: p < 0.01, ***: p < 0.001 by two-way ANOVA, 3) Different alphabets at the same row are significantly different by Duncan's multiple test (p < 0.05), 4) *: p < 0.05, **: p < 0.01, ***: p < 0.001 by one-way ANOVA
Table 5-1Comparison of blood lipids, blood glucose and blood pressures of subjects according to obesity degree by %fat
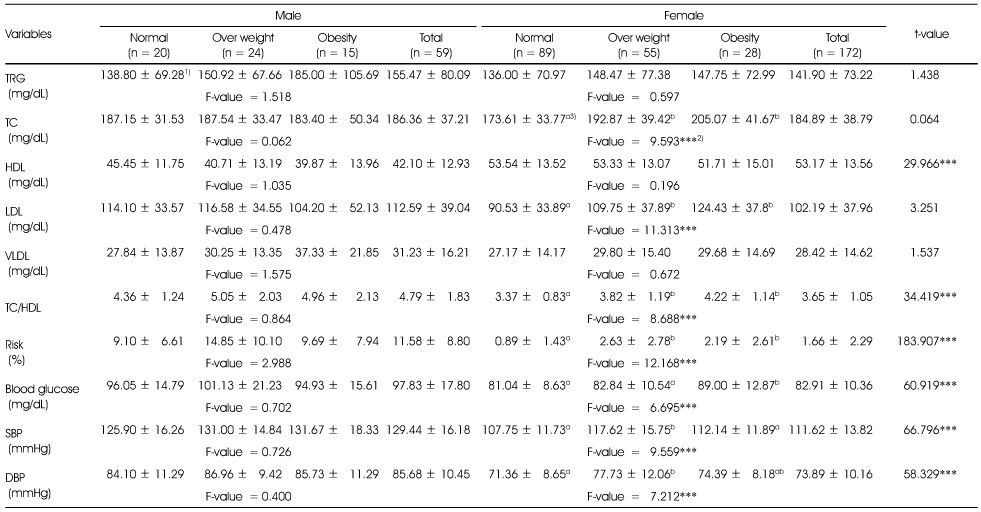
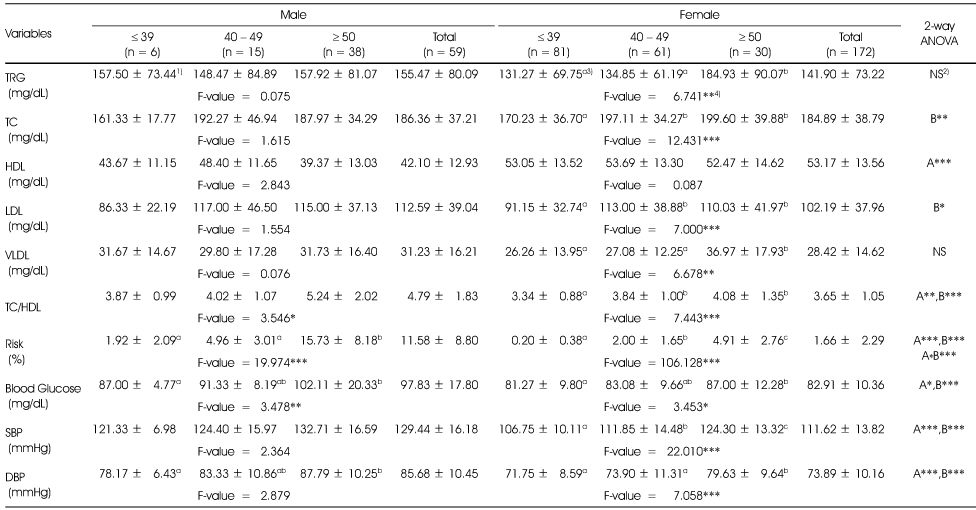
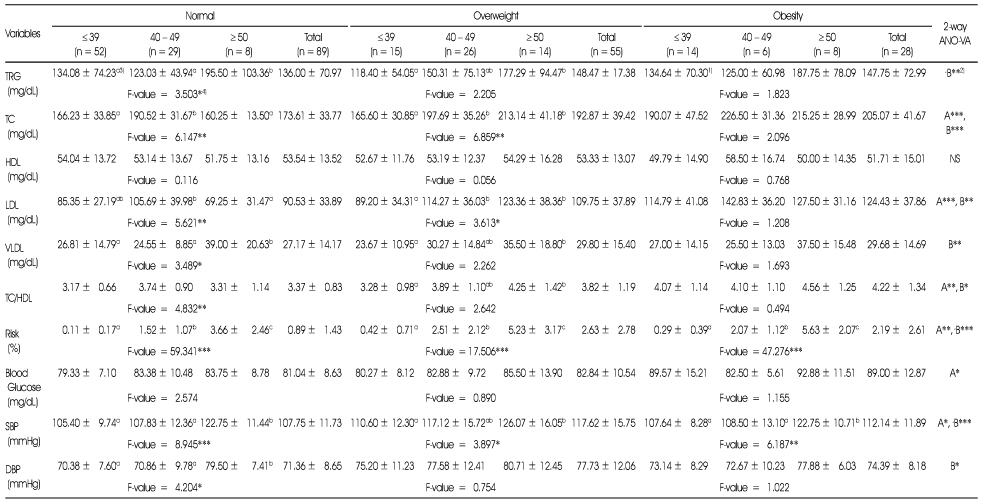
Table 5-2Comparison of blood lipids, blood glucose and blood pressures of subjects according to age
1) Mean ± SD
2) A: effect of gender; B: effect of age; A*B: interaction of gender and age; NS: not significantly different; *: p < 0.05, **: p < 0.01, ***: p < 0.001 by two-way ANOVA
3) Different alphabets at the same row are significantly different by Duncan's multiple test (p < 0.05)
4) *: p < 0.05, **: p < 0.01, ***: p < 0.001 by one-way ANOVA
Table 5-3Comparison of blood lipids, blood glucose and blood pressures of female subjects according to age
1) Mean ± SD
2) A: effect of obese index; B: effect of age; A*B: interaction of obese index and age; NS: not significantly different; *: p < 0.05, **: p < 0.01, ***: p < 0.001 by two-way ANOVA
3) Different alphabets at the same row are significantly different by Duncan's multiple test (p < 0.05)
4) *: p < 0.05, **: p < 0.01, ***: p < 0.001 by one-way ANOVA
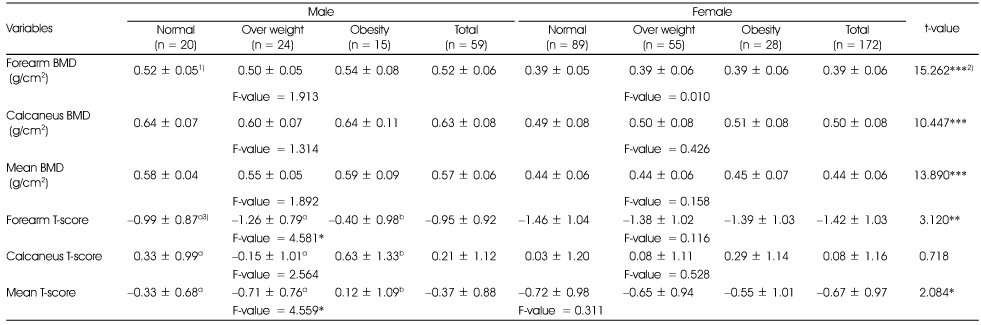
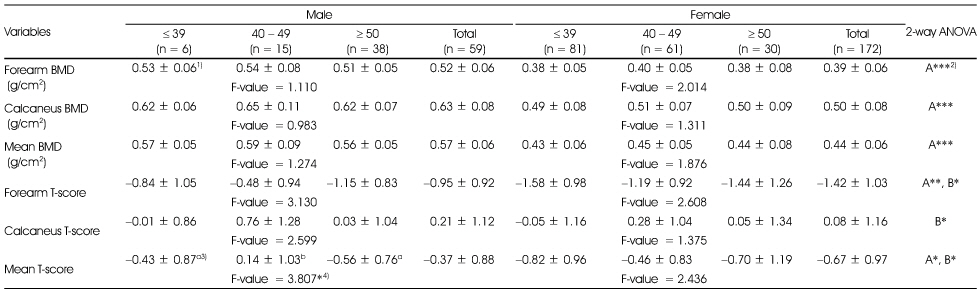
Table 6-2Bone mineral density and T-scores of subjects according to age
1) Mean ± SD, 2) A: effect of gender; B: effect of age; A*B: interaction of gender and age; NS: not significantly different; *: p < 0.05, **: p < 0.01, ***: p < 0.001 by two-way ANOVA, 3) Different alphabets at the same row are significantly different by Duncan's multiple test (p < 0.05), 4) *: p < 0.05 by one-way ANOVA
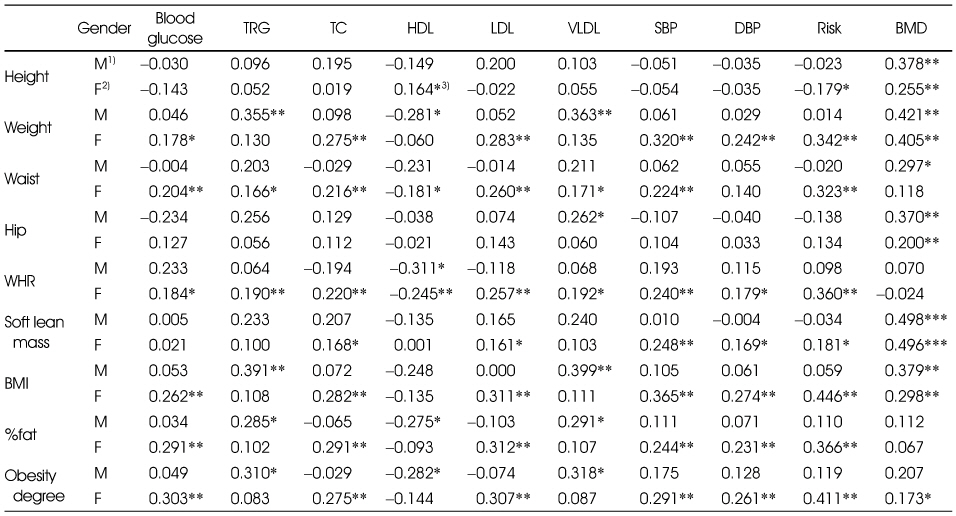
Figure & Data
REFERENCES
Citations
Citations to this article as recorded by 
- Machine learning-based obesity classification considering 3D body scanner measurements
Seungjin Jeon, Minji Kim, Jiwun Yoon, Sangyong Lee, Sekyoung Youm
Scientific Reports.2023;[Epub] CrossRef - Current progress of nanomedicine for prostate cancer diagnosis and treatment
Jiang Zhao, Chi Zhang, Weihao Wang, Chen Li, Xupeng Mu, Kebang Hu
Biomedicine & Pharmacotherapy.2022; 155: 113714. CrossRef - A Study on Weight Control Behaviour, Eating Habits and Health-related Life Habits According to Obesity Degree of Teacher in Jeonbuk Province, Korea
Hye-Soon Chang
Journal of The Korean Society of Food Culture.2015; 30(1): 105. CrossRef - Analysis of Bone Mineral Density, Biochemical Index and Nutrient Intakes of 30-70 Years Old Women: Based on 2011 KNHANES
Jae Ok Koo, Myung Sook Kim
Korean Journal of Community Nutrition.2014; 19(4): 328. CrossRef
 Cite
CiteA Study of Nutrient Intakes, Blood Lipids and Bone Mineral Density according to Obesity Degree by Percentage of Body Fat and Age between Male and Female Teacher in Jeonbuk Province, Korea
A Study of Nutrient Intakes, Blood Lipids and Bone Mineral Density according to Obesity Degree by Percentage of Body Fat and Age between Male and Female Teacher in Jeonbuk Province, Korea
General characteristics of the subjects according to obesity degree by %fat
1) N (%), 2) ***: p < 0.001 by χ2-test
Comparisons of anthropometric measurements and body composition of the subjects according to obesity degree by %fat
1) Mean ± SD, 2) *: p < 0.05, **: p < 0.01, ***: p < 0.001 by t-test or one-way ANOVA, 3) Different alphabets at the same row are significantly different by Duncan's multiple test (p < 0.05), 4) AMC: Arm muscle circumference, 5) Arm cir: Arm circumference, 6) BMR: Basal Metabolic Rate
The daily caloric nutrients and cholesterol intakes, and CPF ratio of subjects according to obesity degree by %fat
1) Mean ± SD
2) *: p < 0.05, **: p < 0.01, ***: p < 0.001 by t-test or one-way ANOVA
3) Different alphabets at the same row are significantly different by Duncan's multiple test (p < 0.05)
The percentage of nutrients intakes for the dietary reference intakes for Koreans(KDRIs) of subjects according to obesity degree by %fat
1) Mean ± SD, 2) Different alphabets at the same row are significantly different by Duncan's multiple test (p < 0.05), 3) *: p < 0.05, **: p < 0.01, ***: p < 0.001 by t-test or one-way ANOVA
The percentage of nutrients intakes for the dietary reference intakes for Koreans(KDRIs) of subjects according to age
1) Mean ± SD, 2) A: effect of gender; B: effect of age; A*B: interaction of gender and age; NS: not significantly different; *: p < 0.05, **: p < 0.01, ***: p < 0.001 by two-way ANOVA, 3) Different alphabets at the same row are significantly different by Duncan's multiple test (p < 0.05), 4) *: p < 0.05, **: p < 0.01, ***: p < 0.001 by one-way ANOVA
The percentage of nutrients intakes for the dietary reference intakes for Koreans(KDRIs) of female subjects according to age
1) Mean ± SD, 2) A: effect of obese index; B: effect of age; A*B: interaction of obese index and age; NS: not significantly different; *: p < 0.05, **: p < 0.01, ***: p < 0.001 by two-way ANOVA, 3) Different alphabets at the same row are significantly different by Duncan's multiple test (p < 0.05), 4) *: p < 0.05, **: p < 0.01, ***: p < 0.001 by one-way ANOVA
Comparison of blood lipids, blood glucose and blood pressures of subjects according to obesity degree by %fat
1) Mean ± SD
2) **: p < 0.01, ***: p < 0.001 by t-test or one-way ANOVA
3) Different alphabets at the same row are significantly different by Duncan's multiple test (p < 0.05)
Comparison of blood lipids, blood glucose and blood pressures of subjects according to age
1) Mean ± SD
2) A: effect of gender; B: effect of age; A*B: interaction of gender and age; NS: not significantly different; *: p < 0.05, **: p < 0.01, ***: p < 0.001 by two-way ANOVA
3) Different alphabets at the same row are significantly different by Duncan's multiple test (p < 0.05)
4) *: p < 0.05, **: p < 0.01, ***: p < 0.001 by one-way ANOVA
Comparison of blood lipids, blood glucose and blood pressures of female subjects according to age
1) Mean ± SD
2) A: effect of obese index; B: effect of age; A*B: interaction of obese index and age; NS: not significantly different; *: p < 0.05, **: p < 0.01, ***: p < 0.001 by two-way ANOVA
3) Different alphabets at the same row are significantly different by Duncan's multiple test (p < 0.05)
4) *: p < 0.05, **: p < 0.01, ***: p < 0.001 by one-way ANOVA
Bone mineral density and T-scores of subjects according to obesity degree by %fat
1) Mean ± SD, 2) *: p < 0.05, **: p < 0.01, ***: p < 0.001 by t-test or one-way ANOVA
3) Different alphabets at the same row are significantly different by Duncan's multiple test (p < 0.05)
Bone mineral density and T-scores of subjects according to age
1) Mean ± SD, 2) A: effect of gender; B: effect of age; A*B: interaction of gender and age; NS: not significantly different; *: p < 0.05, **: p < 0.01, ***: p < 0.001 by two-way ANOVA, 3) Different alphabets at the same row are significantly different by Duncan's multiple test (p < 0.05), 4) *: p < 0.05 by one-way ANOVA
Pearson correlation coefficient in each variable in the study subjects
1) M: Male
2) F: Female
3) *,**,***: Significant at p < 0.05, p < 0.01 and p < 0.001 by Pearson's correlation
Table 1
General characteristics of the subjects according to obesity degree by %fat
1) N (%), 2) ***: p < 0.001 by χ2-test
Table 2
Comparisons of anthropometric measurements and body composition of the subjects according to obesity degree by %fat
1) Mean ± SD, 2) *: p < 0.05, **: p < 0.01, ***: p < 0.001 by t-test or one-way ANOVA, 3) Different alphabets at the same row are significantly different by Duncan's multiple test (p < 0.05), 4) AMC: Arm muscle circumference, 5) Arm cir: Arm circumference, 6) BMR: Basal Metabolic Rate
Table 3
The daily caloric nutrients and cholesterol intakes, and CPF ratio of subjects according to obesity degree by %fat
1) Mean ± SD 2) *: p < 0.05, **: p < 0.01, ***: p < 0.001 by t-test or one-way ANOVA 3) Different alphabets at the same row are significantly different by Duncan's multiple test (p < 0.05)
Table 4-1
The percentage of nutrients intakes for the dietary reference intakes for Koreans(KDRIs) of subjects according to obesity degree by %fat
1) Mean ± SD, 2) Different alphabets at the same row are significantly different by Duncan's multiple test (p < 0.05), 3) *: p < 0.05, **: p < 0.01, ***: p < 0.001 by t-test or one-way ANOVA
Table 4-2
The percentage of nutrients intakes for the dietary reference intakes for Koreans(KDRIs) of subjects according to age
1) Mean ± SD, 2) A: effect of gender; B: effect of age; A*B: interaction of gender and age; NS: not significantly different; *: p < 0.05, **: p < 0.01, ***: p < 0.001 by two-way ANOVA, 3) Different alphabets at the same row are significantly different by Duncan's multiple test (p < 0.05), 4) *: p < 0.05, **: p < 0.01, ***: p < 0.001 by one-way ANOVA
Table 4-3
The percentage of nutrients intakes for the dietary reference intakes for Koreans(KDRIs) of female subjects according to age
1) Mean ± SD, 2) A: effect of obese index; B: effect of age; A*B: interaction of obese index and age; NS: not significantly different; *: p < 0.05, **: p < 0.01, ***: p < 0.001 by two-way ANOVA, 3) Different alphabets at the same row are significantly different by Duncan's multiple test (p < 0.05), 4) *: p < 0.05, **: p < 0.01, ***: p < 0.001 by one-way ANOVA
Table 5-1
Comparison of blood lipids, blood glucose and blood pressures of subjects according to obesity degree by %fat
1) Mean ± SD 2) **: p < 0.01, ***: p < 0.001 by t-test or one-way ANOVA 3) Different alphabets at the same row are significantly different by Duncan's multiple test (p < 0.05)
Table 5-2
Comparison of blood lipids, blood glucose and blood pressures of subjects according to age
1) Mean ± SD 2) A: effect of gender; B: effect of age; A*B: interaction of gender and age; NS: not significantly different; *: p < 0.05, **: p < 0.01, ***: p < 0.001 by two-way ANOVA 3) Different alphabets at the same row are significantly different by Duncan's multiple test (p < 0.05) 4) *: p < 0.05, **: p < 0.01, ***: p < 0.001 by one-way ANOVA
Table 5-3
Comparison of blood lipids, blood glucose and blood pressures of female subjects according to age
1) Mean ± SD 2) A: effect of obese index; B: effect of age; A*B: interaction of obese index and age; NS: not significantly different; *: p < 0.05, **: p < 0.01, ***: p < 0.001 by two-way ANOVA 3) Different alphabets at the same row are significantly different by Duncan's multiple test (p < 0.05) 4) *: p < 0.05, **: p < 0.01, ***: p < 0.001 by one-way ANOVA
Table 6-1
Bone mineral density and T-scores of subjects according to obesity degree by %fat
1) Mean ± SD, 2) *: p < 0.05, **: p < 0.01, ***: p < 0.001 by t-test or one-way ANOVA 3) Different alphabets at the same row are significantly different by Duncan's multiple test (p < 0.05)
Table 6-2
Bone mineral density and T-scores of subjects according to age
1) Mean ± SD, 2) A: effect of gender; B: effect of age; A*B: interaction of gender and age; NS: not significantly different; *: p < 0.05, **: p < 0.01, ***: p < 0.001 by two-way ANOVA, 3) Different alphabets at the same row are significantly different by Duncan's multiple test (p < 0.05), 4) *: p < 0.05 by one-way ANOVA
Table 7
Pearson correlation coefficient in each variable in the study subjects
1) M: Male 2) F: Female 3) *,**,***: Significant at p < 0.05, p < 0.01 and p < 0.001 by Pearson's correlation


