
Articles
- Page Path
- HOME > Korean J Community Nutr > Volume 19(5); 2014 > Article
-
Research Article
- The Relationship between Dietary Behaviors/health Risk Factors and Preference for Salty Taste among Korean Elderly People Living in Rural Areas
- Mee Sook Lee
-
Korean Journal of Community Nutrition 2014;19(5):448-458.
DOI: https://doi.org/10.5720/kjcn.2014.19.5.448
Published online: October 31, 2014
Department of Food and Nutrition, Hannam University, Daejeon, Korea.
- Corresponding author: Mee Sook Lee. Department of Food and Nutrition, Hannam University, 1646 Yuseong-ro, Yuseong-gu, Daejeon 305-811, Korea. Tel: (042) 629-8794, Fax: (042) 629-8789, meesook@hnu.kr
• Received: September 26, 2014 • Revised: October 25, 2014 • Accepted: October 25, 2014
Copyright © 2014 The Korean Society of Community Nutrition
This is an Open-Access article distributed under the terms of the Creative Commons Attribution Non-Commercial License (http://creativecommons.org/licenses/by-nc/3.0/) which permits unrestricted non-commercial use, distribution, and reproduction in any medium, provided the original work is properly cited.
- 1,983 Views
- 3 Download
- 5 Crossref
Abstract
-
Objectives
- Increasing salt preferences with age are said to increase preferences of salty foods, thereby leading to greater sodium consumption, which has further implication for hypertension. This study examined the link between preference of salty taste and dietary factors and health-related risk factors in Korean elderly people.
-
Methods
- We studied 312 elderly individuals aged > 65 years (male, 100 and female, 212). With each subject, pleasant concentration of NaCl was estimated using the sipand-spit method. Dietary habits, food preferences, consumption frequencies, anthropometric and biochemical assessment were assessed.
-
Results
- The pleasant salt concentration was significantly increased in individuals older than 75 years (p < 0.05). Subjects who liked high concentration of salt showed significantly higher preferences for salty foods (p < 0.001). Results showed significant effects (p < 0.01) of fruit & fruit juice consumption frequencies, MNA (mini-nutritional assessment), cognition score, BMI, body fat %, waist circumference, arm circumference, calf circumference, vitamin D level that subjects who likes low salty taste were higher than subjects who likes high salty taste.
-
Conclusions
- The preference for salty taste in the elderly was not correlated with hypertension. But, increased preference for salty taste with age and increased salty food preferences may result in higher sodium consumption. Therefore, nutritional education regarding lowering salt preference and favorable behaviors of low-salt diet is needed to improve the quality of life in the rural elderly.
- 1. Bartoshuk LM. Clinical psychophysics of taste. Gerodontics 1988; 4(5): 249-255.PubMed
- 2. Blais CA, Pangborn RM, Borhani NO, Ferrell MF, Prineas RJ, Laing B. Effect of dietary sodium restriction on taste responses to sodium chloride: a longitudinal study. Am J Clin Nutr 1986; 44(2): 232-243.ArticlePubMed
- 3. Brown JE. Mini nutritional assessment. In: Brown JE, et al, editor. Nutrition through the life cycle. 4th ed. Wadsworth; 2010. p. 466.
- 4. Chang SO. Effect of 6-month low sodium diet on the salt taste perception and pleasantness, blood pressure and urinary sodium excretion in female college students. Korean J Nutr 2010; 43(5): 433-442.Article
- 5. Choi MJ, Jo HJ. Effect of sodium chloride supplementation on bone metabolism in rats consuming a low calcium diet. Korean J Nutr 1996; 29(10): 1096-1104.
- 6. Choi-Kwon S, Kim JS. Lifestyle factors and risk of stroke in Seoul, South Korea. J Stroke Cerebrovasc Dis 1998; 7(6): 414-420.ArticlePubMed
- 7. Chung EJ, Shim EG. Salt-related dietary behaviors and sodium intakes of university students in Gyeonggi-do. J Korean Soc Food Sci Nutr 2008; 37(5): 578-588.Article
- 8. Dahl LK. Possible role of salt intake in the development of essential hypertention. Int J Epidemiol 2005; 34(5): 967-972.PubMed
- 9. De Souza JT, Matsubara LS, Menani JV, Matsubara BB, Johnson AK, De Gobbi JIF. Higher salt preference in heart failure patients. Appetite 2012; 58(1): 418-423.ArticlePubMed
- 10. Durack E, Alonso-Gomez M, Wilkinson MG. Salt: a review of its role in food science and public health. Curr Nutr Food Sci 2008; 4(4): 290-297.Article
- 11. Haddy FJ. Role of dietary salt in hypertension. Life Sci 2006; 79(17): 1585-1592.ArticlePubMed
- 12. He FJ, Markandu ND, Sagnella GA, de Wardener HE, MacGregor GA. Plasma sodium: ignored and underestimated. Hypertension 2005; 45(1): 98-102.ArticlePubMed
- 13. Intersalt Cooperative Research Group. Intersalt: an international study of electrolyte excretion and blood pressure, Results for 24 hour urinary sodium and potassium excretion. BMJ 1988; 297(6644): 319-328.ArticlePubMedPMC
- 14. Jang YR, Chiriboga DA, Kim GY. Acculturation and manifestation of depressive symptoms among Korean American older adults. Korean J Res Gerontol 2006; 15(1): 51-73.Article
- 15. Jhoo JH, Kim KW, Lee DY, Youn JC, Lee TJ, Choo IH, Ko HJ, Seo EH, Woo JI. Comparison of the performance in two different Korean versions of Mini-Mental State Examination: MMSE-KC and K-MMSE. J Korean Neuropsychiatr Assoc 2005; 44(1): 98-104.
- 16. Jung EJ, Kwon JS, Ahn SH, Son SM. Blood pressure, sodium intake and dietary behavior changes by session attendance on salt reduction education program for pre-hypertensive adults in a public health center. Korean J Community Nutr 2013; 18(6): 626-643.Article
- 17. Kawano Y. Salt, hypertention, and cardiovascular diseases. J Korean Soc Hypertens 2012; 18(2): 53-62.Article
- 18. Kim DW, Lee MS, Na BJ, Hong JY. Health-related dietary behaviors and lifestyle factors associated with sodium hyperinjestion in Korean adults. J Korea Acad Industr Coop Soc 2013; 14(7): 3326-3337.
- 19. Kim GH, Lee HM. Frequent consumption of certain fast foods may be associated with an enhanced preference for salt taste. J Hum Nutr Diet 2009; 22(5): 475-480.ArticlePubMed
- 20. Kim HH, Jung YY, Lee YK. A comparison salty taste assessments and dietary attitudes and dietary behaviors associated with high-salt diets in four regions in Korea. Korean J Community Nutr 2012; 17(1): 38-48.Article
- 21. Kim HH, Shin EK, Lee HJ, Lee NH, Chun BY, Ann MY, Lee YK. Evaluation of the effectiveness of a salt reduction program for employees. Korean J Nutr 2009; 42(4): 350-357.Article
- 22. Kim JH, Choi MK. Salt intake behavior and blood pressure: the effect of taste sensitivity and preference. Korean J Hum Ecol 2007; 16(4): 837-848.Article
- 23. Kim KS, Paik HY. A comparative study on optimum gustation of salt and sodium intake in young and middle-aged Korean women. Korean J Nutr 1992; 25(1): 32-41.
- 24. Kim MK, Han JI, Chung YJ. Dietary behavior related to salty food intake of adults living in a rural area according to saline sensitivity. Korean J Nutr 2011; 44(6): 537-550.Article
- 25. Kim MK, Kim K, Shin MH, Shin DH, Lee YH, Chun BY, Choi BY. The relationship of dietary sodium, potassium, fruits, and vegetables intake with blood pressure among Korean adults aged 40 and older. Nutr Res Pract 2014; 8(4): 453-462.ArticlePubMedPMC
- 26. Korea Health Statistics. Ministry of Health Welfare & Korea Centers for Disease Control and Prevention: Korea National Health and Nutrition Examination Survey (KNHANES V-3) 2012. 2013.
- 27. Kwon YC, Park JH. Korean version of Mini-Mental State Examination (MMSE-K) Part I: Development of the test for the elderly. J Korean Neuropsychiatr Assoc 1989; 28(1): 125-135.
- 28. Lee HS. Studies on salt intake through eat-out foods in Andong area. Korean J Soc Food Sci 1997; 13(3): 314-318.
- 29. Lee MS. Taste perceptions of middle-aged and elderly people living in rural areas: relationships among threshold, taste preference and physical activity. Korean J Community Nutr 2010; 15(5): 670-678.
- 30. Lee MS. Association between preferences of salty food and acuity and preferences of taste of the elderly people living in rural area. Korean J Community Nutr 2013; 18(3): 223-232.Article
- 31. Lee MS, Kim SA. The influence of health-related habits on nutrient intake and food frequency of middle-aged subjects in Seoul. Korean J Community Nutr 2003; 8(5): 699-707.
- 32. Lee MS, Woo MK. A study on the factors influencing food consumption by food frequency questionnaire for the middle aged and elderly in the Chonju area. Korean J Community Nutr 2001; 6(5): 789-797.
- 33. Lee YH, Kim HK, Kwon GH. Compliance with a low-salt diet, sodium intake, and preferred salty taste in the hypertensive elderly. J Korean Acad Public Health Nurs 2010; 24(2): 311-322.
- 34. Leshem M. Biobehavior of the human love of salt. Neurosci Biobehav Rev 2009; 33(1): 1-17.ArticlePubMed
- 35. Lucas L, Riddell L, Liem G, Whitelock S, Keast R. The influence of sodium on liking and consumption of salty food. J Food Sci 2011; 76(1): S72-S76.ArticlePubMed
- 36. Ministry of Food and Drug Safety. Sodium Reduction Campaign Headquarters. 2012; cited September 12, 2014]. Available from http://www.foodnara.go.kr/Na_down/index.jsp.
- 37. Mizushima S, Tsuchida K, Yamori Y. Preventive nutritional factors in epidemiology: interaction between sodium and calcium. Clin Exp Pharmacol Physiol 1999; 26(7): 573-575.ArticlePubMed
- 38. Moon HK, Choi SO, Kim JE. Dishes contributing to sodium intake of elderly living in rural areas. Korean J Community Nutr 2009; 14(1): 123-136.
- 39. Murphy C, Withee J. Age-related differences in the pleasantness of chemosensory stimuli. Psychol Aging 1986; 1(4): 312-318.ArticlePubMed
- 40. Nam HS, Kim KY, Kwon IS, Koh KW, Kind Poul. EQ-5D Korean valuation study using time trade-off method. Seoul: Korea Centers for Disease Control and Prevention (KCDC); 2007; cited November 21, 2012]. Available from http://www.cdc.go.kr/.
- 41. Nordin S, Razani LJ, Markison S, Murphy C. Age-associated increases in intensity discrimination for taste. Exp Aging Res 2003; 29(3): 371-381.ArticlePubMed
- 42. Pangborn RM, Pecore SD. Taste perception of sodium chloride in relation to dietary intake of salt. Am J Clin Nutr 1982; 35(3): 510-520.ArticlePubMed
- 43. Rolfes SR, Pinna K, Whitney E. Understanding normal and clinical Nutrition. 8th ed. Belmont, CA: Wadsworth; 2009. p. 856-859.
- 44. Ronksley PE, Brien SE, Turner BJ, Mukamal KJ, Ghali WA. Association of alcohol consumption with selected cardiovascular disease outcomes: a systematic review and meta-analysis. BMJ 2011; 342: d671.ArticlePubMedPMC
- 45. Schiffman SS, Gatlin CA. Clinical physiology of taste and smell. Annu Rev Nutr 1993; 13: 405-436.ArticlePubMed
- 46. Shin EK, Lee HJ, Ahn MY, Lee YK. Study on the development and evaluation of validity of salty taste assessment tool. Korean J Nutr 2008; 41(2): 184-191.
- 47. Shin EK, Lee HJ, Jun SY, Park EJ, Jung YY, Ahn MY, Lee YK. Development and evaluation of nutrition education program for sodium reduction in foodservice operations. Korean J Community Nutr 2008; 13(2): 216-227.
- 48. Son MK. Association between alcohol consumption and hypertension. J Korean Soc Hypertens 2011; 17(2): 65-73.Article
- 49. Stevens JC, Cruz LA, Hoffman JM, Patterson MQ. Taste sensitivity and aging: high incidence of decline revealed by repeated threshold measures. Chem Senses 1995; 20(4): 451-459.ArticlePubMed
- 50. Sung SJ, Jung DG, Lee WK, Kim YJ, Lee HS. Life style and eating behavior of stroke patients in Daegu and Gyeongbuk province, Korea. J Korean Soc Food Sci Nutr 2009; 38(3): 319-332.Article
- 51. Teucher B, Dainty JR, Spinks CA, Majsak-Newman G, Berry DJ, Hoogewerff JA, Foxall RJ, Jakobsen J, Cashman KD, Flynn A, Fairweather-Tait SJ. Sodium and bone health: impact of moderately high and low salt intakes on calcium metabolism in postmenopausal women. J Bone Miner Res 2008; 23(9): 1477-1485.ArticlePubMedPDF
- 52. The EuroQoL group. EuroQoL - a new facility for the measurement of health-related quality of life. Health Policy 1990; 16(3): 199-208.ArticlePubMed
- 53. Ueshima H, Sekikawa A, Miura K, Turin TC, Takashima N, Kita Y, Watanabe M, Kadota A, Okuda N, Kadowaki T, Nakamura Y, Okamura T. Cardiovascular disease and risk factors in Asia: a selected review. Circulation 2008; 118(25): 2702-2709.ArticlePubMedPMC
- 54. Yang WG, Chen CB, Wang ZX, Liu YP, Wen XY, Zhang SF, Sun TW. A case-control study on the relationship between salt intake and salty taste and risk of gastric cancer. World J Gastroenterol 2011; 17(15): 2049-2053.ArticlePubMedPMC
- 55. Yon M, Lee MS, Oh SI, Park SC, Kwak CS. Assessment of food consumption, dietary diversity and dietary pattern during the summer in middle aged adults and older adults living in Gugoksoondam longevity area, Korea. Korean J Community Nutr 2010; 15(4): 536-549.
REFERENCES

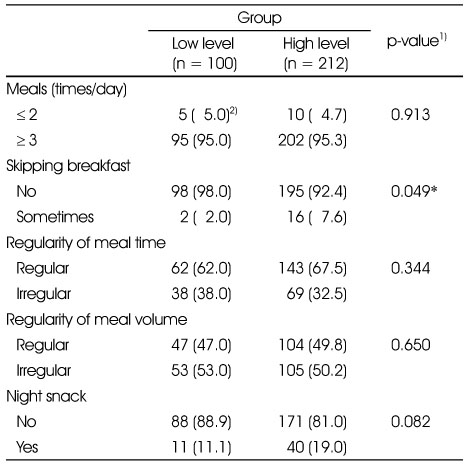


Table 5Quality of life index, depression, cognitive function and Mini-nutritional status assessment by pleasant salty taste group

1) p-value of t-test or χ2-test
2) Quality of life index score by Nam HS et. al. (2007)
3) Mean ± SD
4) Mini-nutritional status assessment score
5) Geriatric depression scale: depressed ≥ 7
6) N (%)
7) Korean mini-mental status examination
*: p < 0.05, **: p < 0.01

Table 7Correlation between pleasant salt taste concentration, food consumption frequencies and various risk factors for health

1) Quality of life index score by Nam HS et. al. (2007)
2) Geriatric depression scale
3) Korean mini-mental status examination
4) Mini-nutritional status assessment score
5) Pearson's correlation coefficient (adjusted by age and sex except age's correlation was adjusted by sex)
*: p < 0.05, **: p < 0.01, ***: p < 0.001
Figure & Data
REFERENCES
Citations
Citations to this article as recorded by 
- Intention to reduce dietary salt and its influencing factors in middle-aged and older hypertensive patients: a theory of planned behavior-based cross-sectional study
Yaqi Wen, Xia Li, Ya Shi, Lei Luo, Du Zhang, Zumin Shi, Manoj Sharma, Yong Zhao
Frontiers in Public Health.2026;[Epub] CrossRef - Taste Propensity in Obese and Nonobese Older Adults
Maedeh Akbari, Ladan Alizadeh Lemani, Nasim Abedimanesh, Jalal Hejazi
AGING MEDICINE.2025; 8(6): 577. CrossRef - Link Between Dietary Sodium Intake, Cognitive Function, and Dementia Risk in Middle-Aged and Older Adults: A Systematic Review
Devi Mohan, Kwong Hsia Yap, Daniel Reidpath, Yee Chang Soh, Andrea McGrattan, Blossom C.M. Stephan, Louise Robinson, Nathorn Chaiyakunapruk, Mario Siervo, Matthew Pase
Journal of Alzheimer's Disease.2020; 76(4): 1347. CrossRef - Comparison of Taste Preferences, Eating Behaviors, and Dietary Habits according to Age of the Elderly in Chungcheong-do
Eun-Sun Park, Mi-Kyeong Choi
Journal of the East Asian Society of Dietary Life.2019; 29(2): 139. CrossRef - Operation and Process Evaluation of a Community Meal Program for the Elderly in Rural Areas during Agricultural Off-Season Perceived by Cooking Volunteers
Jeong-Sook Bae, Sol-Bee Seong, So-Mang Jang, Chang-Hee Yoo, Young-Suk Lim, Young-Mi Lee, Hae-Ryun Park, Kyung-Eun Lee
Korean Journal of Community Nutrition.2019; 24(4): 277. CrossRef
 Cite
CiteThe Relationship between Dietary Behaviors/health Risk Factors and Preference for Salty Taste among Korean Elderly People Living in Rural Areas
The Relationship between Dietary Behaviors/health Risk Factors and Preference for Salty Taste among Korean Elderly People Living in Rural Areas
Characteristics of the subjects by pleasant salty taste group
1) p-value of χ2-test
2) N (%)
*: p < 0.05
Dietary behaviors of subjects by pleasant salty taste group
1) p-value of χ2-test:
2) N (%)
*: p < 0.05
Preferences of food taste by pleasant salty taste group
1) p-value of χ2-test
2) N (%)
***: p < 0.001
Frequencies of food consumption by pleasant salty taste group
1) p-value of t-test
2) Frequencies of food consumption: times per week
3) Mean ± SD
*: p < 0.05
Quality of life index, depression, cognitive function and Mini-nutritional status assessment by pleasant salty taste group
1) p-value of t-test or χ2-test
2) Quality of life index score by Nam HS et. al. (2007)
3) Mean ± SD
4) Mini-nutritional status assessment score
5) Geriatric depression scale: depressed ≥ 7
6) N (%)
7) Korean mini-mental status examination
*: p < 0.05, **: p < 0.01
Anthropometric and biochemical measurements by pleasant salty taste group
1) p-value of t-test
2) Mean ± SD
**: p < 0.01, ***: p < 0.001
Correlation between pleasant salt taste concentration, food consumption frequencies and various risk factors for health
1) Quality of life index score by Nam HS et. al. (2007)
2) Geriatric depression scale
3) Korean mini-mental status examination
4) Mini-nutritional status assessment score
5) Pearson's correlation coefficient (adjusted by age and sex except age's correlation was adjusted by sex)
*: p < 0.05, **: p < 0.01, ***: p < 0.001
Table 1
Characteristics of the subjects by pleasant salty taste group
1) p-value of χ2-test 2) N (%) *: p < 0.05
Table 2
Dietary behaviors of subjects by pleasant salty taste group
1) p-value of χ2-test: 2) N (%) *: p < 0.05
Table 3
Preferences of food taste by pleasant salty taste group
1) p-value of χ2-test 2) N (%) ***: p < 0.001
Table 4
Frequencies of food consumption by pleasant salty taste group
1) p-value of t-test 2) Frequencies of food consumption: times per week 3) Mean ± SD *: p < 0.05
Table 5
Quality of life index, depression, cognitive function and Mini-nutritional status assessment by pleasant salty taste group
1) p-value of t-test or χ2-test 2) Quality of life index score by Nam HS et. al. ( 3) Mean ± SD 4) Mini-nutritional status assessment score 5) Geriatric depression scale: depressed ≥ 7 6) N (%) 7) Korean mini-mental status examination *: p < 0.05, **: p < 0.01
Table 6
Anthropometric and biochemical measurements by pleasant salty taste group
1) p-value of t-test 2) Mean ± SD **: p < 0.01, ***: p < 0.001
Table 7
Correlation between pleasant salt taste concentration, food consumption frequencies and various risk factors for health
1) Quality of life index score by Nam HS et. al. ( 2) Geriatric depression scale 3) Korean mini-mental status examination 4) Mini-nutritional status assessment score 5) Pearson's correlation coefficient (adjusted by age and sex except age's correlation was adjusted by sex) *: p < 0.05, **: p < 0.01, ***: p < 0.001


