
Articles
- Page Path
- HOME > Korean J Community Nutr > Volume 18(1); 2013 > Article
-
Original Article
- Assessment of Physical Activity Pattern, Activity Coefficient, Basal Metabolic Rate and Daily Energy Expenditure in Female University Students
- Yoonji Park, Jung Hee Kim
-
Korean Journal of Community Nutrition 2013;18(1):45-54.
DOI: https://doi.org/10.5720/kjcn.2013.18.1.45
Published online: February 28, 2013
Department of Food and Nutrition, College of Natural Sciences, Seoul Women's University, Seoul, Korea.
- Corresponding author: Jung Hee Kim, Department of Food and Nutrition, College of Natural Sciences, Seoul Women's University, 623 Hwarangno Nowon-gu, Seoul 139-774, Korea. Tel: (02) 970-5646, Fax: (02) 976-4049, jheekim@swu.ac.kr
• Received: January 31, 2013 • Revised: February 13, 2013 • Accepted: February 13, 2013
Copyright © 2013 The Korean Society of Community Nutrition
- 2,731 Views
- 8 Download
- 2 Crossref
Abstract
- This study was conducted to investigate the physical activity pattern, activity coefficient, basal metabolic rate and energy expenditure of female university students. One-day activity diaries were collected from 95 female university students in Seoul. Body composition was measured by Inbody 720. Subjects spent 7 hr 8min on sleeping, 6 hr 31min on studying, 2 hr 50min on physiological activity, 2 hr 3min on leisure, 2 hr 2min on walking and jogging, 1 hr 58 min on commuting and 22min on house chores. The activity coefficient of these subjects was 1.58. The comparison of body composition of subjects according to PAL showed that body weight, body fat mass, arm circumference and arm muscle circumference of physically active group were significantly higher than those of the sedentary group. BMR calculated by Harris-Benedict (H-B) formula and DRI formula and BMR measured by Inbody 720 was 1375 kcal, 1306 kcal and 1209 kcal, respectively. Total energy expenditure (TEE) examined by one-day activity diaries and calculated by H-B formula and estimated energy requirement (EER) formula in DRI was 2102.1 kcal, 2184.4 kcal, and 2164.5 kcal, respectively. The Pearson correlation coefficient between TEE examined by one-day activity diaries and H-B TEE was 0.795 (p < 0.001) while that between TEE examined and DRI EER was 0.604 (p < 0.001). Overall data indicated that female university students seemed to be less active. Therefore it is recommended that universities develop good exercise programs for their students. Further studies are needed to generate more meaningful results with a larger sample size and using machine attached to the body, which are able to detect physical activity more accurately.
-
This study was supported by a grant of the Institute of Natural Sciences at Seoul Women's University in 2011.
NOTES
- 1. Alemán-Mateo H, Salazar G, Hernández-Triana M, Valencia ME. Total energy expenditure, resting metabolic rate and physical activity level in free-living rural elderly men and women from Cuba, Chile and México. Eur J Clin Nutr. 2006; 60: 1258-1265.ArticlePubMedPDF
- 2. Chang UJ, Lee KR. Correlation between measured resting energy expenditure and predicted basal energy expenditure in female college students. J Korean Soc Food Sci Nutr. 2005; 34(2): 196-201.Article
- 3. Choi HJ, Song JM, Kim EK. Assessment of daily steps, activity coefficient, body composition, resting energy expenditure and daily energy expenditure in female university students. J Korean Diet Assoc. 2005; 11(2): 159-169.
- 4. Choi HM, Kim JH, Kim CY, Jang KJ, Min HS, Lim KS, Beon KW, Lee HM, Kim KW, Kim HS, Kim HA. Essentials of Nutrition second edition. 2010; 380.
- 5. Cunningham JJ. Body composition as a determinant of energy expenditure: a synthetic review and proposed general prediction equation. Am J Clin Nutr. 1991; 54: 963-969.PubMed
- 6. Harris JA, Benedict FG. A biometric study of basal metabolism in men. 1919; Washington, DC: Carnegie Institute of Washington; Publication No. 297.
- 7. Institute of Medicine. Dietary reference intakes for energy, carbohydrate, fiber, fat, fatty acid, cholesterol, protein and amino acids. 2002; The National Academies Press.
- 8. Kim EK, Lee SH, Ko SY, Yeon SE, Choe JS. Assessment of physical activity level of Korean farmers to establish estimated energy requirements during busy farming season. Korean J Community Nutr. 2011; 16(6): 751-761.Article
- 9. Kim MJ, Na HJ, Kim YN. Criterion development of 4 activity levels for estimated energy requirement calculation for primary school students. Korean J Community Nutr. 2011; 16(3): 307-314.Article
- 10. Kim Y, Na HJ. The estimation of the daily energy expenditure of Korean adolescents. Korean J Community Nutr. 2003; 8(3): 270-279.
- 11. Lee DH, Lee JK, Lee C, Hwang YY, Cha SH, Choi Y. A study on the health implications associated with obese children. J Korean Pediatr Soc. 1991; 34(4): 445-453.
- 12. Lee GH. Assessment of physical activities, energy expenditure and validity of predicted resting metabolic rates in university students. 2006; Kangnung National University; MS Thesis.
- 13. Lifson N, Gordon GB, McClintock R. Measurement of total carbon dioxide production by means of D218O. J Appl Physiol. 1955; 7: 704-710.PubMed
- 14. Lim HJ, Yoon JS. A longitudinal study on seasonal variations of physical activity and body composition of rural women. Korean J Nutr. 1995; 28(9): 893-903.
- 15. Ministry of Health, Labour and Welfare. The 5th Japanese recommended dietary allowance. 1985.
- 16. Ministry of Health and Welfare, Korea Center for Disease Control and Prevention. 2011 National health statistics based on 2011 Korea national health and nutrition examination survey. 2012.
- 17. Na HJ. Analysis of adolescents energy expenditure and development of energy expenditure evaluating web-based learning system. 2003; Korea National University of Education; Ph. D Thesis.
- 18. Park JA, Kim KJ, Kim JH, Park YS, Koo JO, Yoon JS. A Comparison of the resting energy expenditure of Korean adults using indirect calorimetry. Korean J Community Nutr. 2003; 8(6): 993-1000.
- 19. Park JA, Kim KJ, Yoon JS. A comparison of energy intake and energy expenditure in normal-weight and over-weight Korean adults. Korean J Community Nutr. 2004; 9(3): 285-291.
- 20. Parrish JB. Implication of changing food habits for nutrition educator. J Nutr Educ. 1970; 2: 140-150.
- 21. Pi-Sunyer FX. Medical hazards of obesity. Ann Intern Med. 1993; 119(7 Pt 2): 655-660.ArticlePubMed
- 22. The Korean Nutrition Society. Dietary reference intake For Koreans 1st revision. 2010; 26-46.
- 23. Yoon GA. Relationship of weight status and physical activity of adolescents in Busan city. Korean J Nutr. 2001; 34(1): 39-47.
- 24. Yoon JS, Kim Kj, Kim JH, Park YS, Goo JO. Development of recommended dietary allowance for Korean adults and food life program for publics. 2002; Keimyung University.
- 25. Welle S, Gilbert BF, Ststt M, Bamard RR, Amatruda JM. Energy expenditure under free-living conditions in normal-weight and overweight women. Am J Clin Nutr. 1992; 55: 14-21.ArticlePubMed
REFERENCES

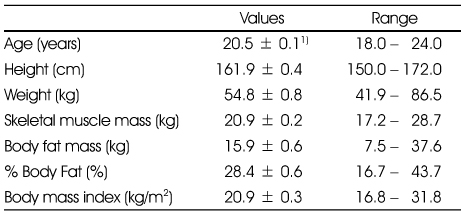
Table 2Comparison of time spent on each activity according to physical activity level
1) Source from recommended dietary allowance for Japanese (5th revision, 1985) and dietary reference intake for Koreans (1st revision 2010)
2) Sedantary: PAL < 1.40, 3) Low active: PAL 1.40~1.60, 4) Active: PAL > 1.60, 5) Values (min/day) are Mean ± SD
a,b: Means with the different superscripts are significantly different at p < 0.05 by Duncan's multiple range test
ns: not significantly different among groups at p < 0.05
Table 3Physical activity patterns of female university students according to physical activity level
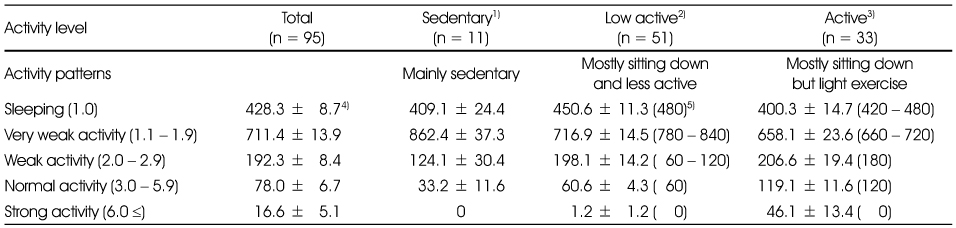
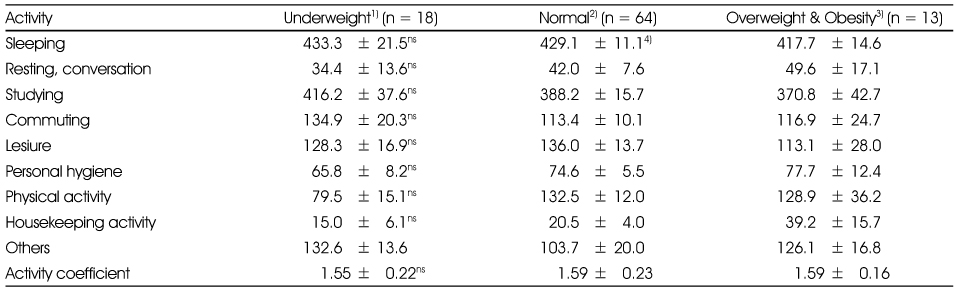
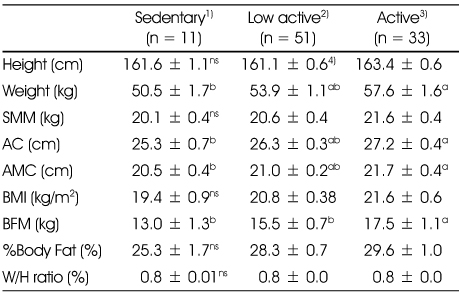
Table 5Comparison of body composition according to physical activity level
1) Sedantary: PAL < 1.40, 2) Low active: PAL 1.40 - 1.60, 3) Active: PAL > 1.60
4) Values are Mean ± SD
SMM: skeletal muscle mass
AC: arm circumference
AMC: arm muscle circumference
BMI: body mass index
BFM: body fat mass
W/H ratio: waist-hip ratio
a,b: Means with the different superscripts are significantly different at p < 0.05 by Duncan's multiple range test
ns: not significantly different among groups at p < 0.05
Table 6Comparison of basal metabolic rate and total energy expenditure calculated by three different methods

-
1) Harris-Benedict formula: BMR = 655 + [9.6 × Weight (kg)] + [1.8 × Height (cm)] - [4.7 × Age]
-
2) Formula in DRI for Koreans (1st revision, 2010)
3) Inbody 720 (Biospace): REE = LBM × 21.6 + 370
4) TEE examined by One-day activity diariest = basal metabolic rate + energy for physical activity + thermic effect of food
5) Values are Mean ± SD
BMR: Basal metabolic rate
TEE: Total energy expenditure
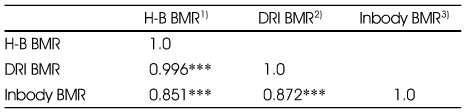
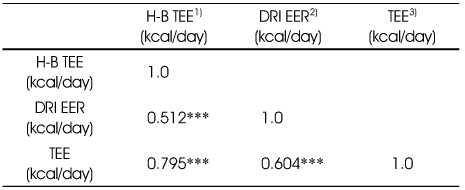
Figure & Data
REFERENCES
Citations
Citations to this article as recorded by 
- Measurement of Energy Expenditure Through Treadmill-based Walking and Self-selected Hallway Walking of College Students - Using Indirect Calorimeter and Accelerometer
Ye-Jin Kim, Cui-Sang Wang, Eun-Kyung Kim
Korean Journal of Community Nutrition.2016; 21(6): 520. CrossRef - A Study on the Body Composition, Physical Activity Level, Basal Metabolic Rate, and Daily Energy Expenditure of Elderly in Busan
Hwa-Jae Lim
Korean Journal of Community Nutrition.2016; 21(2): 178. CrossRef
 Cite
CiteAssessment of Physical Activity Pattern, Activity Coefficient, Basal Metabolic Rate and Daily Energy Expenditure in Female University Students
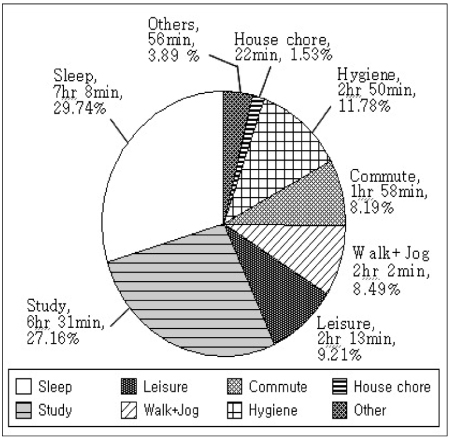
Fig. 1
Distribution of time spent on each activity of female university students.
Fig. 1
Assessment of Physical Activity Pattern, Activity Coefficient, Basal Metabolic Rate and Daily Energy Expenditure in Female University Students
Anthropometric measurements of female university students
1) Values are Mean ± SD
Comparison of time spent on each activity according to physical activity level
1) Source from recommended dietary allowance for Japanese (5th revision, 1985) and dietary reference intake for Koreans (1st revision 2010)
2) Sedantary: PAL < 1.40, 3) Low active: PAL 1.40~1.60, 4) Active: PAL > 1.60, 5) Values (min/day) are Mean ± SD
a,b: Means with the different superscripts are significantly different at p < 0.05 by Duncan's multiple range test
ns: not significantly different among groups at p < 0.05
Physical activity patterns of female university students according to physical activity level
1) Sedentary: PAL < 1.40, 2) Low active: PAL 1.40 - 1.60, 3) Active: PAL > 1.60, 4) Values (min/day) are Mean ± SD, 5) (Values) from DRI for Koreans (1st revision, 2010)
Comparison of time spent on each activity according to BMI
1) Underweight: BMI < 18.5, 2) Normal: BMI 18.5 - 23.0, 3) Overweight and obesity: BMI > 23.0, 4) Values (min/day) are Mean ± SD
ns: Not significantly different among groups at p < 0.05
Comparison of body composition according to physical activity level
1) Sedantary: PAL < 1.40, 2) Low active: PAL 1.40 - 1.60, 3) Active: PAL > 1.60
4) Values are Mean ± SD
SMM: skeletal muscle mass
AC: arm circumference
AMC: arm muscle circumference
BMI: body mass index
BFM: body fat mass
W/H ratio: waist-hip ratio
a,b: Means with the different superscripts are significantly different at p < 0.05 by Duncan's multiple range test
ns: not significantly different among groups at p < 0.05
Comparison of basal metabolic rate and total energy expenditure calculated by three different methods
1) Harris-Benedict formula: BMR = 655 + [9.6 × Weight (kg)] + [1.8 × Height (cm)] - [4.7 × Age]
TEE = BMR × activity coefficient 2) Formula in DRI for Koreans (1st revision, 2010)
BMR = 255 - [2.35 × Age] + [361.6 × Height (m)] + [9.39 × Weight(kg)] EER = 354 - 6.91 × Age (years) + PA × [9.36 × Weight (kg) + 726 × Height (m)]
PA = 1.0 (sedentary), 1.12 (low active), 1.27 (active), 1.45 (very active) 3) Inbody 720 (Biospace): REE = LBM × 21.6 + 370 4) TEE examined by One-day activity diariest = basal metabolic rate + energy for physical activity + thermic effect of food 5) Values are Mean ± SD BMR: Basal metabolic rate TEE: Total energy expenditure
Pearson correlation coefficient among different methods of the basal metabolic rate
1) H-B BMR: basal metabolic rate calculated by Harris-Benedict formula
2) DRI BMR: basal metabolic rate calculated by Institute of Medicine (2002)
3) Inbody BMR: basal metabolic rate measured by Inbody 720
***: p < 0.001 by Pearson correlation analysis
Pearson correlation coefficient among different methods of total energy expenditure
1) H-B TEE: total energy expenditure calculated by Harris-Benedict formula
2) DRI EER: estimated energy requirement by DRI
3) TEE examined by One-day activity diaries: basal metabolic rate + energy for physical activity + thermic effect of food
***: p < 0.001 by Pearson correlation analysis
Table 1
Anthropometric measurements of female university students
1) Values are Mean ± SD
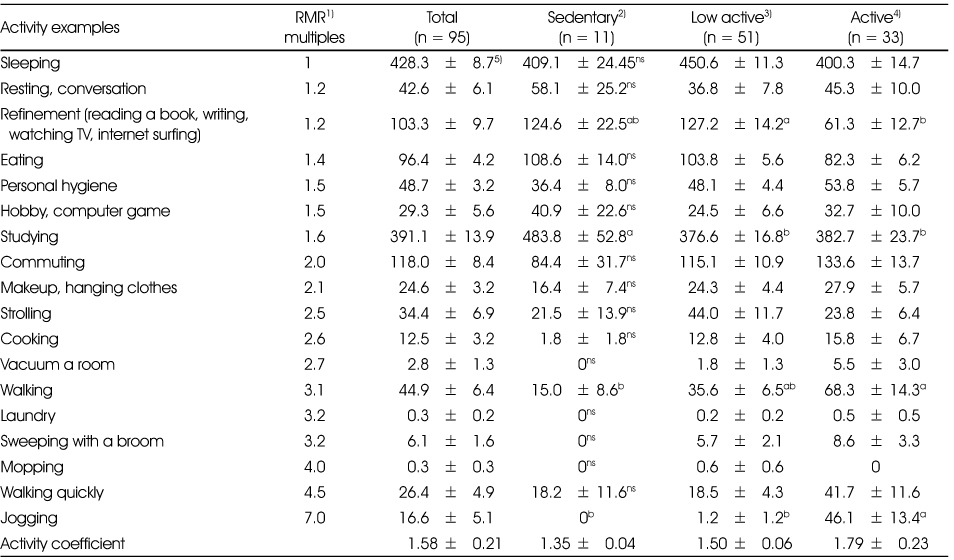
Table 2
Comparison of time spent on each activity according to physical activity level
1) Source from recommended dietary allowance for Japanese (5th revision, 1985) and dietary reference intake for Koreans (1st revision 2010) 2) Sedantary: PAL < 1.40, 3) Low active: PAL 1.40~1.60, 4) Active: PAL > 1.60, 5) Values (min/day) are Mean ± SD a,b: Means with the different superscripts are significantly different at p < 0.05 by Duncan's multiple range test ns: not significantly different among groups at p < 0.05
Table 3
Physical activity patterns of female university students according to physical activity level
1) Sedentary: PAL < 1.40, 2) Low active: PAL 1.40 - 1.60, 3) Active: PAL > 1.60, 4) Values (min/day) are Mean ± SD, 5) (Values) from DRI for Koreans (1st revision, 2010)
Table 4
Comparison of time spent on each activity according to BMI
1) Underweight: BMI < 18.5, 2) Normal: BMI 18.5 - 23.0, 3) Overweight and obesity: BMI > 23.0, 4) Values (min/day) are Mean ± SD ns: Not significantly different among groups at p < 0.05
Table 5
Comparison of body composition according to physical activity level
1) Sedantary: PAL < 1.40, 2) Low active: PAL 1.40 - 1.60, 3) Active: PAL > 1.60 4) Values are Mean ± SD SMM: skeletal muscle mass AC: arm circumference AMC: arm muscle circumference BMI: body mass index BFM: body fat mass W/H ratio: waist-hip ratio a,b: Means with the different superscripts are significantly different at p < 0.05 by Duncan's multiple range test ns: not significantly different among groups at p < 0.05
Table 6
Comparison of basal metabolic rate and total energy expenditure calculated by three different methods
1) Harris-Benedict formula: BMR = 655 + [9.6 × Weight (kg)] + [1.8 × Height (cm)] - [4.7 × Age]
TEE = BMR × activity coefficient 2) Formula in DRI for Koreans (1st revision, 2010)
BMR = 255 - [2.35 × Age] + [361.6 × Height (m)] + [9.39 × Weight(kg)] EER = 354 - 6.91 × Age (years) + PA × [9.36 × Weight (kg) + 726 × Height (m)]
PA = 1.0 (sedentary), 1.12 (low active), 1.27 (active), 1.45 (very active) 3) Inbody 720 (Biospace): REE = LBM × 21.6 + 370 4) TEE examined by One-day activity diariest = basal metabolic rate + energy for physical activity + thermic effect of food 5) Values are Mean ± SD BMR: Basal metabolic rate TEE: Total energy expenditure
Table 7
Pearson correlation coefficient among different methods of the basal metabolic rate
1) H-B BMR: basal metabolic rate calculated by Harris-Benedict formula 2) DRI BMR: basal metabolic rate calculated by Institute of Medicine (2002) 3) Inbody BMR: basal metabolic rate measured by Inbody 720 ***: p < 0.001 by Pearson correlation analysis
Table 8
Pearson correlation coefficient among different methods of total energy expenditure
1) H-B TEE: total energy expenditure calculated by Harris-Benedict formula 2) DRI EER: estimated energy requirement by DRI 3) TEE examined by One-day activity diaries: basal metabolic rate + energy for physical activity + thermic effect of food ***: p < 0.001 by Pearson correlation analysis


