
Articles
- Page Path
- HOME > Korean J Community Nutr > Volume 20(6); 2015 > Article
-
Research Article
- Quality of Nutrient Adequacy and Health-related Quality of life of the Rural Elderly
- Mee Sook Lee
-
Korean Journal of Community Nutrition 2015;20(6):423-432.
DOI: https://doi.org/10.5720/kjcn.2015.20.6.423
Published online: December 31, 2015
Department of Food and Nutrition, Hannam University, Daejeon, Korea.
- Corresponding author Mee Sook Lee. Department of Food and Nutrition, Hannam University, 1646 Yuseong-ro, Yuseong-gu, Daejeon 34054, Korea. Tel: (042) 629-8794, Fax: (042) 629-8789, meesook@hnu.kr
• Received: November 11, 2015 • Revised: December 21, 2015 • Accepted: December 21, 2015
Copyright © 2015 The Korean Society of Community Nutrition
This is an Open-Access article distributed under the terms of the Creative Commons Attribution Non-Commercial License (http://creativecommons.org/licenses/by-nc/3.0/) which permits unrestricted non-commercial use, distribution, and reproduction in any medium, provided the original work is properly cited.
- 1,916 Views
- 1 Download
- 4 Crossref
Abstract
-
Objectives
- In Korea, the percentage of elderly is increasing at an unprecedented rate, and is expected to account for 40% of the population by 2060. This massive demographic change stresses the importance of research on aging as it is necessary to improve the quality of life (QoL) of this population. This study aimed to examine the health-related quality of life (HRQoL) of the rural elderly and to clarify its association with the nutrient adequacy ratio (NAR).
-
Methods
- A cross-sectional study was performed in S-gun, Chonbuk, a critical agricultural area. The elderly people without abnormal physical functioning composed our study population and the data were collected by personal visits to 336 elderly people aged over 65 years (110 males and 226 females). Subjects were interviewed with questionnaires pertaining to general characteristics and EuroQol (EQ-5D). Nutrient intakes were assessed two days by 24-hours recall method. Subjects were defined as high QOL group if EQ-5D index with Nam's model was above the median.
-
Results
- Generally, EQ-5D index was lower in women than in man, and lower in older subjects than in younger subjects. The percentages of people below the median were 42% (low QoL group) and 58% (high QoL group) were found to be the above the median. The high QoL group had higher NAR, especially for vitamin C, vitamin B1, vitamin B2 and folate. All dimensions in the EQ-5D were affected by NAR of some nutrients and especially anxiety/depression dimension was significantly correlated with NAR of 5 nutrients (protein, calcium, iron, vitamin C and vitamin B1) and EQ-5D scores.
-
Conclusions
- HRQol was significantly reduced in elderly with increasing age and this was more pronounced in women than in man. The NAR of some nutrients were associated with the EQ-5D index, especially anxiety/depression dimension, among rural elderly.
Acknowledgments
Acknowledgments
- 1. Statistics Korea. Population prospects of Korea & World [internet]. Statistics Korea; 2015; cited 2015 Sep 19]. Available from: http://kostat.go.kr/portal/korea/kor_nw/2/1/index.board?bmode=read&bSeq=&aSeq=347102&pageNo=1&rowNum=10&navCount=10&currPg=&sTarget=title&sTxt=/.
- 2. The Ministry of Health & Welfare. Ministry of health and welfare statistical year book 2014 [internet]. The Ministry of Health & Welfare; 2014; cited 2015 Sep 19]. Available from: http://stat.mw.go.kr/front/statData/mohwAnnalsWpView.jsp?menuId=14&nttSeq=21531&bbsSeq=1&nttClsCd=01/.
- 3. Statistics Korea. Life expectancy at birth and disability adjusted life expectancy 2015 [internet]. Statistics Korea; 2015; cited 2015 Sep 19]. Available from: http://www.index.go.kr/potal/main/EachDtlPageDetail.do?idx_cd=2758/.
- 4. Giacalone D, Wendin K, Kremer S, Frøst MB, Bredie WLP, Olsson V. Health and quality of life in an aging population - Food and beyond. Food Qual Prefer 2014; 47(B): 166-170.Article
- 5. Moons P, Budts W, De Geest S. Critique on the conceptualisation of quality of life: A review and evaluation of different conceptual approaches. Int J Nurs Stud 2006; 43(7): 891-901.ArticlePubMed
- 6. Sun W, Aodeng S, Tanimoto Y, Watanabe M, Han J, Wang B. Quality of life (QOL) of the community-dwelling elderly and associated factors: A population-based study in urban areas of China. Arch Gerontol Geriatr 2015; 60(2): 311-316.ArticlePubMed
- 7. Phelan EA, Anderson LA, LaCroix AZ, Larson EB. Older adults' views of "successful aging"- how do they compare with researchers' definitions? J Am Geriatr Soc 2004; 52(2): 211-216.ArticlePubMed
- 8. Ware JE, Sherbourne CD. The MOS 36-item short-form health survey (SF-36): I. Conceptual framework and item selection. Med Care 1992; 30(6): 473-483.PubMed
- 9. EuroQol Group. EuroQoL - a new facility for the measurement of health-related quality of life. Health Policy 1990; 16(3): 199-208.ArticlePubMed
- 10. Janssen MF, Birnie E, Haagsma JA, Bonsel GJ. Comparing the standard EQ-5D three-level system with a five-level version. Value Health 2008; 11(2): 275-284.ArticlePubMed
- 11. Lee YH, Choi JS, Rhee JA, Ryu SY, Shin MH, Kim JH. A study on the application of the Korean valuation weights for EuroQoL-5 dimension. J Korean Soc Health Educ Promot 2009; 26(1): 1-13.
- 12. Haywood KL, Garratt A, Fitzpatrick R. Quality of life in older people: A structured review of generic self-assessed health instruments. Qual Life Res 2005; 14(7): 1651-1668.ArticlePubMedPDF
- 13. Kang E, Shin H, Park H, Jo M, Kim N. A valuation of health status using EQ-5D. Korean J Health Econ Policy 2006; 12(2): 19-43.
- 14. Nam HS, Kim KY, Kwon IS, Koh KW. Poul Kind. EQ-5D Korean valuation study using time trade-off method [internet]. Korea Centers for Disease Control and Prevention (KCDC); 2007; cited 2012 Nov 21]. Available from: http://www.cdc.go.kr/.
- 15. Lee SI. Validity and reliability evaluation for EQ-5D in Korea [internet]. Korea Centers for Disease Control and Prevention (KCDC); 2012; cited 2015 Sep 8]. Available from: http://www.cdc.go.kr/CDC/contents/CdcKrContentLink.jsp?fid=28&cid=1742&ctype=1/.
- 16. Lee YH, Choi JS, Rhee JA, Ryu SY, Shin MH, Kim JH. A study on the application of the Korean valuation weights for EuroQoL-5 dimension. J Korean Soc Health Educ Promot 2009; 26(1): 1-13.
- 17. Seong SS, Choi CB, Sung YK, Park YW, Lee HS, Uhm WS. Health-related quality of life using EQ-5D in Koreans. J Korean Rheum Assoc 2004; 11(3): 254-262.
- 18. Han MA, Ryu SY, Park J, Kang MG, Park JK, Kim KS. Health-related quality of life assessment by the EuroQol-5D in some rural adults. J Prev Med Public Health 2008; 41(3): 173-180.ArticlePubMed
- 19. Ministry of Health & Welfare. The Korea National Health and Nutrition Examination Survey (KHANES IV) 2008 [internet]. 2008; cited 2015 Oct 19]. Available from: http://stat.mw.go.kr/front/statData/publicationView.jsp?menuId=47&bbsSeq=13&nttSeq=14245&searchKey=&searchWord=&nPage=5/.
- 20. Ministry of Health & Welfare. Korea Health Statistics 2013: Korea National Health and Nutrition Examination Survey (KHANES VI-1) [internet]. 2013; cited 2015 Sep 8]. Available from: http://knhanes.cdc.go.kr/.
- 21. Chung JY, Lee MY, Kim MJ. A study on the prevalence of chronic disease, health-related habits and nutrients intakes according to the quality of life in Korean adults. Korean J Community Nutr 2010; 15(4): 445-459.
- 22. Lee MS. Health-related factors influencing the quality of life of rural elderly subjects - activities of daily living, cognitive functions, prevalence of chronic diseases and nutritional assessment. Korean J Community Nutr 2012; 17(6): 772-781.Article
- 23. Lee HS. The factors influencing health-related quality of life in the elderly - Focused on the general characteristics, health habits, mental health, chronic diseases, and nutrient intake status: data from the fifth Korea National Health and Nutrition Examination Survey (KNHANES V), 2010~2012. Korean J Community Nutr 2014; 19(5): 479-489.Article
- 24. Korean Nutrition Society. Korean Dietary Reference Intakes 2010 [internet]. 2010; cited 2015 Sep 8]. Available from: http://www.kns.or.kr/.
- 25. Bernstein M, Munoz N. Position of the academy of nutrition and dietetics: Food and nutrition for older adults: promoting health and wellness. J Acad Nutr Diet 2012; 112(8): 1255-1277.ArticlePubMed
- 26. Yun JH, Kang JM, Kim KS, Kim SH, Kim TH, Park YW. Health-related quality of life in Korean patients with chronic diseases. J Korean Rheum Assoc 2004; 11(3): 263-274.
- 27. Fuchs J, Scheidt-Nave C, Hinrichs T, Mergenthaler A, Stein J, Reidel-Heller SG. Indicators for healthy aging-a debate. Int J Environ Res Public Health 2013; 10(12): 6630-6644.PubMedPMC
- 28. Buckley J, Tucker G, Hugo G, Wittert G, Adams RJ, Wilson DH. The Australian baby boomer population-factors influencing changes to health-related quality of life over time. J Aging Health 2013; 25(1): 29-55.ArticlePubMedLink
- 29. Akbulut GC, Ersoy G. Assessment of nutrition and life quality scores of individuals aged 65 and over from different socioeconomic levels in Turkey. Arch Gerontol Geriatr 2008; 47(2): 241-252.ArticlePubMed
- 30. Schünemann HJ, Sperati F, Barba M, Santesso N, Melegari C, Akl EA. An instrument to assess quality of life in relation to nutrition: item generation, item reduction and initial validation. Health Qual Life Outcomes 2010; 8: 26.ArticlePubMedPMC
- 31. Kvamme JM, Olsen JA, Florholmen J, Jacobsen BK. Risk of malnutrition and health-related quality of life in community-living elderly men and women: The Tromsø study. Qual Life Res 2011; 20(4): 575-582.ArticlePubMedPDF
- 32. Germain L, Latarche C, Kesse-Guyot E, Galan P, Hercberg S, Briancon S. Does compliance with nutrition guidelines lead to healthy aging? A quality-of-life approach. J Acad Nutr Diet 2013; 113(2): 228-240.e1-2.ArticlePubMed
- 33. Milte CM, Thorpe MG, Crawford D, Ball K, McNaughton SA. Associations of diet quality with health-related quality of life in older Australian men and women. Exp Gerontol 2015; 64(1): 8-16.ArticlePubMed
- 34. Chung JY, Lee MY, Kim MJ. A study on the prevalence of chronic disease, health-related habits and nutrient intakes according to the quality of life in Korean adults. Korean J Community Nutr 2010; 15(4): 445-459.
- 35. Sohn A, Hong IO, Kim J. Health-related quality of life assessment by health behavior and BMI among Seoul citizens. Korean Public Health Res 2010; 36(2): 19-25.
- 36. Kirchengast S, Haslinger B. Gender differences in health-related quality of life among healthy aged and old-aged Austrians: cross-sectional analysis. Gend Med 2008; 5(3): 270-278.ArticlePubMed
- 37. Kim MR. An analysis of the factors affecting the quality of life: a comparison by age and gender. J Korean Gerontol Soc 2012; 32(1): 145-161.
- 38. Chung HT, Lee KS. An analysis on health-related difference based on the socio-economic class of farming and fishing village residences-Centered on the socio-economic hierarchy difference-. J Korean Island 2015; 27(2): 127-140.
- 39. Kim HK, Chang HK, Lee MR, Son YJ, Han SJ, Yang NY. Influence of malnutrition and social network on health-related quality of life in elders. J Korean Acad Fundam Nurs 2013; 20(2): 98-107.Article
- 40. McNaughton SA, Ball K, Crawford D, Mishra GD. An index of diet and eating patterns is a valid measure of diet quality in an Australian population. J Nutr 2008; 138(1): 86-93.PubMed
- 41. Kim JY. Health-related quality of life according to breakfast in elderly. J Korea Acad Ind Coop Soc 2015; 16(7): 4668-4678.Article
- 42. Jacka FN, Mykletun A, Berk M, Bjelland I, Tell GS. The association between habitual diet quality and the common mental disorders in community-dwelling adults: the Hordaland Health study. Psychosom Med 2011; 73(6): 483-490.PubMed
- 43. Matthews C, Milte CM, Ball K, McNaughton SA. Associations between fruits and vegetable intake and quality of life. J Nutr Intermed Metab 2014; 1(1): 18.
- 44. Hoffmann AT. Quality of life, food choice and meal patternsfield report of a practitioner. Ann Nutr Metab 2008; 52: suppl 1. 20-24.ArticlePubMed
REFERENCES
Table 1

QOL1) index of the subjects by age and gender
1) QOL index; quality of life index (EQ-5D index) [14]
2) p value of t-test between gender
3) Mean±SD (number of subjects)
4) p value of t-test between age group
*: p < 0.05
Table 2

Distribution of subjects of QOL1) index group by age and gender
1) QOL index; quality of life index (EQ-5D index) [14]
2) p value of chi-square test
3) Number of subjects (%)
*: p < 0.05, **: p < 0.01
Table 3
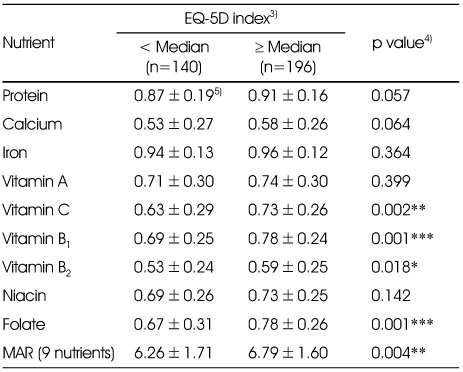
NAR1) of nutrients of subjects by QOL2) index group
1) NAR; nutrient adequacy ratio; MAR: mean adequacy ratio
2) QOL index; quality of life index(EQ-5D index) [14]
3) Median of EQ-5D index is 0.9338
4) p value of t-test
5) Mean±SD
*: p < 0.05, **: p < 0.01, ***: p < 0.001


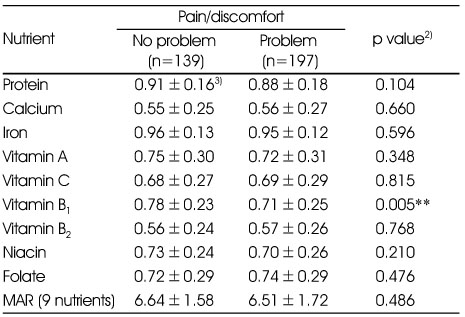


Figure & Data
REFERENCES
Citations
Citations to this article as recorded by 
- Health and dietary characteristics of the men and women in their middle age according to health-related quality of life: using the Korea National Health and Nutrition Examination Survey data in 2019 and 2021
Sarim Kim, Yoon Jung Yang
Journal of Nutrition and Health.2024; 57(3): 307. CrossRef - Snack Provision Practice in Long-Term Care Hospitals and Facilities in Korea
Dayeong Yeo, Hae Jin Kang, Hyejin Ahn, Yoo Kyoung Park
Clinical Nutrition Research.2024; 13(2): 108. CrossRef - Relationship between Dietary Patterns and Cardiovascular Disease Risk in Korean Older Adults
Ae-Rim Seo, Tae-Yoon Hwang
International Journal of Environmental Research and Public Health.2021; 18(7): 3703. CrossRef - Food and nutrient intake status of Korean elderly by perceived anxiety and depressive condition: data from Korean National Health and Nutrition Examination Survey 2013 ~ 2015
Da-Mee Kim, Kyung-Hee Kim
Journal of Nutrition and Health.2019; 52(1): 58. CrossRef
 Cite
CiteQuality of Nutrient Adequacy and Health-related Quality of life of the Rural Elderly
Quality of Nutrient Adequacy and Health-related Quality of life of the Rural Elderly
QOL1) index of the subjects by age and gender
1) QOL index; quality of life index (EQ-5D index) [14]
2) p value of t-test between gender
3) Mean±SD (number of subjects)
4) p value of t-test between age group
*: p < 0.05
Distribution of subjects of QOL1) index group by age and gender
1) QOL index; quality of life index (EQ-5D index) [14]
2) p value of chi-square test
3) Number of subjects (%)
*: p < 0.05, **: p < 0.01
NAR1) of nutrients of subjects by QOL2) index group
1) NAR; nutrient adequacy ratio; MAR: mean adequacy ratio
2) QOL index; quality of life index(EQ-5D index) [14]
3) Median of EQ-5D index is 0.9338
4) p value of t-test
5) Mean±SD
*: p < 0.05, **: p < 0.01, ***: p < 0.001
NAR1) of nutrients of subjects by the degree of mobility
1) NAR; nutrient adequacy ratio; MAR: mean adequacy ratio
2) p value of t-test
3) Mean±SD
*: p < 0.05, **: p < 0.01
NAR1) of nutrients of subjects by the degree of self-care
1) NAR; nutrient adequacy ratio; MAR: mean adequacy ratio
2) p value of t-test
3) Mean±SD
**: p < 0.01
NAR1) of nutrients of subjects by the degree of usual activities
1) NAR; nutrient adequacy ratio; MAR: mean adequacy ratio
2) p value of t-test
3) Mean±SD
*: p < 0.05
NAR1) of nutrients of subjects by the degree of pain/discomfort
1) NAR; nutrient adequacy ratio; MAR: mean adequacy ratio
2) p value of t-test
3) Mean±SD
**: p < 0.01
NAR1) of nutrients of subjects by the degree of anxiety/depression
1) NAR; nutrient adequacy ratio; MAR: mean adequacy ratio
2) p value of t-test
3) Mean±SD
*: p < 0.05, **: p < 0.01
Correlations between intake of nutrients (% of RNI) and EQ-5D (EuroQol - 5 Dimension) of the subjects
1) EAR % (Estimated average requirement %), RNI (Recommended nutrient intake)
2) Pearson correlation coefficient
*: p < 0.05, **: p < 0.01
Table 1
QOL1) index of the subjects by age and gender
1) QOL index; quality of life index (EQ-5D index) [ 2) p value of t-test between gender 3) Mean±SD (number of subjects) 4) p value of t-test between age group *: p < 0.05
Table 2
Distribution of subjects of QOL1) index group by age and gender
1) QOL index; quality of life index (EQ-5D index) [ 2) p value of chi-square test 3) Number of subjects (%) *: p < 0.05, **: p < 0.01
Table 3
NAR1) of nutrients of subjects by QOL2) index group
1) NAR; nutrient adequacy ratio; MAR: mean adequacy ratio 2) QOL index; quality of life index(EQ-5D index) [ 3) Median of EQ-5D index is 0.9338 4) p value of t-test 5) Mean±SD *: p < 0.05, **: p < 0.01, ***: p < 0.001
Table 4
NAR1) of nutrients of subjects by the degree of mobility
1) NAR; nutrient adequacy ratio; MAR: mean adequacy ratio 2) p value of t-test 3) Mean±SD *: p < 0.05, **: p < 0.01
Table 5
NAR1) of nutrients of subjects by the degree of self-care
1) NAR; nutrient adequacy ratio; MAR: mean adequacy ratio 2) p value of t-test 3) Mean±SD **: p < 0.01
Table 6
NAR1) of nutrients of subjects by the degree of usual activities
1) NAR; nutrient adequacy ratio; MAR: mean adequacy ratio 2) p value of t-test 3) Mean±SD *: p < 0.05
Table 7
NAR1) of nutrients of subjects by the degree of pain/discomfort
1) NAR; nutrient adequacy ratio; MAR: mean adequacy ratio 2) p value of t-test 3) Mean±SD **: p < 0.01
Table 8
NAR1) of nutrients of subjects by the degree of anxiety/depression
1) NAR; nutrient adequacy ratio; MAR: mean adequacy ratio 2) p value of t-test 3) Mean±SD *: p < 0.05, **: p < 0.01
Table 9
Correlations between intake of nutrients (% of RNI) and EQ-5D (EuroQol - 5 Dimension) of the subjects
1) EAR % (Estimated average requirement %), RNI (Recommended nutrient intake) 2) Pearson correlation coefficient *: p < 0.05, **: p < 0.01


