
Articles
- Page Path
- HOME > Korean J Community Nutr > Volume 17(5); 2012 > Article
-
Original Article
- Anthropometric Index, Dietary Habits and Nutrient Intake of the Oldest-old Population Aged 95 and Over Living in Seoul
- Chung Shil Kwak, Ji Hyun Cho, Miyong Yon, Sang Chul Park
-
Korean Journal of Community Nutrition 2012;17(5):603-622.
DOI: https://doi.org/10.5720/kjcn.2012.17.5.603
Published online: October 31, 2012
Institute on Aging Seoul National University, Seoul, Korea.
1Nutrition Policy Team, Department of Health Industry & Policy, Korea Heallth Industry Development Institute, Osong, Korea.
2Lee Gil Ya Cancer and Diabetes Institute, Gachon University, Incheon, Korea.
- Corresponding author: Chung Shil Kwak, Institute on Aging Seoul National University, 199-1 Dongsoong-Dong, Chongno-Gu, Seoul National University College of Medicine, Annex Building, Seoul 110-510, Korea. Tel: (02) 740-8506, Fax: (02) 742-0628, kwakcs@snu.ac.kr
• Received: July 27, 2012 • Revised: September 18, 2012 • Accepted: September 18, 2012
Copyright © 2012 The Korean Society of Community Nutrition
- 1,911 Views
- 1 Download
- 7 Crossref
Abstract
- The population aged 95 years and older in Seoul approximately increased to five-fold over the past 10 years, while nationwide rates increased to three-fold. In order to examine the dietary habit and nutritional status of oldest-old population living in Seoul, we recruited 87 subjects (25 males and 62 females) aged 95 years and older. The prevalence of underweight (BMI < 18.5 kg/m2) and obesity (BMI ≥ 25 kg/m2) were 18.2% and 18.2% in males, and 20.8% and 9.4% in females, respectively. In self-assessment of health, only 25.3% answered to be unhealthy. More males exercised regularly and reported a wide range of activities than females. The average of %Kcal from carbohydrate, protein and fat (C : P : F) was 64.9 : 13.8 : 21.2 in males and 68.1 : 14.2 : 17.7 in females. The average daily energy intake was 1,307 kcal in males and 1,304 kcal in females. More than 75% of subjects were taking under estimated average requirements (EAR) for vitamin B1, B2 & C and Ca. The average of mean adequacy ratio (MAR) was 0.66 in males and 0.70 in females, and 28.8% of males and 12.9% of females were in MAR < 0.50. Based on MAR, 32.0% of males and 14.5% females were classified as normal and 16.0% of males and 25.8% of females were classified as malnourished. Our subjects were taking more animal food, especially milk and its products, compared to those living, in rural areas. However, a significant proportion did not meet the EAR for vitamin B1, B2 & C and Ca.
-
This work was supported by Seoul city government grant (2009) and the Bio & Medical Technology Development Program of the National Research Foundation (NRF) funded by the Korean government (2009-0093587)
NOTES
- 1. Allard JP, Aghdassi E, McArthue M. Nutrition risk factors for survival in the elderly living in Canadian long-term care facilities. J Am Geriatr Soc. 2004; 52: 59-65.ArticlePubMed
- 2. Amador LF, Al Snih S, Markides KS, Goodwin JS. Weight change and mortality among older Mexican Americans. Aging Clin Exp Res. 2006; 18(3): 196-204.ArticlePubMedPDF
- 3. Arai Y, Hirose N, Nakazawa S, Yamamura K, Shimizu K, Takayama M, Ebihara Y, Osono Y, Homma S. Lipoprotein metabolism in Japanese centenarians : effects of apolipoprotein E polymorphism and nutritional status. J Am Geriatr Soc. 2001; 49: 1434-1441.ArticlePubMedLink
- 4. Baek JW, Koo BK, Kim KJ, Lee YK, Lee SK, Lee HS. Nutritional status of the long-lived elderly people in Kyungpook Sung-Ju area(I)-Estimation of nutrient intakes. Korean J Nutr. 2000; 33(4): 438-445.
- 5. Chan YC, Suzuki M, Yamamoto S. Dietary, anthropometric, hematological and biochemical assessment of the nutritional status of centenarians and elderly people in Okinawa, Japan. J Am Coll Nutr. 1997; 16: 229-235.ArticlePubMed
- 6. Choe JS, Baek HY, Kwon SO. Nutritional status and related factors of residents aged over 50 in longevity areas -I. Anthropometric and biochemical nutritional status. Korean J Nutr. 2004; 37(9): 825-837.
- 7. Choe JS, Kwon SO, Paik HY. Nutritional status and related factors of residents aged over 50 in longevity areas -II. Effect of dietary factors on bone ultrasound measurements in aged men. Korean J Nutr. 2006; 39(2): 171-183.
- 8. Choi JH, Kim MH, Cho MS, Lee HS, Kim WY. The nutritional status and dietary pattern by BMI in Korean elderly. Korean J Nutr. 2002; 35(4): 480-488.
- 9. Choi JH, Kim MH, Cho MS, Lee HS, Kim WY. The nutritional status and dietary pattern by BMI in Korean elderly. Korean J Nutr. 2002; 35(4): 480-488.
- 10. Ennis BW, Saffel-Shrier S, Verson H. Diagnosis malnutrition in the elderly. Nurse Pract. 2001; 26(3): 52-56. 61-62. 65.
- 11. Gaudreau P, Morais JA, Shatenstein B, Gray-Donald K, Khalil A, Dionne I, Ferland G, Flp T, Jacques D, Kergoat MJ, Tessier D, Wagner R, Payette H. Nutrition as a determinant of successful aging: description of the Quebec longitudinal study nuage and results from cross-sectional pilot studies. Rejuvenation Res. 2007; 10(3): 377-386.ArticlePubMed
- 12. Gondo Y, Hirose N, Arai Y, Inagaki H, Masui Y, Yamamura K, Shimizu K, Takayama M, Ebihara Y, Nakazawa S, Kitagawa K. Functional status of centenarians in Tokyo, Japan: developing better phenotypes of exceptional longevity. J Gerontol A Biol Sci Med Sci. 2006; 61(3): 305-310.ArticlePubMed
- 13. Guerin O, Soto ME, Brocker P, Robert PH, Benoit M, Vellas B. Nutritional status assessment during Alzhemier's disease: results after one year. J Nutr Health Aging. 2005; 9: 81-84.PubMed
- 14. Guigoz Y. The mini-nutrition assessment (MNA) review of the literlature-What dose it tell us? J Nutr Health Aging. 2006; 10(6): 466-485.PubMed
- 15. Guthrie HA, Scheer JC. Validity of a dietary score for assessing nutrient adequacy. J Am Diet Assoc. 1981; 78: 240-245.ArticlePubMed
- 16. Hansen RG. An index of food quality. Nutr Rev. 1973; 31(1): 1-7.ArticlePubMed
- 17. Hansen RG, Wyse BW. Expression of nutrient allowances per 1,000 kcal. J Am Diet Assoc. 1980; 76(3): 223-227.PubMed
- 18. Hausman DB, Fischer JG, Johnson MA. Nutrition in centenarians. Maturitas. 2011; 68: 203-209.ArticlePubMed
- 19. Hwang JY, Ru SY, Ryu HK, Park HJ, Kim WY. Socioeconomic factors relating to obesity and inadequate nutrient intake in women in low income families residing in Seoul. Korean J Nutr. 2009; 42(2): 171-182.Article
- 20. KCDCP, Korea Center for Disease Control and Prevention. 2009 National Health Statistics-Korea national health and nutrition examination survey. 2010; retrieved Jul. 5, 2012. from http://knhanes.cdc.go.kr.
- 21. KCDCP, Korea Center for Disease Control and Prevention. 2010 National Health Statistics-Korea national health and nutrition examination survey. 2011; retrieved Jul. 23, 2012. from http://knhanes.cdc.go.kr.
- 22. Keller HH, Østbye T, Goy R. Nutritional risk predicts quality of life in elderly community-dwelling Canadians. J Gerontol A Biol Sci Med Sci. 2004; 59: 68-74.PubMed
- 23. Kim YK, Lee HO, Chang R, Choue R. A study on food habits, nutrient intake and the disease distribution in the elderly (aged over 65 years) (I). Korean J Community Nutr. 2002; 7(4): 516-526.
- 24. Korean Nutrition Society. Dietary reference intakes for Koreans. 2010; First revision. Seoul: Hanarum publishing.
- 25. Krebs-Smith SM, Wright HS, Guthrie HA, Krebs-Smith J. The effects of variety in food choices on dietary quality. J Am Diet Assoc. 1987; 87(7): 897-903.ArticlePubMed
- 26. Kwak CS, Yon M, Lee MS, Oh SI, Park SC. Comparison of anthropometric index and nutrient intake in Korean aged 50 plus years living in longevity-belt region. Korean J Community Nutr. 2010; 15(3): 308-328.
- 27. Kwon IS, Kim CH, Ko HS, Cho SI, Choi YH, Park SC. Risk factors of cardiovascular disease in Korean exceptional longevity. J Korean Geriatr Soc. 2005; 9(4): 251-265.
- 28. Kwon IS, Park SC. Gender-specific and age-dependent changes in health status and medical characteristics of Korean centenarians. Korean J Gerontol. 2005; 15(3): 10-25.
- 29. Lee MS. Nutritional status of the nanogerian population in longevity belt in Korea. Korean J Community Nutr. 2005; 10(3): 290-302.
- 30. Lee MS. Nutritional status of the oldest-elderly population in Soonchang county. Korean J Community Nutr. 2009; 14(3): 255-265.
- 31. Lee MS, Eui EJ, Kwak CS, Kim K, Choi YH, Kwon IS, Kim CH, Park SC. Gender difference in health and nutritional status of Korean centenarians. Korean J Gerontol. 2005; 15(3): 65-75.
- 32. Lim YJ, Choi YS. Dietary behaviors and seasonal diversity of food intakes od elderly women living as compared to those living with family in Gyeongbuk rural area. Korean J Community Nutr. 2008; 13(5): 620-629.
- 33. Yim KS, Lee TY. Socioedemographie factors associated with nutrients intake of elderly in Korea. Korean J Nutr. 2004; 37(3): 210-222.
- 34. Newman AB, Yanez D, Harris T, Duxbury A, Enright PL, Fried LP. Weight change in old age and its association with mortality. J Am Geriatr Soc. 2001; 49(10): 1309-1318.ArticlePubMed
- 35. Ozaki A, Uchiyama M, Tagaya H, Ohida T, Ogihara R. The Japanese centenarians study : Autonomy was associated with health practices as well as physical status. J Am Geriatr Soc. 2007; 55: 95-101.PubMed
- 36. Park MY, Kim GR, Lee DJ, Kim JM, Park PS. A survey of food and nutrient intakes of the aged people in rural area, Gyeongbook Yecheon. Korean J Nutr. 2006; 39(1): 58-73.
- 37. Park SC. Korean centenarians. 2002; Seoul: Seoul National University Press.
- 38. Park SC, Lee JJ, Park SO, Han KH, Lee MS, Kwon IS. Report of the study on characteristics of long-lived population in Kangwon province. 2004; Seoul National University.
- 39. Park SC, Lee MS, Kwon IS, Kwak CS, Yeo EJ. Environment and gender influences on the nutritional and health status of Korean centenarians. Asian J Gerontol Geriatr. 2008; 3(2): 75-83.
- 40. Shimizu K, Takeda S, Noji H, Hirose N, Ebihara Y, Arai Y, Hamamatsu M, Nakazawa S, Gondo Y, Konishi K. Dietary patterns and further survival in Japanese centenarians. J Nutr Sci Vitaminol. 2003; 49(2): 133-138.ArticlePubMed
- 41. Somes GW, Kritchevsky SB, Shorr RI, Pahor M, Applegate WB. Body mass index, weight change and death in older adults: the systolic hypertention in the elderly program. Am J Epidemiol. 2002; 156: 132-138.PubMed
- 42. Sorenson AW, Wyse BW, Wittwer AJ, Hansen RG. An index of nutritional quality for a balanced diet. New help for an old problem. J Am Diet Assoc. 1976; 68(3): 236-242.PubMed
- 43. Statistics Korea. 2011; cited 2012 March. Available from http://kosis.go.kr/portal/korea/index.action.
- 44. Takeda S, Noji H, Hirose N, Arai Y, Yamamura K, Shimizu K, Homma S, Ebihara Y, Takayama M. Nutritional intake by the oldest elderly Japanese. Tokyo Centenarian Study 6. Nippon Ronen Igakkai Zasshi. 1998; 35(7): 548-558.ArticlePubMed
- 45. Thomas DR, Ashmen W, Morley JE, Evans WJ. Nutritional management in long-term care: development of a clinical guideline. Council for nutritional strategies in long-term care. J Gerontol A Biol Sci Med Sci. 2000; 55(12): M725-M734.PubMed
- 46. Vellas B, Guigoz Y, Baumgartner M, Garry PJ, Lauque S, Albarede JL. Relationships between nutritional markers and the mini-nutritional assessment in 155 older persons. J Am Geriatr Soc. 2000; 48(10): 1300-1309.ArticlePubMed
- 47. Vellas B, Lauque S, Gillette-Guyonnet S, Andrieu S, Cortes F, Nourhashmi F, Cantet C, Ousset PJ, Grandjean H. The REAL FR group. Impact of nutritional status on the evolution of Alzheimer's disease and on response to acetylcholinesterase inhibitor treatment. J Nutr Health Aging. 2005; 9: 75-80.PubMed
- 48. Vellas B, Villars H, Abellan G, Soto ME, Rolland Y, Guigoz Y, Morley JE, Chumlea W, Salva A, Rubenstein LZ, Garry P. Overview of the MNA - Its history and challenges. J Nutr Health Aging. 2006; 10(6): 456-465.PubMed
- 49. Yang EJ, Bang HM. Nutritional status and health risks of low income elderly women in Gwangju area. Korean J Nutr. 2008; 41(1): 65-76.
REFERENCES
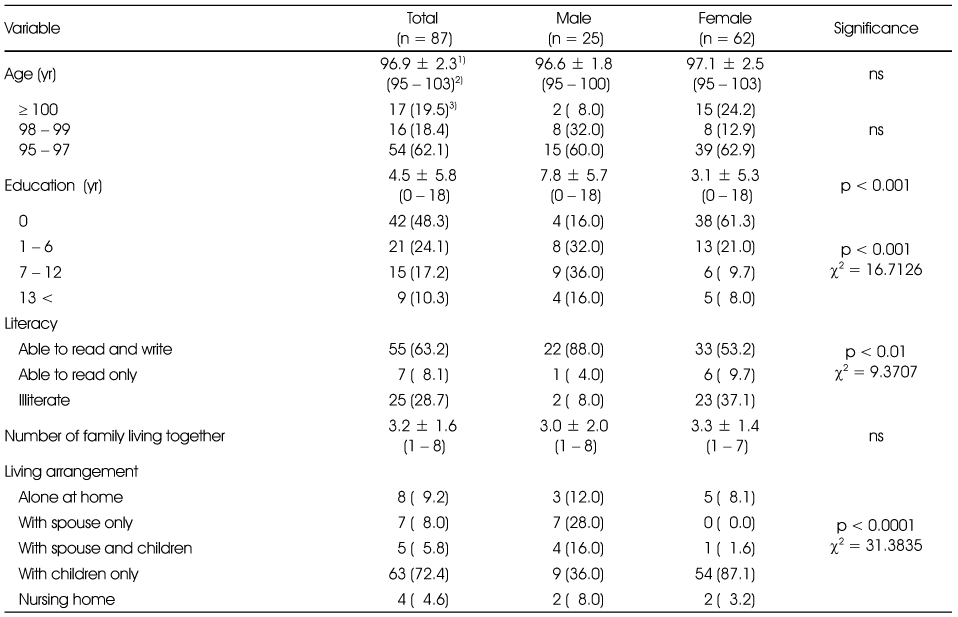
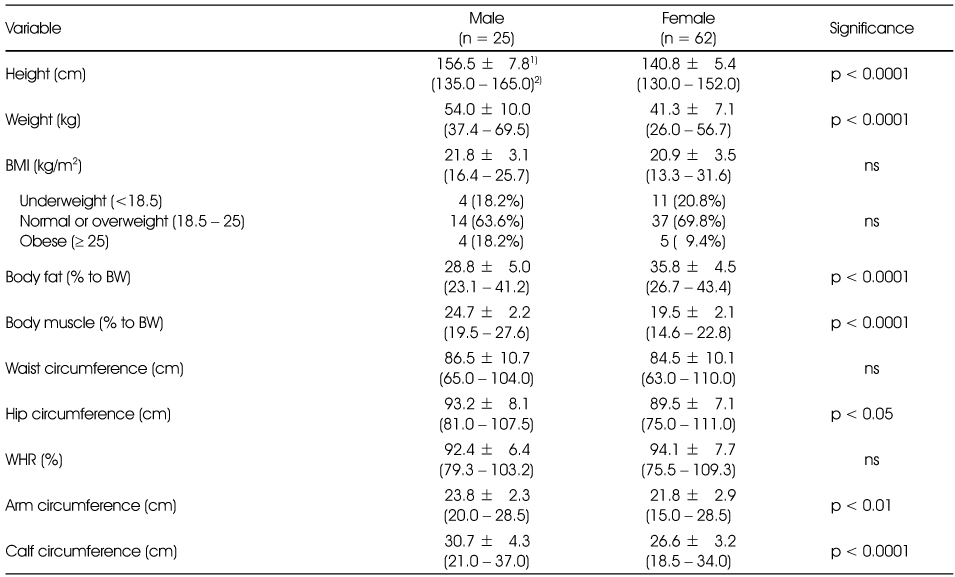
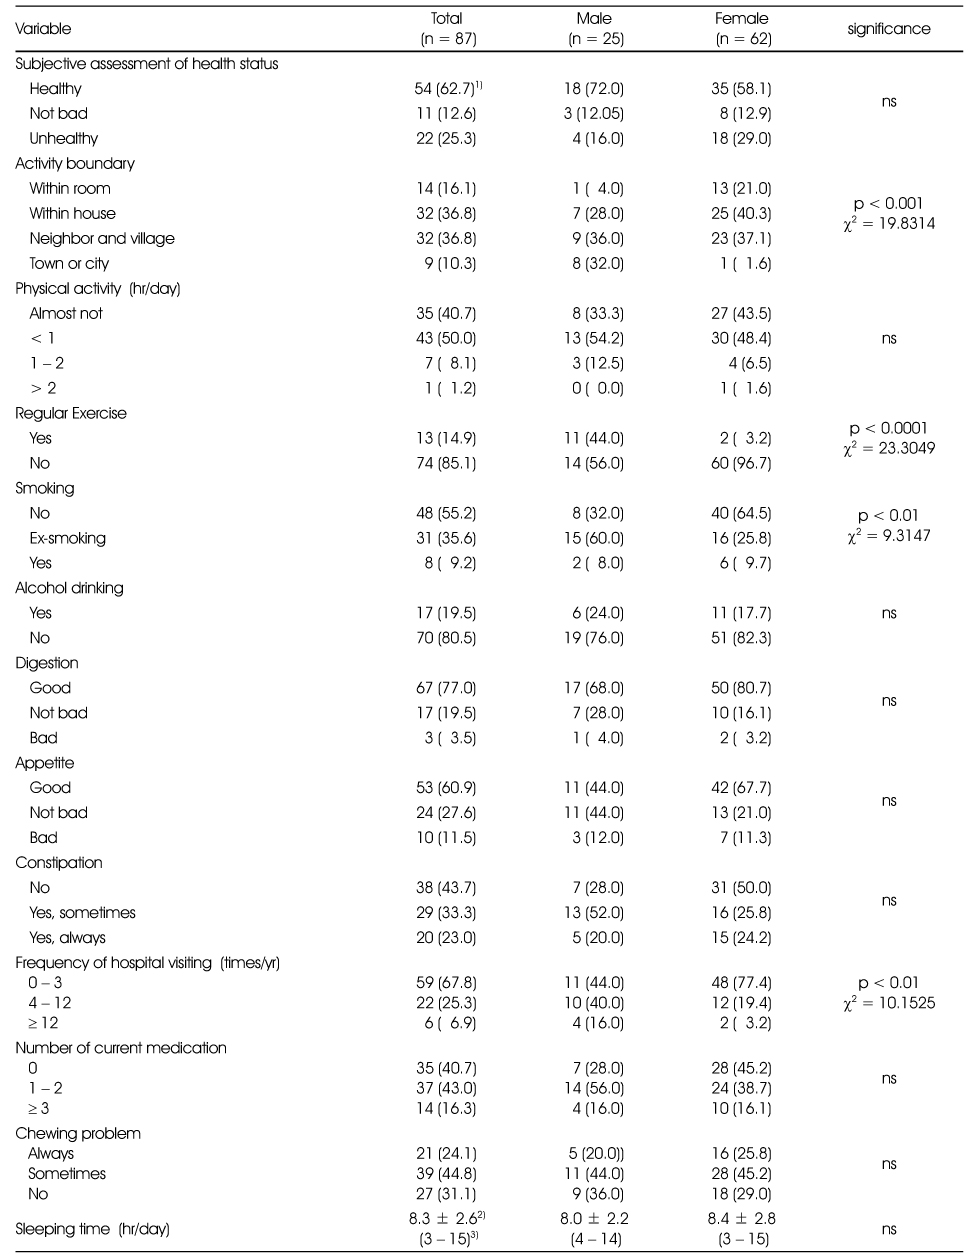
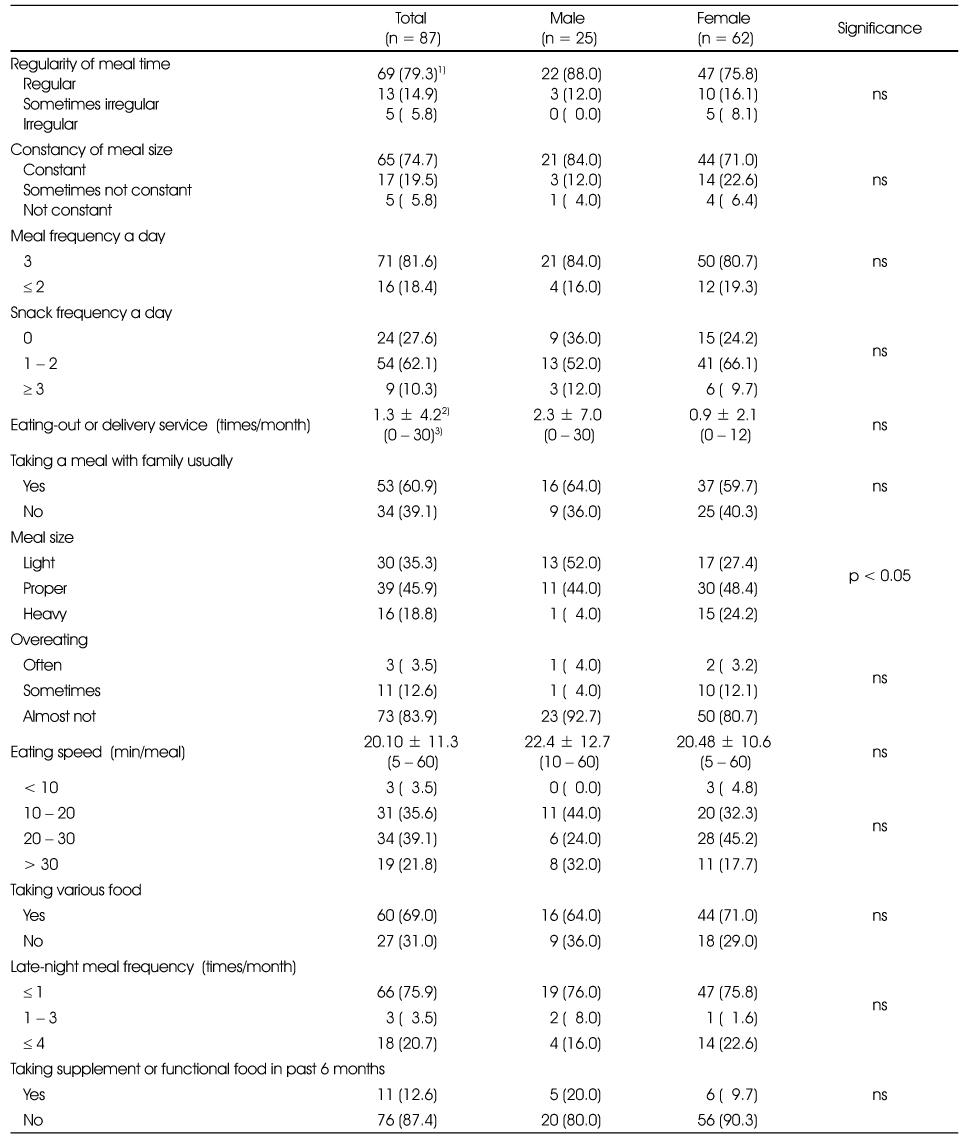
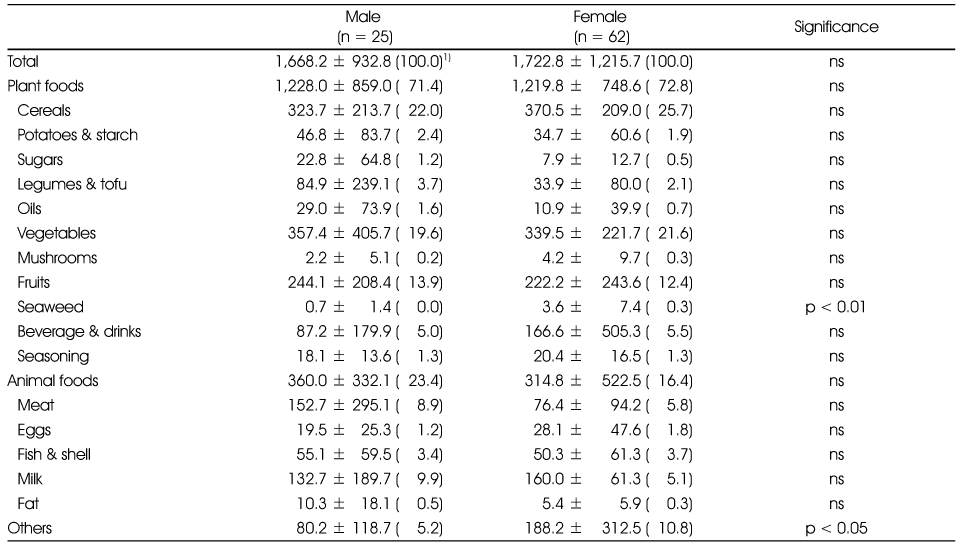
Table 6The average daily nutrient intake of subjects
1) Korean National Health and Nutrition Examination Survey in 2010 (KCDCP 2011)
2) Study on nutritional status of elderly aged 85 and more living in Soonchang-gun (Lee 2009)
3) male (n) / female (n), 4) Mean ± SD, 5) Mean for males/females
*: significantly different between gender at p < 0.05
Table 7Percent EER and RI of nutrient intake of subjects
1) Korean National Health and Nutrition Examination Survey in 2010 (KCDCP 2011)
2) Study on nutritional status of elderly aged 85 and more living in Soonchang-gun (Lee 2009)
3) male (n) / female (n), 4) mean for males/females, 5) Mean ± SD
**: Significantly different between gender at p < 0.01
Table 8Prevalence of nutrient intake under EAR
1) Korean National Health and Nutrition Examination Survey in 2010 (KCDCP 2011)
2) male (n) / female (n), 3) under 75% EER, 4) N (%), 5) mean for males/females, 6) Mean ± SD
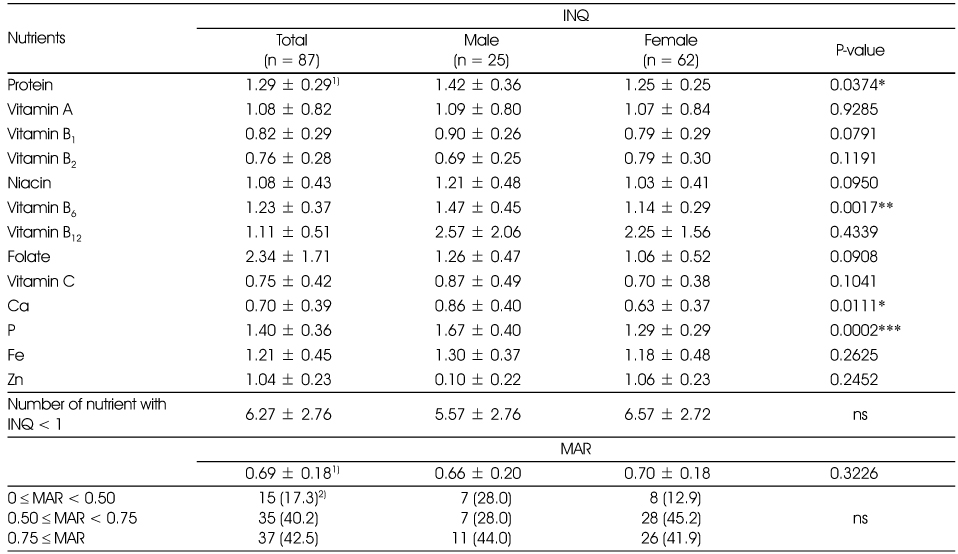
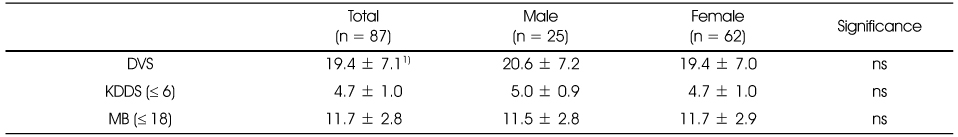
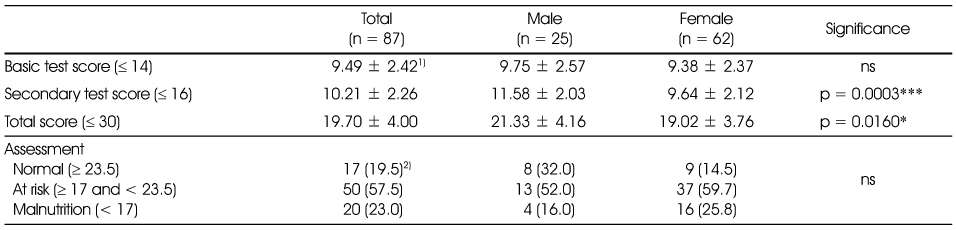
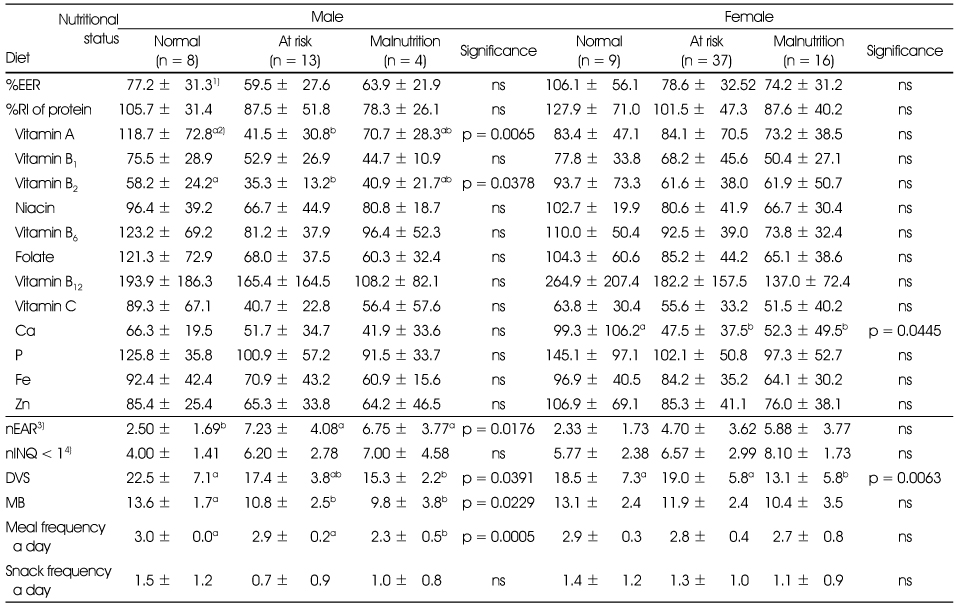
Figure & Data
REFERENCES
Citations
Citations to this article as recorded by 
- Dietary habits of Koreans aged 95 years and older residing in rural and metropolitan areas
Jieun Mun, Sein Kim, Suyoung Kim, Seunghee Kim, Sang Chul Park, Jae-Young Han, Kwangsung Park, Clara Yongjoo Park
Nutrition Research and Practice.2025; 19(1): 66. CrossRef - Association of Dietary Quality with Subjective Health-Related Perception and Chronic Diseases According to Age Segmentation of Korean Elderly
Sojeong Lee, Seungmin Lee
Korean Journal of Community Nutrition.2021; 26(5): 363. CrossRef - Commentary for the Elderly in the Pandemic Era
Asif Khattak, Badar Kanwar, Consolato Sergi, Chul Joong Lee, Jenny Balentine, Jong-Hoon Lee, Jungwuk Park, So Jeong Lee, Su-Hee Choi
Dementia and Geriatric Cognitive Disorders Extra.2021; 11(2): 168. CrossRef - Status of health and nutritional intake of the elderly in long-term care facilities: focus on Gwangju Metropolitan City
Gyusang Han, Eunju Yang
Journal of Nutrition and Health.2020; 53(1): 27. CrossRef - Study on Energy and Nutrient Intake and Food Preference of the Elderly in Care Facilities
Jong-Sook Kwon, Seung Hee Lee, Kang Min Lee, Yoonna Lee
Korean Journal of Community Nutrition.2016; 21(2): 200. CrossRef - A study on the Needs for Nutrition Management Program for Elderly Who use Welfare Facilities
Min-June Lee, Jung-Hyun Kim, Ok-Jin Park, Young-Mi Lee
Korean Journal of Community Nutrition.2016; 21(1): 65. CrossRef - The Prevalence of Obesity by Percentage of Body Fat, Waist Circumference, and Body Mass Index and Their Association with Prevalence of Chronic Diseases of Elderly in Seoul Area
Min Jeong Kang, Jung Young Park, Jung Yun Kim, Yeon Joo Lee, Min Hee Do, Sang Sun Lee
The Korean Journal of Food And Nutrition.2014; 27(3): 358. CrossRef
 Cite
CiteAnthropometric Index, Dietary Habits and Nutrient Intake of the Oldest-old Population Aged 95 and Over Living in Seoul
Anthropometric Index, Dietary Habits and Nutrient Intake of the Oldest-old Population Aged 95 and Over Living in Seoul
General characteristics of subjects
1) Mean ± SD, 2) range (min-max), 3) N (%)
Physical measurement
1) Mean ± SD, 2) range (min-max), ns: not significant
Health status and life style
1) N (%), 2) Mean ± SD, 3) range (min-max), ns: not significant
Dietary behavior
1) N (%), 2) Mean ± SD, 3) range (min-max), ns: not significant
Average daily food intake (g/day)
1) Mean ± SD (%)
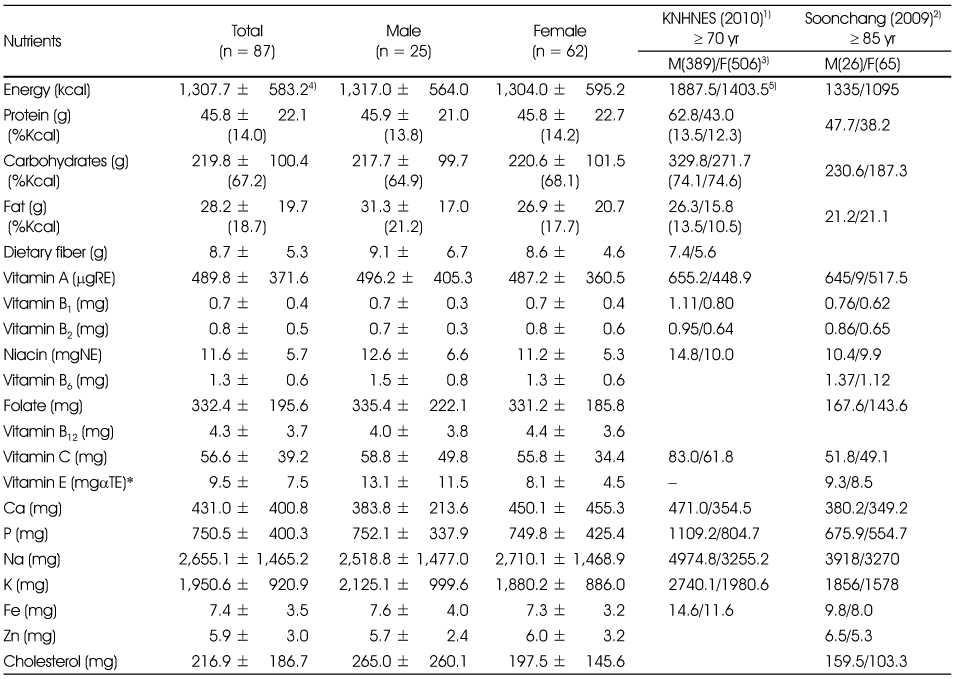
The average daily nutrient intake of subjects
1) Korean National Health and Nutrition Examination Survey in 2010 (KCDCP 2011)
2) Study on nutritional status of elderly aged 85 and more living in Soonchang-gun (Lee 2009)
3) male (n) / female (n), 4) Mean ± SD, 5) Mean for males/females
*: significantly different between gender at p < 0.05
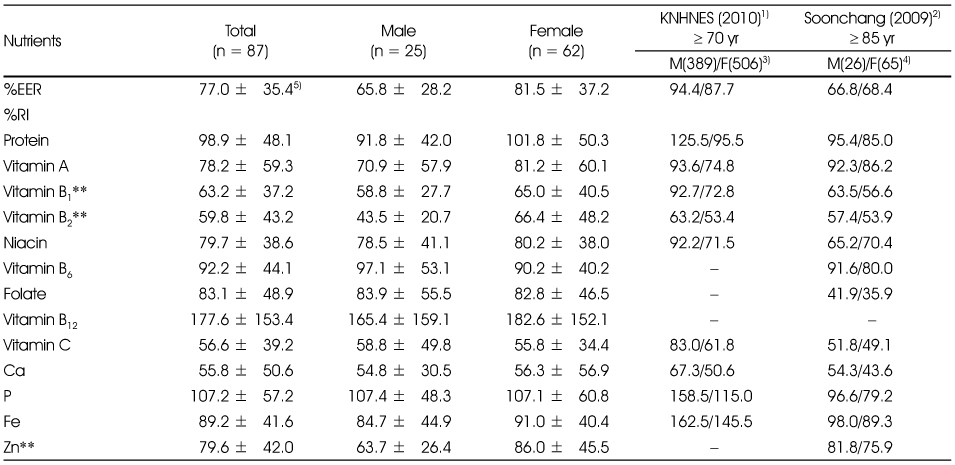
Percent EER and RI of nutrient intake of subjects
1) Korean National Health and Nutrition Examination Survey in 2010 (KCDCP 2011)
2) Study on nutritional status of elderly aged 85 and more living in Soonchang-gun (Lee 2009)
3) male (n) / female (n), 4) mean for males/females, 5) Mean ± SD
**: Significantly different between gender at p < 0.01
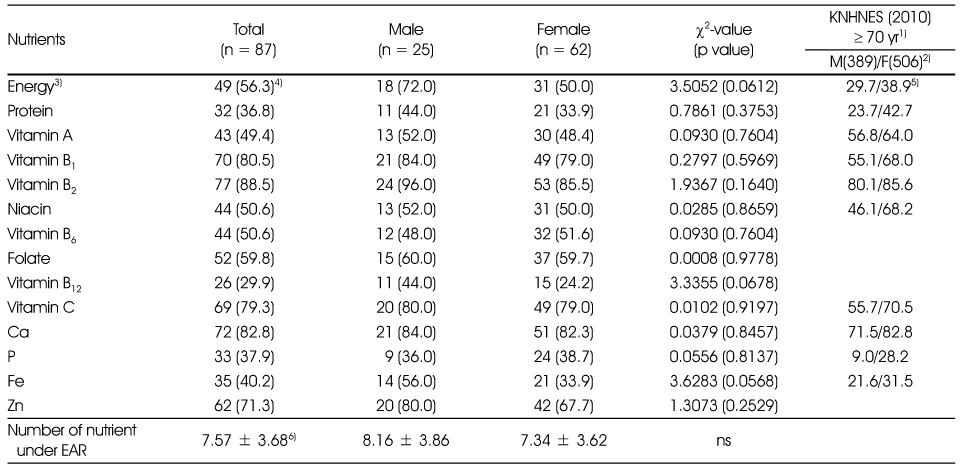
Prevalence of nutrient intake under EAR
1) Korean National Health and Nutrition Examination Survey in 2010 (KCDCP 2011)
2) male (n) / female (n), 3) under 75% EER, 4) N (%), 5) mean for males/females, 6) Mean ± SD
Index of Nutrient Quality (INQ) and Man Adequacy Ratio (MAR)
1) Mean ± SD, 2) N (%), ns: not significant
Significantly different between gender at *: p < 0.05, **: p < 0.01 or ***: p < 0.001
Food intake diversity and meal balance
1) Mean ± SD, ns: not significant
Mini-Nutrition Assessment (MNA) of subjects
1) Mean ± SD, 2) N (%), ns: not significant
significantly different between gender at p < 0.05* or p < 0.001***
Nutrient intake and dietary factors according to nutritional status assessed by MNA
1) Mean ± SD, 2) means without common alphabet are significantly different each other within a same gender.
3) nEAR: number of nutrient under EAR, 4) nINQ < 1: number of nutrient with INQ < 1
Table 1
General characteristics of subjects
1) Mean ± SD, 2) range (min-max), 3) N (%)
Table 2
Physical measurement
1) Mean ± SD, 2) range (min-max), ns: not significant
Table 3
Health status and life style
1) N (%), 2) Mean ± SD, 3) range (min-max), ns: not significant
Table 4
Dietary behavior
1) N (%), 2) Mean ± SD, 3) range (min-max), ns: not significant
Table 5
Average daily food intake (g/day)
1) Mean ± SD (%)
Table 6
The average daily nutrient intake of subjects
1) Korean National Health and Nutrition Examination Survey in 2010 ( 2) Study on nutritional status of elderly aged 85 and more living in Soonchang-gun ( 3) male (n) / female (n), 4) Mean ± SD, 5) Mean for males/females *: significantly different between gender at p < 0.05
Table 7
Percent EER and RI of nutrient intake of subjects
1) Korean National Health and Nutrition Examination Survey in 2010 ( 2) Study on nutritional status of elderly aged 85 and more living in Soonchang-gun ( 3) male (n) / female (n), 4) mean for males/females, 5) Mean ± SD **: Significantly different between gender at p < 0.01
Table 8
Prevalence of nutrient intake under EAR
1) Korean National Health and Nutrition Examination Survey in 2010 ( 2) male (n) / female (n), 3) under 75% EER, 4) N (%), 5) mean for males/females, 6) Mean ± SD
Table 9
Index of Nutrient Quality (INQ) and Man Adequacy Ratio (MAR)
1) Mean ± SD, 2) N (%), ns: not significant Significantly different between gender at *: p < 0.05, **: p < 0.01 or ***: p < 0.001
Table 10
Food intake diversity and meal balance
1) Mean ± SD, ns: not significant
Table 11
Mini-Nutrition Assessment (MNA) of subjects
1) Mean ± SD, 2) N (%), ns: not significant significantly different between gender at p < 0.05* or p < 0.001***
Table 12
Nutrient intake and dietary factors according to nutritional status assessed by MNA
1) Mean ± SD, 2) means without common alphabet are significantly different each other within a same gender. 3) nEAR: number of nutrient under EAR, 4) nINQ < 1: number of nutrient with INQ < 1


