
Articles
- Page Path
- HOME > Korean J Community Nutr > Volume 23(5); 2018 > Article
-
Research Article
- Comparison of Dietary Behaviors and Blood Clinical Indices in Underweight, Normal Weight, Normal Weight Obese and Obese Female College Students
-
Su Bin Lee, Jung Hee Kim

-
Korean Journal of Community Nutrition 2018;23(5):431-443.
DOI: https://doi.org/10.5720/kjcn.2018.23.5.431
Published online: October 31, 2018
1Graduate School of Seoul Women's University, Seoul, Korea, Student.
2Department of Food and Nutrition, Seoul Women's University, Seoul, Korea, Professor.
- Corresponding author: Jung Hee Kim. Department of Food and Nutrition, College of Natural Sciences, Seoul Women's University, 621 Hwarangno, Nowon-gu, Seoul 139-774, Korea. Tel: (02) 970-5646, Fax: (02) 976-4049, jheekim@swu.ac.kr
• Received: August 25, 2018 • Revised: September 26, 2018 • Accepted: September 26, 2018
Copyright © 2018 The Korean Society of Community Nutrition
This is an Open-Access article distributed under the terms of the Creative Commons Attribution Non-Commercial License (http://creativecommons.org/licenses/by-nc/3.0/) which permits unrestricted non-commercial use, distribution, and reproduction in any medium, provided the original work is properly cited.
- 1,834 Views
- 7 Download
- 2 Crossref

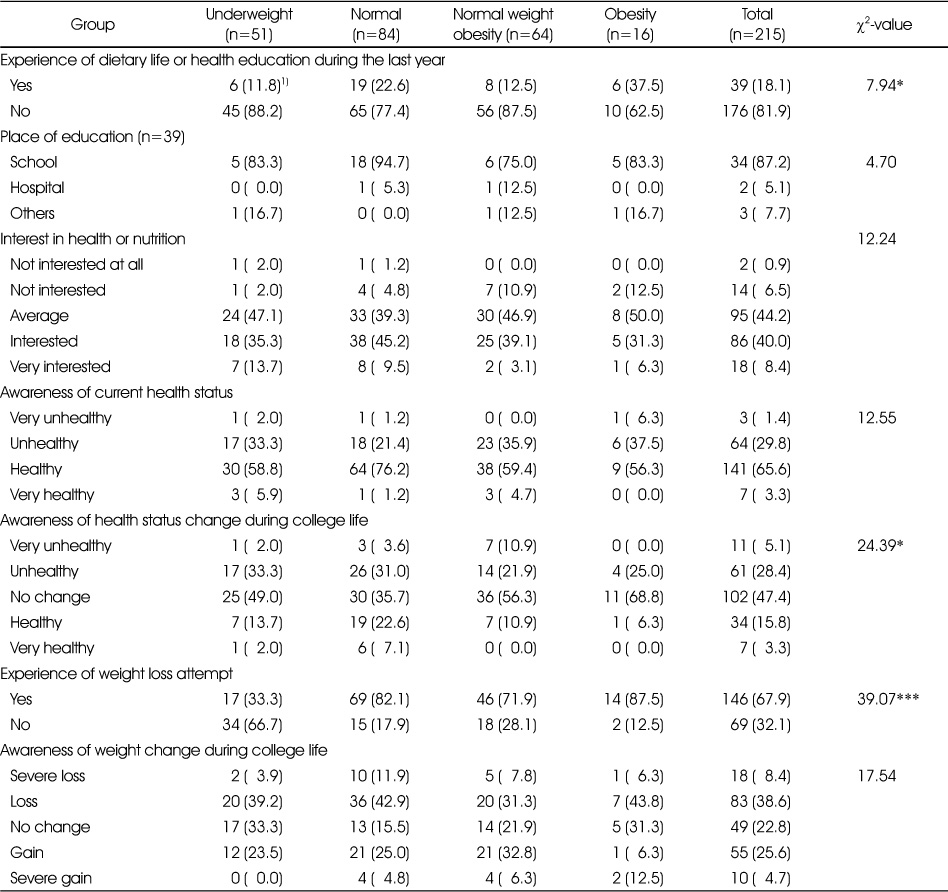


Figure & Data
REFERENCES
Citations
Citations to this article as recorded by 
- A study on the perception of hand washing and health status in Korean adults
Soohee Park
Medicine.2021; 100(3): e24421. CrossRef - Gender Differences and Relationships among Lifestyle and Reproductive Health in University Students
Ju-Hee Nho, Hee Sun Kim
Korean Journal of Women Health Nursing.2019; 25(4): 446. CrossRef
 Cite
CiteComparison of Dietary Behaviors and Blood Clinical Indices in Underweight, Normal Weight, Normal Weight Obese and Obese Female College Students
Comparison of Dietary Behaviors and Blood Clinical Indices in Underweight, Normal Weight, Normal Weight Obese and Obese Female College Students
Anthropometric indices of subjects
Underweight: BMI < 18.5 kg/m2, Normal: 18.5 kg/m2 ≤ BMI < 25 kg/m2, body fat percentage < 30%
Normal weight obesity: 18.5 kg/m2 ≤ BMI < 25 kg/m2, body fat percentage ≥ 30%, Obesity: BMI ≥ 25 kg/m2
1) Mean ± SD
a, b, c, d: Means with different superscript letters are significantly different at p<0.05 among 4 groups by ANOVA and Duncan's multiple range test
Interest in health and weight loss of subjects
Underweight: BMI < 18.5 kg/m2, Normal: 18.5 kg/m2 ≤ BMI < 25 kg/m2, body fat percentage < 30%
Normal weight obesity: 18.5 kg/m2 ≤ BMI < 25 kg/m2, body fat percentage ≥ 30%, Obesity: BMI ≥ 25 kg/m2
1) Number of subjects, ( ): % of subjects
*: Significantly different at p<0.05 by chi-square test
Dietary behaviors of subjects
Underweight: BMI < 18.5 kg/m2, Normal: 18.5 kg/m2 ≤ BMI < 25 kg/m2, body fat percentage < 30%
Normal weight obesity: 18.5 kg/m2 ≤ BMI < 25 kg/m2, body fat percentage ≥ 30%, Obesity: BMI ≥ 25 kg/m2
1) Mean ± SD
2) Number of subjects, ( ): % of subjects
*, ***: Significantly different at p<0.05, p<0.001 by chi-square test
Food consumption frequency of subjects
Underweight: BMI < 18.5 kg/m2, Normal: 18.5 kg/m2 ≤ BMI < 25 kg/m2, body fat percentage < 30%
Normal weight obesity: 18.5 kg/m2 ≤ BMI < 25 kg/m2, body fat percentage ≥ 30%,Obesity: BMI ≥ 25 kg/m2
1) Number of subjects, ( ): % of subjects ,**: Significantly different at p<0.01 by chi-square test
Serum clinical indices of subjects
Underweight: BMI < 18.5 kg/m2, Normal: 18.5 kg/m2 ≤ BMI < 25 kg/m2, body fat percentage < 30%
Normal weight obesity: 18.5 kg/m2 ≤ BMI < 25 kg/m2, body fat percentage ≥ 30%, Obesity: BMI ≥ 25 kg/m2
1) Mean ± SD
a, b C: Means with different superscript letters are significantly different at p<0.05 among 4 groups by ANOVA and Duncan's multiple range test
Table 1
Anthropometric indices of subjects
Underweight: BMI < 18.5 kg/m2, Normal: 18.5 kg/m2 ≤ BMI < 25 kg/m2, body fat percentage < 30% Normal weight obesity: 18.5 kg/m2 ≤ BMI < 25 kg/m2, body fat percentage ≥ 30%, Obesity: BMI ≥ 25 kg/m2 1) Mean ± SD a, b, c, d: Means with different superscript letters are significantly different at p<0.05 among 4 groups by ANOVA and Duncan's multiple range test
Table 2
Interest in health and weight loss of subjects
Underweight: BMI < 18.5 kg/m2, Normal: 18.5 kg/m2 ≤ BMI < 25 kg/m2, body fat percentage < 30% Normal weight obesity: 18.5 kg/m2 ≤ BMI < 25 kg/m2, body fat percentage ≥ 30%, Obesity: BMI ≥ 25 kg/m2 1) Number of subjects, ( ): % of subjects *: Significantly different at p<0.05 by chi-square test
Table 3
Dietary behaviors of subjects
Underweight: BMI < 18.5 kg/m2, Normal: 18.5 kg/m2 ≤ BMI < 25 kg/m2, body fat percentage < 30% Normal weight obesity: 18.5 kg/m2 ≤ BMI < 25 kg/m2, body fat percentage ≥ 30%, Obesity: BMI ≥ 25 kg/m2 1) Mean ± SD 2) Number of subjects, ( ): % of subjects *, ***: Significantly different at p<0.05, p<0.001 by chi-square test
Table 4
Food consumption frequency of subjects
Underweight: BMI < 18.5 kg/m2, Normal: 18.5 kg/m2 ≤ BMI < 25 kg/m2, body fat percentage < 30% Normal weight obesity: 18.5 kg/m2 ≤ BMI < 25 kg/m2, body fat percentage ≥ 30%,Obesity: BMI ≥ 25 kg/m2 1) Number of subjects, ( ): % of subjects ,**: Significantly different at p<0.01 by chi-square test
Table 5
Serum clinical indices of subjects
Underweight: BMI < 18.5 kg/m2, Normal: 18.5 kg/m2 ≤ BMI < 25 kg/m2, body fat percentage < 30% Normal weight obesity: 18.5 kg/m2 ≤ BMI < 25 kg/m2, body fat percentage ≥ 30%, Obesity: BMI ≥ 25 kg/m2 1) Mean ± SD a, b C: Means with different superscript letters are significantly different at p<0.05 among 4 groups by ANOVA and Duncan's multiple range test


