Articles
- Page Path
- HOME > Korean J Community Nutr > Volume 16(3); 2011 > Article
-
Original Article
- The Housewives' Purchase Behaviors on Environment-friendly Agricultural Products in Daejeon Area
- In-Jung Kim, Joon-Ho Lee
-
Korean Journal of Community Nutrition 2011;16(3):386-397.
DOI: https://doi.org/10.5720/kjcn.2011.16.3.386
Published online: June 30, 2011
Department of Consumers' Life Information, Chungnam National University, Daejeon, Korea.
- Corresponding author: Joon-Ho Lee, Department of Consumers' Life Information, Chungnam National University, 99 Daehangno, Yuseong-gu, Daejeon 305-764, Korea. Tel: (042) 821-6847, Fax: (042) 821-8887, joonho@cnu.ac.kr
Copyright © 2011 The Korean Society of Community Nutrition
- 1,303 Views
- 1 Download
- 8 Crossref
Figure & Data
REFERENCES
Citations

- Sustainability transitions in agri-food systems: insights from South Korea’s universal free, eco-friendly school lunch program
Jennifer E. Gaddis, June Jeon
Agriculture and Human Values.2020; 37(4): 1055. CrossRef - Perception of Use of Environment-friendly Agricultural Products during School Foodservice of Mothers of Elementary School Students in Gyeonggi
Young-Un An, Myung-Hee Kim, Mi-Kyeong Choi, Mi-Hyun Kim
Korean Journal of Community Nutrition.2018; 23(3): 234. CrossRef - Factors Influencing the Purchase Intention of Environment-Friendly Agricultural Products for Mothers with Elementary School Children
Xiang Li, Dong-Yean Park
The Korean Journal of Community Living Science.2018; 29(1): 97. CrossRef - Perception and Purchase Behavior on Environment-friendly Agricultural Products of College Students in Daejeon
Yu-Jin Cho, Nan-Sook Koo
Korean journal of food and cookery science.2015; 31(3): 328. CrossRef - Perception of School Foodservice Using of Environmentally Friendly Agricultural Products of Elementary School Parents in Jeonnam
Hee-Sook Cho, Kyung-Hee Kim
Journal of The Korean Society of Food Culture.2014; 29(6): 577. CrossRef - A Study of Food Habit and Food Purchase Behavior on Healthy Dietary Life by Housewives in Daejeon
Ji Hyun Yu, Nan Sook Koo
Korean Journal of Human Ecology.2013; 22(2): 375. CrossRef - Middle School Students' Perception of Environment-friendly Agricultural Products (EAPs) and the Degree of Confidence about the Certification Mark in Daegu
Ji-Yeon Jang, Mi-Kyung Choi
Korean Journal of Community Nutrition.2013; 18(4): 324. CrossRef - A Study on the Pattern of Consumption Behavior of Environmentally-friendly Agricultural Products by Housewives and an Assessment of the Need for Environmentally-friendly Agricultural Products in Childcare Centers in Jeonju
Jeong-Ok Rho, Hyun-Jin Kim
The Korean Journal of Food And Nutrition.2012; 25(2): 215. CrossRef
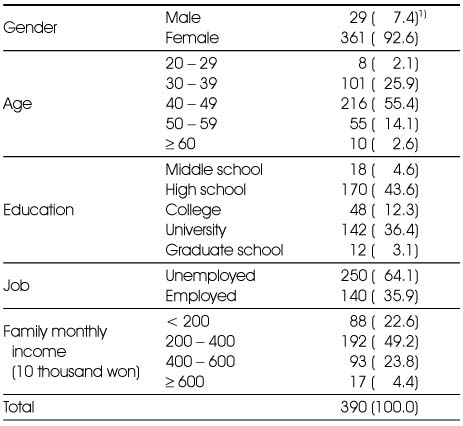
General characteristics of the subjects
1) N (%)
Purchased experience of environment-friendly agricultural products
1) N (%)
Reasons on purchasing environment-friendly agricultural products
1) N (%)
Reasons on non-purchasing environment-friendly agricultural products1)
1) Multiple response, 2) N (%)
(Total N = 90)
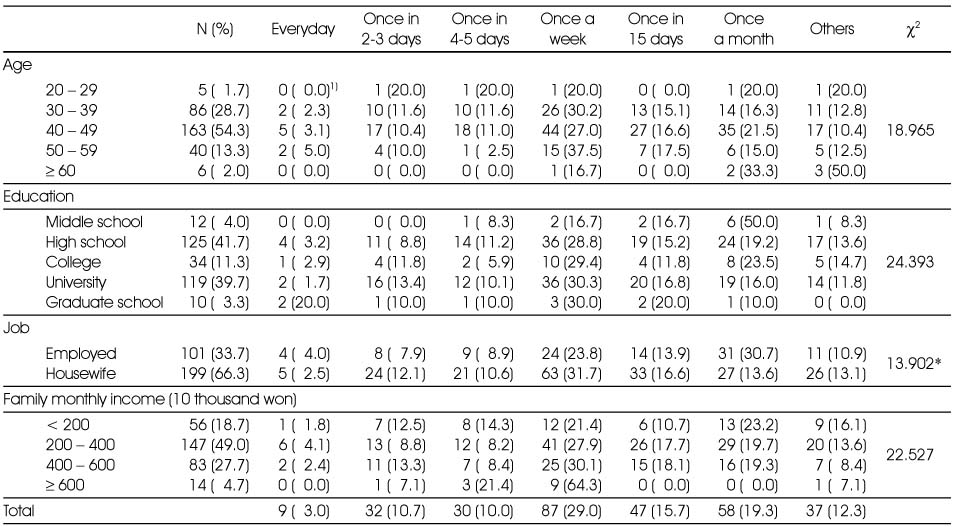
Purchasing frequencies of environment-friendly agricultural products
1) N (%), *: p < 0.05
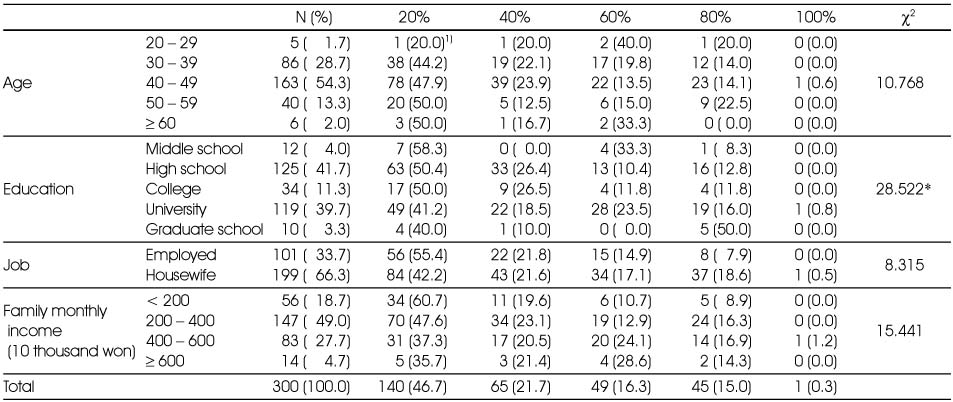
Purchasing ratio of environment-friendly agricultural products among total agricultural products
1) N (%), *: p < 0.05
Purchasing cost of environment-friendly agricultural products per month (unit : Won)
1) N (%), **: p < 0.01, ***: p < 0.001
Purchasing frequencies of environment-friendly agricultural products's food groups
1) N (%)
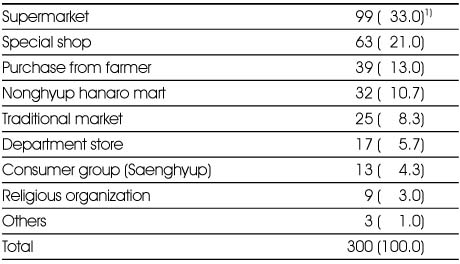
Purchasing place of environment-friendly agricultural products
1) N (%)
Choosing factors of purchasing place1)
1) Multiple response, 2) N (%)
(Total N=300)
The most considerable factors on purchasing environment-friendly agricultural products
1) N (%) *: p < 0.05, ***: p < 0.001
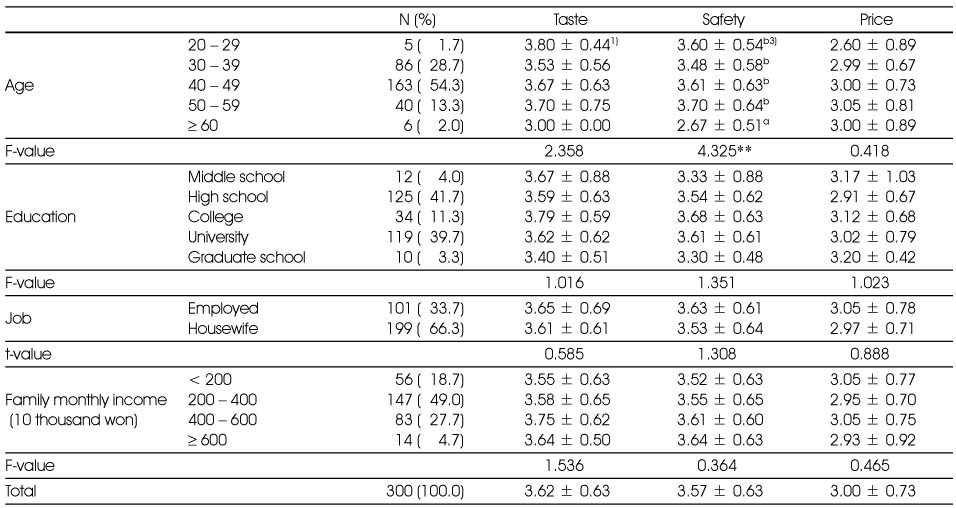
The housewives' satisfaction on taste, safety and price of environment-friendly agricultural products2)
1) Mean ± SD, **: p < 0.01
2) 5 points Likert scale: 'Very satisfied' (5 points) ~ 'Very dissatisfied' (1 point)
3) Different superscripts in the same column mean significant differences among groups by Duncan's multiple range test (p < 0.05)
Checking on environment-friendly agricultural products labeling2)
1) Mean ± SD, *: p < 0.05, **: p < 0.01
2) 4 points Likert scale : 'Always check' (4 points) ~ 'Almost not check' (1 point)
3) Different superscripts in the same column mean significant differences among groups by Duncan's multiple range test (p < 0.05)
The purchasing intention of environment-friendly agricultural products at hereafter
1) N (%), **: p < 0.01
The improvement factors for consumption promotion of environment-friendly agricultural products
1) N (%)
1) N (%)
1) N (%)
1) N (%)
1) Multiple response, 2) N (%) (Total N = 90)
1) N (%), *: p < 0.05
1) N (%), *: p < 0.05
1) N (%), **: p < 0.01, ***: p < 0.001
1) N (%)
1) N (%)
1) Multiple response, 2) N (%) (Total N=300)
1) N (%) *: p < 0.05, ***: p < 0.001
1) Mean ± SD, **: p < 0.01 2) 5 points Likert scale: 'Very satisfied' (5 points) ~ 'Very dissatisfied' (1 point) 3) Different superscripts in the same column mean significant differences among groups by Duncan's multiple range test (p < 0.05)
1) Mean ± SD, *: p < 0.05, **: p < 0.01 2) 4 points Likert scale : 'Always check' (4 points) ~ 'Almost not check' (1 point) 3) Different superscripts in the same column mean significant differences among groups by Duncan's multiple range test (p < 0.05)
1) N (%), **: p < 0.01
1) N (%)

 KSCN
KSCN








 Cite
Cite


