
Articles
- Page Path
- HOME > Korean J Community Nutr > Volume 30(1); 2025 > Article
-
Research Article
근거 기반 나트륨 저감 건강 식생활 프로그램의 리빙랩 모델 적용 -
김정현1)
 , 심유진2),†, 경민숙3), 권수연4), 박형수5), 강재헌6)
 - Application of a living lab model to an evidence-based reduced-sodium healthy eating practice program in Korea: a pre-post study
-
Jung-Hyun Kim1), Eugene Shim2),†, Min Sook Kyung3), Sooyoun Kwon4), Hyoung Su Park5), Jae-Heon Kang6)
-
Korean Journal of Community Nutrition 2025;30(1):53-63.
DOI: https://doi.org/10.5720/kjcn.2024.00346
Published online: February 28, 2025
1)배재대학교 식품영양학과 교수
2)숭의여자대학교 식품영양과 조교수
3)대전광역시 서구 어린이•사회복지급식관리지원센터 부센터장
4)신구대학교 식품영양학과 조교수
5)매일헬스뉴트리션(주) R&D group, 차장
6)성균관대학교 강북삼성병원 가정의학과 교수
1)Professor, Department of Food and Nutrition, Pai Chai University, Daejeon, Korea
2)Assistant Professor, Department of Food and Nutrition, Soongeui Women’s University, Seoul, Korea
3)Associate Director, Daejeon-Seogu Children and Social Welfare Meal Management Support Center, Daejeon, Korea
4)Assistant Professor, Department of Food and Nutrition, Shingu University, Seongnam, Korea
5)Associate Director, R&D group, Maeil Health Nutrition Co., Ltd, Korea
6)Professor, Department of Family Medicine, Kangbuk Samsung Hospital, Sungkyunkwan University, Seoul, Korea
- †Corresponding author: Eugene Shim Department of Food and Nutrition, Soongeui Women’s University, 10 Sopa-ro 2-gil, Jung-gu, Seoul 04628, Korea Tel: +82-2-3708-9263 Fax: +82-2-773-2625 Email: eugeneshim@sewu.ac.kr
• Received: December 22, 2024 • Revised: January 16, 2025 • Accepted: February 6, 2025
© 2025 The Korean Society of Community Nutrition
This is an Open-Access article distributed under the terms of the Creative Commons Attribution Non-Commercial License (http://creativecommons.org/licenses/by-nc/4.0) which permits unrestricted non-commercial use, distribution, and reproduction in any medium, provided the original work is properly cited.
- 2,802 Views
- 75 Download
- 1 Crossref
Abstract
-
Objectives
- To apply a healthy dietary program with reduced sodium intake, developed using data from the Korea National Health and Nutrition Examination Survey (KNHANES), focusing on the sodium intake level and eating patterns.
-
Methods
- The program was implemented using a living lab model, an open innovation ecosystem for user-centered problem-solving. Analysis of the KNHANES data revealed that older age groups had a low energy intake but a high sodium intake, particularly among those who frequently dined out. The program was designed to improve sodium-reduction literacy and enhance practical competency. Over four weeks, 40 participants tracked their dietary intake and worked with a clinical nutritionist through a process of diagnosis, experience, improvement, and expansion. A self-administered survey was conducted before and after the program to assess effectiveness.
-
Results
- Participants were four teenagers (10%), 26 in their twenties (65%), and 10 aged ≥ 30 years (25%), with eight males (20%) and 32 females (80%). Post-program analysis showed significant improvements in sodium-related nutrition knowledge (P < 0.01), with increased agreement on adopting low-sodium intake practices (e.g., interest in sodium content, choosing lower-sodium foods). Nutrient intake analysis showed a decrease in energy, carbohydrates, lipids, and proteins (P < 0.001), with sodium intake decreasing from 3,382.37 mg/d to 2,119.05 mg/d (P < 0.001).
-
Conclusion
- The community-based, living lab model for the sodium-reduction program effectively improved participant sodium-reduction literacy and practical competency, suggesting that step-by-step, autonomous learning, can reduce sodium intake and promote healthier eating habits.
INTRODUCTION
METHODS
1) 근거 기반 나트륨 저감 건강 식생활 실천 운영지침 개발 및 프로그램 구축
2) 나트륨 저감 건강 식생활 실천 프로그램의 리빙랩 모델 적용 및 효과 평가
RESULTS
1) 나트륨 관련 영양 지식 및 나트륨 저감 실천 의지
2) 나트륨 저감 식사 행동
3) 영양소 섭취 상태
DISCUSSION
-
CONFLICT OF INTEREST
There are no financial or other issues that might lead to conflict of interest.
-
FUNDING
This research was supported by grants from the National Institute of Food and Drug Safety Evaluation of Korea (Grant No. 20162식생안091 & 23192영양안060).
-
DATA AVAILABILITY
Research data is available upon request to the corresponding author.
NOTES

Fig. 2.Change in nutrition knowledge before and after the reduced-sodium healthy eating practice program (n = 38). Mean ± SD; paired t-test; **P < 0.01.
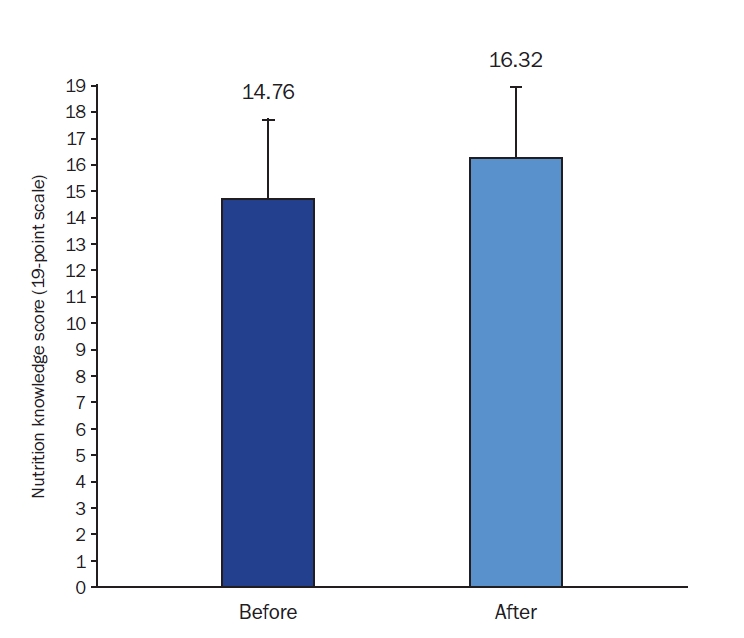
Table 1.General characteristics of the participants (n = 40)
| Characteristics | Classification | Frequency |
|---|---|---|
| Sex | Male | 8 (20.0) |
| Female | 32 (80.0) | |
| Age group (year) | 10s | 4 (10.0) |
| 20s | 26 (65.0) | |
| 30s | 2 (5.0) | |
| 40s | 3 (7.5) | |
| 50+ | 5 (12.5) | |
| Family size | 1 | 6 (15.0) |
| 2 | 1 (2.5) | |
| 3 | 7 (17.5) | |
| 4 | 17 (42.5) | |
| ≥ 5 | 8 (20.0) | |
| N/A | 1 (2.5) | |
| Occupation | Service and sales | 1 (2.5) |
| Clerical | 6 (15.0) | |
| Self-employed | 1 (2.5) | |
| Professionals | 2 (5.0) | |
| Others | 15 (37.5) | |
| None | 15 (37.5) | |
| Income range (million KRW) | < 1 | 6 (15.0) |
| 1–2 | 4 (10.0) | |
| 2–3 | 0 (0.0) | |
| 3–4 | 9 (22.5) | |
| 4–5 | 8 (20.0) | |
| ≥ 5 | 12 (30.0) | |
| N/A | 1 (2.5) | |
| Education level | Elementary school graduate | 3 (7.5) |
| Middle school graduate | 0 (0.0) | |
| High school graduate | 21 (52.5) | |
| University graduate | 11 (27.5) | |
| Graduate school or higher | 3 (7.5) | |
| N/A | 2 (5.0) | |
| Obesity degree | Underweight1) | 4 (10.0) |
| Normal weight2) | 23 (57.5) | |
| Overweight3) | 8 (20.0) | |
| Obese4) | 5 (12.5) |
Table 2.Goals and content structure of the evidence-based reduced-sodium healthy eating practice program
Table 3.Intentions to reduce sodium before and after the reduced-sodium healthy eating practice program (n = 40)
| Classification | Before1) | After1) | t-value2) | P-value2) |
|---|---|---|---|---|
| I will be interested in the amount of sodium in foods and ingredients. | 3.78 ± 0.92 | 4.43 ± 0.68 | –4.106 | < 0.001 |
| I will practice a low-sodium diet to improve my health. | 4.53 ± 0.64 | 4.73 ± 0.55 | –2.243 | 0.031 |
| I will purchase fresh foods rather than processed and instant foods. | 4.18 ± 0.68 | 4.43 ± 0.84 | –1.706 | 0.096 |
| I will ask for food to be prepared with less salt when dining out. | 2.90 ± 1.06 | 3.60 ± 1.03 | –4.149 | < 0.001 |
| I will choose dishes that preserve the natural flavors of ingredients rather than spicy and salty foods. | 3.75 ± 0.67 | 4.30 ± 0.61 | –5.135 | < 0.001 |
| I will pay attention to cooking methods that support a low-sodium diet. | 4.33 ± 0.66 | 4.28 ± 0.72 | 0.361 | 0.720 |
| I will believe that attempts and interest in reducing sodium intake can lead to social change. | 4.28 ± 0.72 | 4.50 ± 0.55 | –1.940 | 0.060 |
| I will choose low-sodium versions of pickled foods and kimchi. | 3.85 ± 0.77 | 4.18 ± 0.87 | –2.010 | 0.051 |
| I will opt for steamed or grilled dishes instead of braised dishes. | 4.20 ± 0.65 | 4.30 ± 0.72 | –0.752 | 0.457 |
| I will leave the broth and focus on the solid ingredients when eating soup, stew, or ramen. | 4.50 ± 0.75 | 4.68 ± 0.62 | –1.639 | 0.109 |
| I will reduce the amount of gochujang or seasoning in bibimbap by half. | 4.03 ± 0.86 | 4.33 ± 0.83 | –1.669 | 0.103 |
| I will gradually reduce the amount of soup base in ramen and cook with half the recommended amount. | 3.75 ± 1.19 | 3.93 ± 1.23 | –0.943 | 0.352 |
| I will consume fresh vegetables and fruits. | 4.83 ± 0.38 | 4.80 ± 0.52 | 0.274 | 0.785 |
| I will not use table salt separately. | 4.60 ± 0.59 | 4.65 ± 0.62 | –0.467 | 0.643 |
| I will consciously try to eat food with less seasoning and sauces. | 4.60 ± 0.55 | 4.68 ± 0.57 | –0.684 | 0.498 |
| I will check the nutrition labels of processed foods to choose products with lower sodium content. | 4.40 ± 0.63 | 4.43 ± 0.64 | –0.206 | 0.838 |
| I will refer to “low-sodium recipes” for guidance when cooking. | 4.05 ± 0.93 | 4.23 ± 0.73 | –1.267 | 0.213 |
Table 4.Dietary behaviors for reducing sodium before and after the reduced-sodium healthy eating practice program (n = 40)
| Classification | Before1) | After1) | t-value2) | P-value2) |
|---|---|---|---|---|
| I eat all the broth in soups, stews, noodles, and ramen. | 3.30 ± 1.29 | 4.00 ± 0.88 | –3.264 | 0.002 |
| I feel that if food is bland, something is missing, and I am not satisfied. | 2.57 ± 1.12 | 3.43 ± 0.93 | –5.237 | < 0.001 |
| I enjoy dishes like donburi, fried rice, bibimbap, and curry rice. | 2.05 ± 0.88 | 2.59 ± 0.90 | –3.651 | 0.001 |
| I like simmered dishes that are seasoned just right with soy sauce. | 2.25 ± 0.94 | 2.86 ± 0.90 | –3.588 | 0.001 |
| I prefer Japanese or Chinese food over Western food. | 2.81 ± 0.91 | 3.22 ± 0.92 | –2.852 | 0.007 |
| I like kimchi more than fresh vegetables. | 2.95 ± 1.27 | 3.16 ± 1.14 | –1.091 | 0.282 |
| I enjoy snacks with a salty taste, like potato chips and crackers. | 2.73 ± 1.37 | 3.27 ± 1.07 | –3.424 | 0.002 |
| I dine out or order takeout at least twice a week. | 2.49 ± 1.15 | 3.32 ± 1.20 | –3.484 | 0.001 |
| I like dried fish or salted mackerel. | 3.14 ± 1.11 | 3.57 ± 1.01 | –2.665 | 0.011 |
| I feel incomplete if there are no fermented fish products, like salted cod roe, on the table. | 4.08 ± 1.12 | 4.38 ± 0.86 | –1.766 | 0.086 |
| I enjoy spicy and salty foods as snacks while drinking alcoholic. | 2.70 ± 1.33 | 3.49 ± 1.19 | –4.886 | < 0.001 |
| I like spreading butter or margarine generously (100% of the bread surface) on bread. | 2.53 ± 1.42 | 3.58 ± 1.32 | –7.666 | < 0.001 |
| I usually use homemade soy sauce rather than regular soy sauce. | 3.51 ± 1.26 | 3.24 ± 1.21 | 1.822 | 0.077 |
| I habitually add salt or soy sauce before meals. | 3.97 ± 1.26 | 4.38 ± 0.76 | –2.579 | 0.014 |
| I immediately add salt or soy sauce at the table if dishes like vegetables or soups are bland. | 3.19 ± 1.49 | 4.19 ± 0.89 | –4.743 | < 0.001 |
| I feel that if there is less salt in food, it doesn’t taste good. | 2.69 ± 1.12 | 3.53 ± 1.03 | –5.916 | < 0.001 |
| I often use mayonnaise or salad dressing when cooking. | 3.19 ± 1.17 | 3.47 ± 1.06 | –1.303 | 0.201 |
| I frequently eat soybean paste soup. | 2.95 ± 1.05 | 3.49 ± 1.02 | –2.941 | 0.006 |
| I dip pancakes, fried foods, or sashimi generously in soy sauce (enough to submerge the food). | 3.15 ± 1.25 | 3.92 ± 0.98 | –4.629 | < 0.001 |
| I like instant foods (like ham and sausages) or ready-to-eat foods (like 3-minute meals), and ramen. | 2.61 ± 1.24 | 3.08 ± 0.91 | –3.070 | 0.004 |
| I eat vegetables with every meal.3) | 2.97 ± 0.96 | 3.46 ± 0.97 | –2.714 | 0.010 |
| I eat fruit more than twice a day.3) | 2.54 ± 1.17 | 3.00 ± 1.05 | –2.471 | 0.018 |
| I usually check the sodium content on nutrition labels when purchasing food or dining out.3) | 2.44 ± 1.41 | 3.33 ± 1.08 | –4.634 | < 0.001 |
Table 5.Nutrient intake levels before and after the reduced-sodium healthy eating practice program (n = 40)
| Classification | Before (n = 40) | After (n = 40) | t-value1) | P-value1) |
|---|---|---|---|---|
| Energy (kcal) | 2,000.71 ± 912.59 | 1,450.27 ± 711.18 | 4.286 | < 0.001 |
| Carbohydrate (g) | 271.44 ± 113.51 | 205.04 ± 107.31 | 4.025 | < 0.001 |
| Lipid (g) | 58.45 ± 29.66 | 41.55 ± 21.48 | 4.059 | < 0.001 |
| Protein (g) | 72.35 ± 34.47 | 53.21 ± 26.44 | 3.999 | < 0.001 |
| Dietary fiber (g) | 23.39 ± 12.11 | 18.20 ± 10.03 | 2.826 | 0.007 |
| Vitamin A (ugRAE) | 307.18 ± 118.17 | 233.63 ± 109.61 | 4.012 | < 0.001 |
| Vitamin D (ug) | 3.64 ± 2.97 | 2.52 ± 2.27 | 2.278 | 0.028 |
| Vitamin E (mg) | 15.89 ± 8.13 | 12.46 ± 7.84 | 3.400 | 0.002 |
| Vitamin K (ug) | 113.65 ± 67.20 | 113.47 ± 88.82 | 0.013 | 0.990 |
| Vitamin C (mg) | 87.91 ± 41.89 | 87.58 ± 50.86 | 0.047 | 0.963 |
| Thiamin (mg) | 1.95 ± 0.92 | 1.39 ± 0.69 | 4.315 | < 0.001 |
| Riboflavin (mg) | 1.63 ± 0.69 | 1.18 ± 0.56 | 4.988 | < 0.001 |
| Niacin (mg) | 9.99 ± 5.28 | 7.52 ± 3.73 | 3.365 | 0.002 |
| Ca (mg) | 549.32 ± 209.32 | 401.47 ± 216.09 | 4.801 | < 0.001 |
| P (mg) | 1,107.18 ± 482.17 | 822.28 ± 414.82 | 4.285 | < 0.001 |
| Na (mg) | 3,382.37 ± 2,345.57 | 2,119.05 ± 1,326.63 | 4.082 | < 0.001 |
| K (mg) | 2,301.83 ± 1,021.15 | 1,845.01 ± 898.53 | 2.956 | 0.005 |
| Fe (mg) | 13.44 ± 6.28 | 10.72 ± 5.23 | 3.035 | 0.004 |
| Zn (mg) | 12.26 ± 8.74 | 8.03 ± 3.78 | 3.211 | 0.003 |
| Cholesterol (mg) | 334.06 ± 186.12 | 236.38 ± 132.69 | 4.283 | < 0.001 |
- 1. Cho KS. Current status of non-communicable diseases in the Republic of Korea. Public Health Wkly Rep 2021; 14(4): 166-177.
- 2. Jung YH, Ko SJ, Kim EJ. A study on the effective chronic disease management. Korea Institute for Health and Social Affairs; 2013 Dec. Report No. Research Monographs 2013-31-19.
- 3. Newberry SJ, Chung M, Anderson CAM, Chen C, Fu Z, Tang A, et al. Sodium and Potassium intake: effects on chronic disease outcomes and risks. AHRQ Publication; 2018 Jun. Report No. 18-EHC009-EF.
- 4. Stamler J. The INTERSALT study: background, methods, findings, and implications. Am J Clin Nutr 1997; 65(2 Suppl): 626S-642S. ArticlePubMed
- 5. Kim SA, Kim JA. Analysis of dietary life of Seoul citizens and dietary policy suggestions for Seoul. The Seoul Institute; 2024 Aug. Report No. 2023-PR-01.
- 6. Korean Disease Control and Prevention Agency (KDCA). Korea Health Statistics 2022: Korea National Health and Nutrition Examination Survey (KNHANES IX-1) [Internet]. KDCA; 2023 [updated 2023 Dec 29; cited 2024 Dec 20]. Available from: https://knhanes.kdca.go.kr/knhanes/archive/wsiStatsClct.do
- 7. World Health Organization (WHO). WHO global report on sodium intake reduction. WHO; 2023. p. 54-69.
- 8. Ministry of Health and Welfare (MOHW), The Korean Nutrition Society. Dietary reference intakes for Koreans 2020: minerals. MOHW; 2020. p. 25-46.
- 9. Statistics Korea. 2022 One-person households in statistics [Internet]. Statistics Korea; 2022 [cited 2024 Dec 20]. Available from: https://www.kostat.go.kr/board.es?mid=a10301010000&bid=10820&act=view&list_no=422143
- 10. Choi MK, Park ES, Kim MH. Home meal replacement use and eating habits of adults in one-person households. Korean J Community Nutr 2019; 24(6): 476-484. ArticleLink
- 11. Lidin M, Ekblom-Bak E, Rydell Karlsson M, Hellénius ML. Long-term effects of a Swedish lifestyle intervention programme on lifestyle habits and quality of life in people with increased cardiovascular risk. Scand J Public Health 2018; 46(6): 613-622. ArticlePubMed
- 12. Lee YS, Kim DJ, Song TH, Lee MH, Kim MC. 2024 health center mobile healthcare program guide. Ministry of Health and Welfare; 2024 Jan. Report No. 사업-03-2024-001-10.
- 13. Kim JN, Lee YW, Oh IH. Current status and development strategies for community-based health promotion programs in South Korea. Korean J Health Educ Promot 2024; 41(4): 19-29. Article
- 14. Kim DJ, Park NY. Public digital health management services in Korea: current status and future directions. Health Welf Policy Forum 2023; 8(322): 6-21. Article
- 15. Malmberg K, Vaittinen I, Evans P, Schuurman D, Ståhlbröst A, Vervoort K. Living lab methodology handbook. U4IoT Consortium; 2017. p. 1-56.
- 16. Almirall E, Wareham J. Living labs and open innovation: roles and applicability. eJov: Electr J Virtual Organization Netw 2008; 10: 21-46.
- 17. Shim E, Yang YJ, Yang YK. Relationship between thresholds and self-assessed preference for saltiness and sodium intake in young women. J Nutr Health 2016; 49(2): 88-98. Article
- 18. Moon HO, Rho JO. Correlation analysis of sodium-related knowledge, dietary behavior, attitudes towards a low-salt diet and meal attitude guidance for elementary school teachers in Jeonbuk area. J Nutr Health 2017; 50(2): 180-191. Article
- 19. Han MH, Jung BM. Comparison of food and nutrient intake according to the income level in Korean adult single-person households: using data from the Korea National Health and Nutrition Examination Survey (2016-2018). Korean J Community Living Sci 2024; 35(3): 445-458. Article
- 20. Yang SB. A cohort analysis on sodium and sodium-calorie intake with the Korean National Health and Nutrition Examination Survey. Korean J Food Nutr 2020; 33(1): 98-104.
- 21. Ko M, Ha K. Association of delivered food consumption with dietary behaviors and obesity among young adults in Jeju. J Nutr Health 2024; 57(3): 336-348. ArticleLink
- 22. Guyatt G, Cook D, Haynes B. Evidence based medicine has come a long way. BMJ 2004; 329(7473): 990-991. ArticlePubMedPMC
- 23. Lim W, Arnold DM, Bachanova V, Haspel RL, Rosovsky RP, Shustov AR, et al. Evidence-based guidelines--an introduction. Hematology Am Soc Hematol Educ Program 2008; 2008(1): 26-30.ArticlePDF
- 24. Kim S, Shin S, Seo HJ, Cha Y, Song G, Lee J, et al. Korea Preventive Service Task Force’s rapid response program for evidencebased community health programs. Public Health Wkly Rep 2019; 12(18): 557-563.
- 25. Sacks FM, Svetkey LP, Vollmer WM, Appel LJ, Bray GA, Harsha D, et al.; DASH-Sodium Collaborative Research Group. Effects on blood pressure of reduced dietary sodium and the Dietary Approaches to Stop Hypertension (DASH) diet. DASH-Sodium Collaborative Research Group. N Engl J Med 2001; 344(1): 3-10. ArticlePubMed
- 26. Appel LJ, Moore TJ, Obarzanek E, Vollmer WM, Svetkey LP, Sacks FM, et al. A clinical trial of the effects of dietary patterns on blood pressure. DASH Collaborative Research Group. N Engl J Med 1997; 336(16): 1117-1124. ArticlePubMed
- 27. Sohn KH, Lee IH, Moon S. An attempt at dietary research from a new perspective. Hum Ecol Res 1980; 18(4): 143-152.
- 28. Son I, Hong J, Han YH, Gong BJ, Zhang MY, Na W, et al. Process evaluation of a mobile healthcare program among employees with overweight and obesity: a 12-week intervention study investigating the role of engagement. Korean J Community Nutr 2023; 28(6): 466-479. ArticleLink
- 29. Følstad A. Living labs for innovation and development of information and communication technology: a literature review. Electr J Organ Virtualness 2008; 10: 99-131.
- 30. Dutilleul B, Birrer FAJ, Mensink W. Unpacking European living labs: analysing innovation’s social dimensions. Cent Eur J Public Policy 2010; 4(1): 60-85.
- 31. Hossain M, Leminen S, Westerlund M. A systematic review of living lab literature. J Clean Prod 2019; 213(10): 976-988. Article
- 32. Kim J, Kim YL, Jang H, Cho M, Lee M, Kim J, et al. Living labs for health: an integrative literature review. Eur J Public Health 2020; 30(1): 55-63. ArticlePubMedPDF
- 33. Paskaleva K, Cooper I. Are living labs effective? Exploring the evidence. Technovation 2021; 106: 102311.Article
- 34. Joo K. The derivation of implications of living labs operation through successful case analysis of domestic living labs. Korean J Local Gov Adm Stud 2020; 34(3): 293-312.
- 35. Choi M, Lee SH, Jo SS, Jung YJ, Jo S. The living lab model of smart city based on citizen participation. J Korea Contents Assoc 2020; 20(4): 284-294.
- 36. Yoon SH. The meta-analysis on effects of living lab-based education. J Pract Eng Educ 2022; 14(3): 505-512.
REFERENCES
Figure & Data
REFERENCES
Citations
Citations to this article as recorded by 
- Influence of food literacy on short- and long-term healthy eating intentions among adolescent and adult convenience store users: An application of the extended theory of planned behavior
Wonyeong Park, Hae Jin Park, Suah Moon, Jieun Oh
Nutrition Research and Practice.2025; 19(6): 917. CrossRef
 Cite
CiteApplication of a living lab model to an evidence-based reduced-sodium healthy eating practice program in Korea: a pre-post study
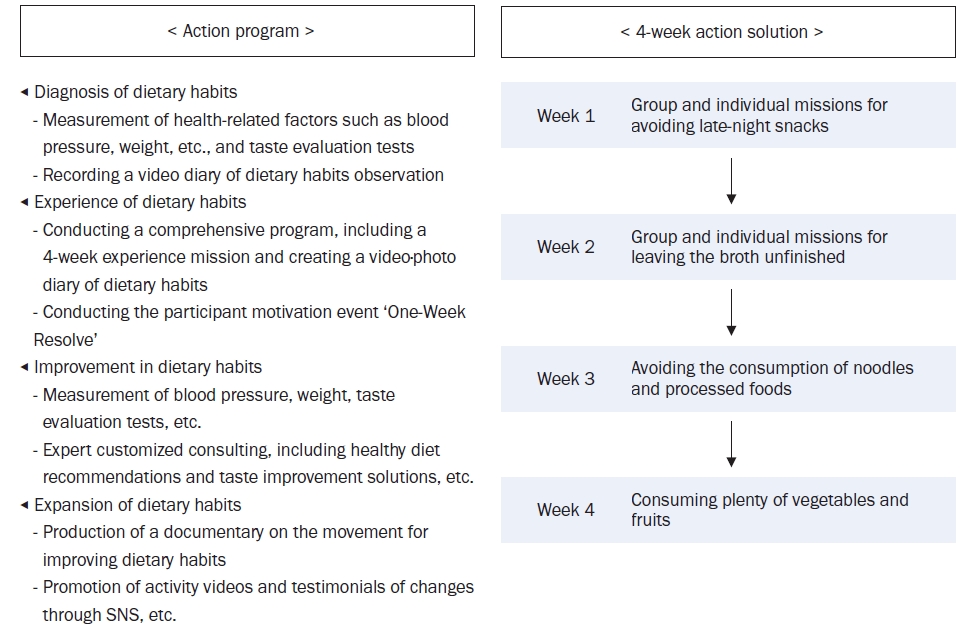

Fig. 1. Structure and practical steps of the reduced-sodium healthy eating practice program.
Fig. 2. Change in nutrition knowledge before and after the reduced-sodium healthy eating practice program (n = 38). Mean ± SD; paired t-test; **P < 0.01.
Fig. 1.
Fig. 2.
Application of a living lab model to an evidence-based reduced-sodium healthy eating practice program in Korea: a pre-post study
| Characteristics | Classification | Frequency |
|---|---|---|
| Sex | Male | 8 (20.0) |
| Female | 32 (80.0) | |
| Age group (year) | 10s | 4 (10.0) |
| 20s | 26 (65.0) | |
| 30s | 2 (5.0) | |
| 40s | 3 (7.5) | |
| 50+ | 5 (12.5) | |
| Family size | 1 | 6 (15.0) |
| 2 | 1 (2.5) | |
| 3 | 7 (17.5) | |
| 4 | 17 (42.5) | |
| ≥ 5 | 8 (20.0) | |
| N/A | 1 (2.5) | |
| Occupation | Service and sales | 1 (2.5) |
| Clerical | 6 (15.0) | |
| Self-employed | 1 (2.5) | |
| Professionals | 2 (5.0) | |
| Others | 15 (37.5) | |
| None | 15 (37.5) | |
| Income range (million KRW) | < 1 | 6 (15.0) |
| 1–2 | 4 (10.0) | |
| 2–3 | 0 (0.0) | |
| 3–4 | 9 (22.5) | |
| 4–5 | 8 (20.0) | |
| ≥ 5 | 12 (30.0) | |
| N/A | 1 (2.5) | |
| Education level | Elementary school graduate | 3 (7.5) |
| Middle school graduate | 0 (0.0) | |
| High school graduate | 21 (52.5) | |
| University graduate | 11 (27.5) | |
| Graduate school or higher | 3 (7.5) | |
| N/A | 2 (5.0) | |
| Obesity degree | Underweight |
4 (10.0) |
| Normal weight |
23 (57.5) | |
| Overweight |
8 (20.0) | |
| Obese |
5 (12.5) |
| Goal 1: ‘Literacy’ enhancement for sodium reduction |
| ◀ Emphasize balanced meal intake centered on breakfast |
| ◀ Intend to improve fruit and vegetable consumption |
| ◀ Intend to reduce the frequency of eating out |
| Goal 2: ‘Competency’ strengthening for sodium reduction |
| ◀ Choose ingredients to reduce sodium intake |
| ◀ Practice your own recipes and methods |
| ◀ Practice healthier menus today than those from yesterday |
| Classification | Before |
After |
t-value |
P-value |
|---|---|---|---|---|
| I will be interested in the amount of sodium in foods and ingredients. | 3.78 ± 0.92 | 4.43 ± 0.68 | –4.106 | < 0.001 |
| I will practice a low-sodium diet to improve my health. | 4.53 ± 0.64 | 4.73 ± 0.55 | –2.243 | 0.031 |
| I will purchase fresh foods rather than processed and instant foods. | 4.18 ± 0.68 | 4.43 ± 0.84 | –1.706 | 0.096 |
| I will ask for food to be prepared with less salt when dining out. | 2.90 ± 1.06 | 3.60 ± 1.03 | –4.149 | < 0.001 |
| I will choose dishes that preserve the natural flavors of ingredients rather than spicy and salty foods. | 3.75 ± 0.67 | 4.30 ± 0.61 | –5.135 | < 0.001 |
| I will pay attention to cooking methods that support a low-sodium diet. | 4.33 ± 0.66 | 4.28 ± 0.72 | 0.361 | 0.720 |
| I will believe that attempts and interest in reducing sodium intake can lead to social change. | 4.28 ± 0.72 | 4.50 ± 0.55 | –1.940 | 0.060 |
| I will choose low-sodium versions of pickled foods and kimchi. | 3.85 ± 0.77 | 4.18 ± 0.87 | –2.010 | 0.051 |
| I will opt for steamed or grilled dishes instead of braised dishes. | 4.20 ± 0.65 | 4.30 ± 0.72 | –0.752 | 0.457 |
| I will leave the broth and focus on the solid ingredients when eating soup, stew, or ramen. | 4.50 ± 0.75 | 4.68 ± 0.62 | –1.639 | 0.109 |
| I will reduce the amount of gochujang or seasoning in bibimbap by half. | 4.03 ± 0.86 | 4.33 ± 0.83 | –1.669 | 0.103 |
| I will gradually reduce the amount of soup base in ramen and cook with half the recommended amount. | 3.75 ± 1.19 | 3.93 ± 1.23 | –0.943 | 0.352 |
| I will consume fresh vegetables and fruits. | 4.83 ± 0.38 | 4.80 ± 0.52 | 0.274 | 0.785 |
| I will not use table salt separately. | 4.60 ± 0.59 | 4.65 ± 0.62 | –0.467 | 0.643 |
| I will consciously try to eat food with less seasoning and sauces. | 4.60 ± 0.55 | 4.68 ± 0.57 | –0.684 | 0.498 |
| I will check the nutrition labels of processed foods to choose products with lower sodium content. | 4.40 ± 0.63 | 4.43 ± 0.64 | –0.206 | 0.838 |
| I will refer to “low-sodium recipes” for guidance when cooking. | 4.05 ± 0.93 | 4.23 ± 0.73 | –1.267 | 0.213 |
| Classification | Before |
After |
t-value |
P-value |
|---|---|---|---|---|
| I eat all the broth in soups, stews, noodles, and ramen. | 3.30 ± 1.29 | 4.00 ± 0.88 | –3.264 | 0.002 |
| I feel that if food is bland, something is missing, and I am not satisfied. | 2.57 ± 1.12 | 3.43 ± 0.93 | –5.237 | < 0.001 |
| I enjoy dishes like donburi, fried rice, bibimbap, and curry rice. | 2.05 ± 0.88 | 2.59 ± 0.90 | –3.651 | 0.001 |
| I like simmered dishes that are seasoned just right with soy sauce. | 2.25 ± 0.94 | 2.86 ± 0.90 | –3.588 | 0.001 |
| I prefer Japanese or Chinese food over Western food. | 2.81 ± 0.91 | 3.22 ± 0.92 | –2.852 | 0.007 |
| I like kimchi more than fresh vegetables. | 2.95 ± 1.27 | 3.16 ± 1.14 | –1.091 | 0.282 |
| I enjoy snacks with a salty taste, like potato chips and crackers. | 2.73 ± 1.37 | 3.27 ± 1.07 | –3.424 | 0.002 |
| I dine out or order takeout at least twice a week. | 2.49 ± 1.15 | 3.32 ± 1.20 | –3.484 | 0.001 |
| I like dried fish or salted mackerel. | 3.14 ± 1.11 | 3.57 ± 1.01 | –2.665 | 0.011 |
| I feel incomplete if there are no fermented fish products, like salted cod roe, on the table. | 4.08 ± 1.12 | 4.38 ± 0.86 | –1.766 | 0.086 |
| I enjoy spicy and salty foods as snacks while drinking alcoholic. | 2.70 ± 1.33 | 3.49 ± 1.19 | –4.886 | < 0.001 |
| I like spreading butter or margarine generously (100% of the bread surface) on bread. | 2.53 ± 1.42 | 3.58 ± 1.32 | –7.666 | < 0.001 |
| I usually use homemade soy sauce rather than regular soy sauce. | 3.51 ± 1.26 | 3.24 ± 1.21 | 1.822 | 0.077 |
| I habitually add salt or soy sauce before meals. | 3.97 ± 1.26 | 4.38 ± 0.76 | –2.579 | 0.014 |
| I immediately add salt or soy sauce at the table if dishes like vegetables or soups are bland. | 3.19 ± 1.49 | 4.19 ± 0.89 | –4.743 | < 0.001 |
| I feel that if there is less salt in food, it doesn’t taste good. | 2.69 ± 1.12 | 3.53 ± 1.03 | –5.916 | < 0.001 |
| I often use mayonnaise or salad dressing when cooking. | 3.19 ± 1.17 | 3.47 ± 1.06 | –1.303 | 0.201 |
| I frequently eat soybean paste soup. | 2.95 ± 1.05 | 3.49 ± 1.02 | –2.941 | 0.006 |
| I dip pancakes, fried foods, or sashimi generously in soy sauce (enough to submerge the food). | 3.15 ± 1.25 | 3.92 ± 0.98 | –4.629 | < 0.001 |
| I like instant foods (like ham and sausages) or ready-to-eat foods (like 3-minute meals), and ramen. | 2.61 ± 1.24 | 3.08 ± 0.91 | –3.070 | 0.004 |
| I eat vegetables with every meal. |
2.97 ± 0.96 | 3.46 ± 0.97 | –2.714 | 0.010 |
| I eat fruit more than twice a day. |
2.54 ± 1.17 | 3.00 ± 1.05 | –2.471 | 0.018 |
| I usually check the sodium content on nutrition labels when purchasing food or dining out. |
2.44 ± 1.41 | 3.33 ± 1.08 | –4.634 | < 0.001 |
| Classification | Before (n = 40) | After (n = 40) | t-value |
P-value |
|---|---|---|---|---|
| Energy (kcal) | 2,000.71 ± 912.59 | 1,450.27 ± 711.18 | 4.286 | < 0.001 |
| Carbohydrate (g) | 271.44 ± 113.51 | 205.04 ± 107.31 | 4.025 | < 0.001 |
| Lipid (g) | 58.45 ± 29.66 | 41.55 ± 21.48 | 4.059 | < 0.001 |
| Protein (g) | 72.35 ± 34.47 | 53.21 ± 26.44 | 3.999 | < 0.001 |
| Dietary fiber (g) | 23.39 ± 12.11 | 18.20 ± 10.03 | 2.826 | 0.007 |
| Vitamin A (ugRAE) | 307.18 ± 118.17 | 233.63 ± 109.61 | 4.012 | < 0.001 |
| Vitamin D (ug) | 3.64 ± 2.97 | 2.52 ± 2.27 | 2.278 | 0.028 |
| Vitamin E (mg) | 15.89 ± 8.13 | 12.46 ± 7.84 | 3.400 | 0.002 |
| Vitamin K (ug) | 113.65 ± 67.20 | 113.47 ± 88.82 | 0.013 | 0.990 |
| Vitamin C (mg) | 87.91 ± 41.89 | 87.58 ± 50.86 | 0.047 | 0.963 |
| Thiamin (mg) | 1.95 ± 0.92 | 1.39 ± 0.69 | 4.315 | < 0.001 |
| Riboflavin (mg) | 1.63 ± 0.69 | 1.18 ± 0.56 | 4.988 | < 0.001 |
| Niacin (mg) | 9.99 ± 5.28 | 7.52 ± 3.73 | 3.365 | 0.002 |
| Ca (mg) | 549.32 ± 209.32 | 401.47 ± 216.09 | 4.801 | < 0.001 |
| P (mg) | 1,107.18 ± 482.17 | 822.28 ± 414.82 | 4.285 | < 0.001 |
| Na (mg) | 3,382.37 ± 2,345.57 | 2,119.05 ± 1,326.63 | 4.082 | < 0.001 |
| K (mg) | 2,301.83 ± 1,021.15 | 1,845.01 ± 898.53 | 2.956 | 0.005 |
| Fe (mg) | 13.44 ± 6.28 | 10.72 ± 5.23 | 3.035 | 0.004 |
| Zn (mg) | 12.26 ± 8.74 | 8.03 ± 3.78 | 3.211 | 0.003 |
| Cholesterol (mg) | 334.06 ± 186.12 | 236.38 ± 132.69 | 4.283 | < 0.001 |
Table 1. General characteristics of the participants (n = 40)
n (%). N/A, not available. Body mass index (BMI) of <18.5 kg/m2. 18.5 ≤ BMI <23 kg/m2. 23 ≤ BMI <25 kg/m2. BMI of ≥ 25 kg/m2.
Table 2. Goals and content structure of the evidence-based reduced-sodium healthy eating practice program
Table 3. Intentions to reduce sodium before and after the reduced-sodium healthy eating practice program (n = 40)
Mean ± SD. 1 = Strongly disagree; 2 = disagree; 3 = neutral; 4 = agree; 5 = strongly agree. Paired t-test.
Table 4. Dietary behaviors for reducing sodium before and after the reduced-sodium healthy eating practice program (n = 40)
Mean ± SD. 1 = Strongly agree; 2 = agree; 3 = neutral; 4 = disagree; 5 = strongly disagree. Paired t-test. Reversed scale (1 = strongly disagree; 2 = disagree; 4 = agree; 5 = strongly agree).
Table 5. Nutrient intake levels before and after the reduced-sodium healthy eating practice program (n = 40)
Mean ± SD. Paired t-test.


