
Articles
- Page Path
- HOME > Korean J Community Nutr > Volume 30(3); 2025 > Article
-
Research Article
- The impact of flash continuous glucose monitoring and nutrition coaching on dietary self-efficacy and weight management in university students in Korea: a pre-post intervention study
-
Soojin Park†

-
Korean Journal of Community Nutrition 2025;30(3):183-196.
DOI: https://doi.org/10.5720/kjcn.2025.00073
Published online: June 30, 2025
Professor, School of Bio Food and Nutrition Science, Semyung University, Jecheon, Korea
- †Corresponding author: Soojin Park School of Bio Food and Nutrition Science, Semyung University, 65 Semyung-ro, Jecheon 27136, Korea Tel: +82-43-649-1431 Fax: +82-43-649-1759 Email: sjpark@semyung.ac.kr
• Received: March 6, 2025 • Revised: March 29, 2025 • Accepted: April 8, 2025
© 2025 The Korean Society of Community Nutrition
This is an Open-Access article distributed under the terms of the Creative Commons Attribution Non-Commercial License (http://creativecommons.org/licenses/by-nc/3.0) which permits unrestricted non-commercial use, distribution, and reproduction in any medium, provided the original work is properly cited.
- 2,801 Views
- 50 Download
Abstract
-
Objectives
- This study aimed to evaluate the impact of a 4-week multicomponent intervention combining flash continuous glucose monitoring (flash-CGM), group nutrition education, and personalized nutrition coaching on dietary self-efficacy (DSE) and weight management in healthy university students.
-
Methods
- A total of 27 university students participated in a pre-post intervention study. The intervention included a single 4-hour group-based nutrition education session, flash-CGM usage (FreeStyle Libre; Abbott Diabetes Care), and weekly one-on-one nutrition coaching. Participants wore the CGM device for 28 days (replaced after 14 days), and were guided in using the FoodLens app (DoingLab) for dietary tracking and a mobile app-linked digital scale for weight monitoring. Outcomes measured before and after the intervention included DSE, body mass index (BMI), nutrition quotient (NQ) and glycemic indicators. Statistical analyses included Wilcoxon signed-rank and Mann-Whitney U-tests with significance set at P < 0.05.
-
Results
- There was a significant increase in DSE (P < 0.05), particularly in managing eating behavior under stress and fatigue. A modest but significant decrease in BMI was observed in the overall group (P < 0.05), though changes were not significant in the BMI ≥ 23 kg/m2 subgroup. Glycemic indicators showed minimal changes. The overall NQ score improved slightly, with significant increases in fruit intake (P < 0.01) and nutrition label checks (P < 0.05). High satisfaction levels (4.52 ± 0.65 on a 5‑point scale) were reported for device usability and coaching services.
-
Conclusion
- The multicomponent intervention improved DSE, NQ scores, and supported modest weight reduction among university students. The combined effect of CGM, nutrition education, and coaching appears promising; however, further studies are needed to isolate the effects of each component and evaluate long-term outcomes. Trial Registration: Clinical Research Information Service Identifier: KCT0010255.
-
Trial Registration
- Clinical Research Information Service Identifier: KCT0010255.
INTRODUCTION
METHODS
RESULTS
DISCUSSION
-
CONFLICT OF INTEREST
There are no financial or other issues that might lead to conflict of interest.
-
FUNDING
This research was supported by a grant from 2024 Semyung University.
-
DATA AVAILABILITY
The participants of this study did not give written consent for their data to be shared publicly. Due to the sensitive nature of the research, supporting data is not available.
-
ACKNOWLEDGMENTS
This research was supported by the Semyung University Research Grant of 2024. We would like to express our sincere gratitude to Jieun Park for her valuable assistance with the statistical analysis.
NOTES
Fig. 1.Study design and flow of the 4-week multicomponent intervention. The intervention included baseline surveys, a 4-hour group nutrition education and flash-CGM workshop (week 1), weekly 5A’s-based nutrition coaching, app-based dietary and weight monitoring and a post-intervention evaluation (week 5). A total of 40 participants were screened, with 27 completing the study. CGM, continuous glucose monitoring; BMI, body mass index.
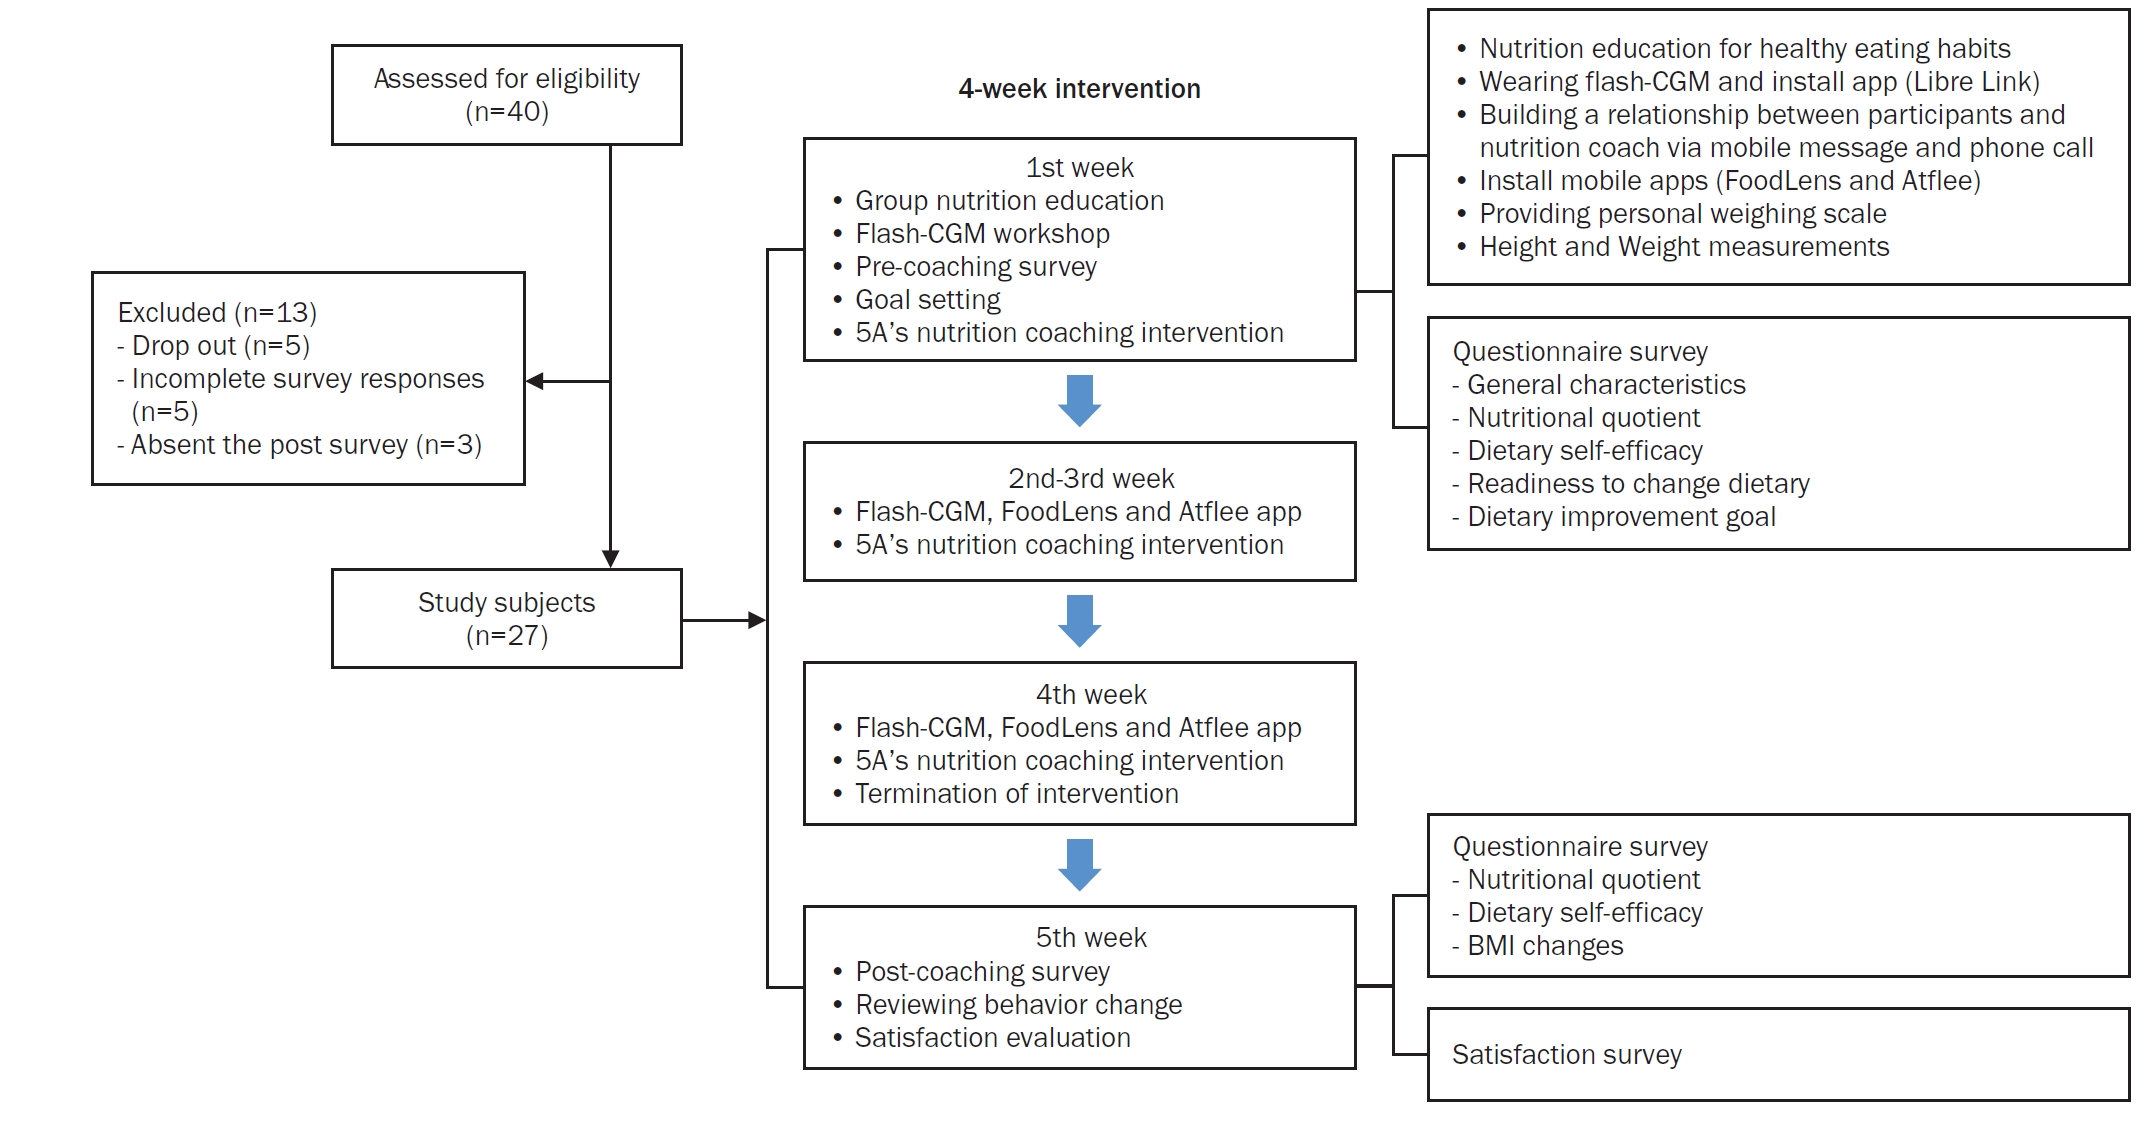
Fig. 2.Changes in BMI before and after the intervention by group. BMI significantly decreased in the total sample (*P < 0.05). No statistically significant changes were observed in the BMI < 23 kg/m2 and BMI ≥ 23 kg/m2 subgroups. BMI, body mass index; ns, not significant.
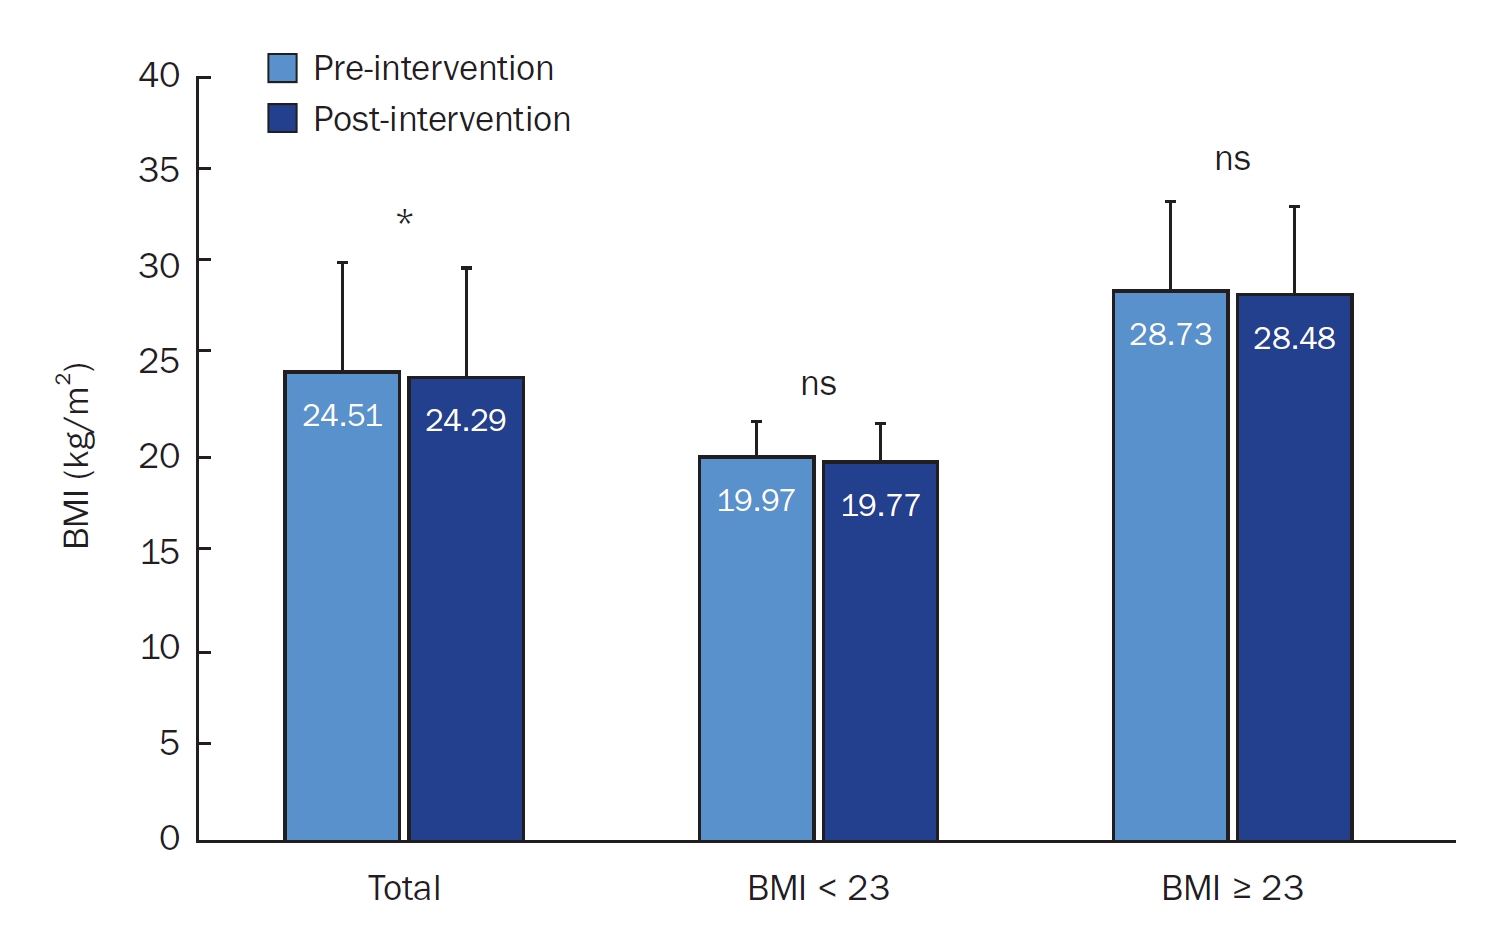
Table 1.Baseline group nutrition education session
Table 2.Weekly consultation topics for 5A’s nutrition coaching1)
Table 3.General characteristics of the participants
Table 4.Primary dietary goals reported by participants according to BMI group
Table 5.Changes in dietary self-efficacy scores by intervention according to BMI group
| Category | Variable | Total (n = 27) | BMI < 23 kg/m2 (n = 13) | BMI ≥ 23 kg/m2 (n = 14) |
|---|---|---|---|---|
| Affective factor control efficacy | I can resist eating when I am stressed | |||
| Pre | 5.78 ± 2.76 | 4.85 ± 2.67 | 6.64 ± 2.65 | |
| Post | 7.52 ± 1.67** | 7.46 ± 1.56** | 7.57 ± 1.83 | |
| I can resist eating when I am depressed | ||||
| Pre | 6.81 ± 2.84 | 6.46 ± 2.93 | 7.14 ± 2.82 | |
| Post | 7.67 ± 1.82 | 7.62 ± 1.89 | 7.71 ± 1.82 | |
| I can resist eating when I am angry | ||||
| Pre | 6.74 ± 2.82 | 6.54 ± 2.93 | 6.93 ± 2.81 | |
| Post | 7.56 ± 1.89 | 7.62 ± 1.98 | 7.50 ± 1.87 | |
| I can resist eating when I am bored | ||||
| Pre | 7.44 ± 2.34 | 7.23 ± 2.31 | 7.64 ± 2.44 | |
| Post | 7.33 ± 2.42 | 7.85 ± 2.58 | 6.86 ± 2.25 | |
| I can resist eating when I feel unstable | ||||
| Pre | 7.93 ± 1.80 | 7.85 ± 1.63 | 8.00 ± 2.00 | |
| Post | 8.48 ± 1.60 | 9.00 ± 1.15* | 8.00 ± 1.84 | |
| I can resist eating when I am tired | ||||
| Pre | 5.70 ± 2.71 | 4.85 ± 2.67 | 6.50 ± 2.59 | |
| Post | 8.74 ± 1.40*** | 9.15 ± 0.90** | 8.36 ± 1.69* | |
| I can resist eating when I am nervous | ||||
| Pre | 8.41 ± 1.80 | 8.15 ± 1.52 | 8.64 ± 2.06 | |
| Post | 8.93 ± 1.54 | 9.54 ± 0.78** | 8.36 ± 1.86 | |
| Subtotal | ||||
| Pre | 6.97 ± 1.81 | 6.56 ± 1.49 | 7.36 ± 2.04 | |
| Post | 8.03 ± 1.41** | 8.32 ± 1.08** | 7.76 ± 1.65 | |
| Environ mental stimulus control efficacy | I can resist eating even when others are pressuring me to eat | |||
| Pre | 6.44 ± 2.49 | 6.38 ± 2.69 | 6.50 ± 2.38 | |
| Post | 7.33 ± 1.80 | 7.46 ± 1.39 | 7.21 ± 2.15 | |
| I can resist eating when I eat at even event (wedding, holiday, etc.) or at a company dinner | ||||
| Pre | 5.33 ± 2.53 | 5.38 ± 2.66 | 5.29 ± 2.49 | |
| Post | 5.96 ± 2.30 | 5.85 ± 2.41 | 6.07 ± 2.27 | |
| I can resist eating when I eat with my friends | ||||
| Pre | 4.96 ± 2.67 | 4.62 ± 2.63 | 5.29 ± 2.76 | |
| Post | 6.30 ± 2.37* | 6.23 ± 2.65 | 6.36 ± 2.17 | |
| I can resist eating when I am alone | ||||
| Pre | 7.93 ± 2.22 | 7.54 ± 2.40 | 8.29 ± 2.05 | |
| Post | 8.19 ± 2.13 | 8.15 ± 2.67 | 8.21 ± 1.58 | |
| I can resist eating when I am watching TV or smartphone | ||||
| Pre | 7.59 ± 2.36 | 7.46 ± 2.30 | 7.71 ± 2.49 | |
| Post | 7.26 ± 2.30 | 7.69 ± 2.39 | 6.86 ± 2.21 | |
| I can resist eating when I am watching food advertisement or eating show | ||||
| Pre | 7.85 ± 2.33 | 7.08 ± 2.53 | 8.57 ± 1.95 | |
| Post | 8.74 ± 1.70 | 9.00 ± 1.78 | 8.50 ± 1.65 | |
| Subtotal | ||||
| Pre | 6.69 ± 1.72 | 6.41 ± 1.61 | 6.94 ± 1.84 | |
| Post | 7.30 ± 1.50 | 7.40 ± 1.56 | 7.20 ± 1.50 | |
| Pre | 6.84 ± 1.64 | 6.49 ± 1.36 | 7.16 ± 1.86 | |
| Post | 7.69 ± 1.26* | 7.89 ± 1.06** | 7.50 ± 1.43 |
Table 6.Changes in glycemic indicators
Table 7.Changes in the NQ score of respective dimension
| Variable | Pre-intervention (n = 27) | Post-intervention (n = 27) | P-value |
|---|---|---|---|
| NQ category | |||
| Balance | 14.56 ± 3.24 | 15.70 ± 3.82 | 0.136 |
| Moderation | 16.44 ± 4.11 | 15.67 ± 2.95 | 0.265 |
| Practice | 12.74 ± 2.19 | 13.22 ± 2.52 | 0.428 |
| Overall NQ score | 43.74 ± 6.32 | 44.59 ± 6.24 | 0.485 |
| Frequency of sweetened-beverage consumption1) | 1.67 ± 1.09 | 2.78 ± 1.11 | 0.473 |
| Frequency of exercise2) | 2.44 ± 1.03 | 3.44 ± 0.87 | 0.512 |
| Evaluation (range of overall NQ score) | |||
| High (68.5–100) | 0 | 0 | |
| Medium (52.7–68.5) | 2 | 3 | |
| Low (0–52.7) | 25 | 24 |
Table 8.Changes in the NQ score of each question according to BMI group
| Category | Variable | Total (n = 27) | BMI < 23 kg/m2 (n = 13) | BMI ≥ 23 kg/m2 (n = 14) |
|---|---|---|---|---|
| Balance | Number of vegetable dishes excluding Kimchi at each meal | |||
| Pre | 2.67 ± 1.21 | 2.69 ± 1.11 | 2.64 ± 1.34 | |
| Post | 2.78 ± 0.70 | 2.77 ± 0.83 | 2.79 ± 0.58 | |
| Intake frequency of fruits | ||||
| Pre | 1.63 ± 0.49 | 1.69 ± 0.48 | 1.57 ± 0.51 | |
| Post | 1.89 ± 0.58** | 2.00 ± 0.71* | 1.79 ± 0.43 | |
| Intake frequency of milk or dairy products | ||||
| Pre | 1.78 ± 0.70 | 1.54 ± 0.52 | 2.00 ± 0.78 | |
| Post | 1.89 ± 0.85 | 1.62 ± 0.51 | 2.14 ± 1.03 | |
| Intake frequency of fishes | ||||
| Pre | 1.41 ± 0.64 | 1.46 ± 0.66 | 1.36 ± 0.63 | |
| Post | 1.41 ± 0.64 | 1.38 ± 0.65 | 1.43 ± 0.65 | |
| Intake frequency of beans or bean products | ||||
| Pre | 1.67 ± 0.78 | 1.62 ± 0.51 | 1.71 ± 0.99 | |
| Post | 1.81 ± 0.92 | 1.62 ± 0.51 | 2.00 ± 1.18 | |
| Intake frequency of nuts | ||||
| Pre | 1.63 ± 0.84 | 1.54 ± 0.78 | 1.71 ± 0.91 | |
| Post | 1.89 ± 1.05 | 1.54 ± 0.88 | 2.21 ± 1.12 | |
| Intake frequency of whole grains or mixed grains | ||||
| Pre | 2.19 ± 1.24 | 1.85 ± 0.90 | 2.50 ± 1.45 | |
| Post | 2.41 ± 0.97 | 2.08 ± 0.64 | 2.71 ± 1.14 | |
| Intake frequency of breakfast | ||||
| Pre | 1.59 ± 1.19 | 1.31 ± 0.63 | 1.86 ± 1.51 | |
| Post | 1.63 ± 1.18 | 1.46 ± 0.78 | 1.79 ± 1.48 | |
| Moderation | Moderation Intake frequency of greasy baked products or snacks | |||
| Pre | 3.15 ± 1.17 | 3.38 ± 1.19 | 2.93 ± 1.14 | |
| Post | 3.04 ± 0.90 | 3.08 ± 0.64 | 3.00 ± 1.11 | |
| Intake frequency of fast foods | ||||
| Pre | 2.78 ± 0.70 | 2.77 ± 0.60 | 2.79 ± 0.80 | |
| Post | 2.67 ± 0.88 | 2.77 ± 0.73 | 2.57 ± 1.02 | |
| Intake frequency of spicy and salty soup and stew | ||||
| Pre | 2.48 ± 0.80 | 2.54 ± 0.88 | 2.43 ± 0.76 | |
| Post | 2.41 ± 0.89 | 2.46 ± 0.88 | 2.36 ± 0.93 | |
| Intake frequency of red meats | ||||
| Pre | 2.93 ± 1.11 | 2.92 ± 1.19 | 2.93 ± 1.07 | |
| Post | 3.26 ± 0.81 | 3.23 ± 0.83 | 3.29 ± 0.83 | |
| Intake frequency of processed meats | ||||
| Pre | 2.56 ± 0.97 | 2.62 ± 0.65 | 2.50 ± 1.22 | |
| Post | 2.44 ± 1.01 | 2.46 ± 0.88 | 2.43 ± 1.16 | |
| Frequency of overeating or binge eating | ||||
| Pre | 2.56 ± 1.53 | 2.46 ± 1.56 | 2.64 ± 1.55 | |
| Post | 1.85 ± 0.99 | 1.62 ± 0.87 | 2.07 ± 1.07 | |
| Practice | Efforts to have healthy eating habits | |||
| Pre | 3.04 ± 0.71 | 2.77 ± 0.83 | 3.29 ± 0.47 | |
| Post | 3.30 ± 0.72 | 3.38 ± 0.87 | 3.21 ± 0.58 | |
| Nutrition labeling check when eating out or purchasing processed foods | ||||
| Pre | 2.59 ± 1.15 | 2.54 ± 1.27 | 2.64 ± 1.08 | |
| Post | 3.22 ± 1.34* | 3.15 ± 1.41 | 3.29 ± 1.33 | |
| Washing hands practices before eating meals | ||||
| Pre | 4.00 ± 1.00 | 3.85 ± 1.21 | 4.14 ± 0.77 | |
| Post | 4.04 ± 0.94 | 4.15 ± 0.99 | 3.93 ± 0.92 | |
| Heavy drinking frequency of alcohol | ||||
| Pre | 3.11 ± 1.31 | 3.15 ± 1.34 | 3.07 ± 1.33 | |
| Post | 2.67 ± 1.30 | 2.38 ± 1.19 | 2.93 ± 1.38 |
Table 9.Satisfaction evaluation of flash-CGM and nutrition coaching services
- 1. Hafiz AA, Gallagher AM, Devine L, Hill AJ. University student practices and perceptions on eating behaviours whilst living away from home. Int J Educ Res 2023; 117: 102133.Article
- 2. Kim D, Park D, Han YH, Hyun T. Improving the nutrition quotient and dietary self-efficacy through personalized goal setting and smartphone-based nutrition counseling among adults in their 20s and 30s. J Nutr Health 2023; 56: 419-438. ArticleLink
- 3. Korea Disease Control and Prevention Agency (KDCA). Korea Health Statistics 2021: Korea National Health and Nutrition Examination Survey (KNHANES VIII-3). KDCA; 2022 Dec. Report No. 11-1790387-000796-10.
- 4. Hong SH, Kim JM. Relationship between eating behavior and healthy eating competency of single-person and multi-person households by age group. Korean J Community Nutr 2021; 26(5): 337-349. ArticleLink
- 5. Korean Statistical Information Service. Trends in experience rates of nutrition education and counseling [Internet]. Statistics Korea; 2025 [cited 2025 Jan 23]. Available from: https://kosis.kr/statHtml/statHtml.do?orgId=177&tblId=DT_11702_N041&conn_path=I2
- 6. Kim MH, Yeon JY. Change of dietary habits and the use of home meal replacement and delivered foods due to COVID-19 among college students in Chungcheong province, Korea. J Nutr Health 2021; 54(4): 383-397. ArticleLink
- 7. Shin CR. A survey on the amount of activity, status of dietary habits, and needs for nutritional education in accordance with health concern in adults in the 20’s to 30’s. [master’s thesis]. Kookmin University; 2021.
- 8. Kim YH, Shin SR. Development and effectiveness of a mobile health lifestyle program for university students. J Korean Acad Community Health Nurs 2021; 32(2): 150-161. ArticleLink
- 9. Stephens JD, Yager AM, Allen J. Smartphone technology and text messaging for weight loss in young adults: a randomized controlled trial. J Cardiovasc Nurs 2017; 32(1): 39-46. ArticlePubMedPMC
- 10. Harris SB, Levrat-Guillen F. Use of the FreeStyle Libre system and diabetes treatment progression in T2DM: results from a retrospective cohort study using a Canadian private payer claims database. Diabetes Obes Metab 2023; 25(6): 1704-1713. ArticlePubMed
- 11. Ajjan RA, Battelino T, Cos X, Del Prato S, Philips JC, Meyer L, et al. Continuous glucose monitoring for the routine care of type 2 diabetes mellitus. Nat Rev Endocrinol 2024; 20(7): 426-440. ArticlePubMedPDF
- 12. Kim JY, Jin SM, Andrade SB, Chen B, Kim JH. Real-world continuous glucose monitoring data from a population with type 1 diabetes in South Korea: nationwide single-system analysis. Diabetes Technol Ther 2024; 26(6): 394-402. ArticlePubMed
- 13. Kim YI, Choi Y, Park J. The role of continuous glucose monitoring in physical activity and nutrition management: perspectives on present and possible uses. Phys Act Nutr 2023; 27(3): 44-51. ArticlePubMedPMCPDF
- 14. Shah VN, DuBose SN, Li Z, Beck RW, Peters AL, Weinstock RS, et al. Continuous glucose monitoring profiles in healthy nondiabetic participants: a multicenter prospective study. J Clin Endocrinol Metab 2019; 104(10): 4356-4364. ArticlePubMedPMCPDF
- 15. Shmerling RH. Is blood sugar monitoring without diabetes worthwhile? [Internet]. Harvard Health Publishing; 2024 [cited 2025 Jan 23]. Available from: https://www.health.harvard.edu/blog/is-blood-sugar-monitoring-without-diabetes-worthwhile-202106112473
- 16. Klonoff DC, Nguyen KT, Xu NY, Gutierrez A, Espinoza JC, Vidmar AP. Use of continuous glucose monitors by people without diabetes: an idea whose time has come? J Diabetes Sci Technol 2023; 17(6): 1686-1697. ArticlePubMedLink
- 17. Bandura A. Self-efficacy: the exercise of control. W. H. Freeman; 1997.
- 18. Contento IR. Nutrition education: linking research, theory, and practice: linking research, theory, and practice. 2nd ed. Jones & Bartlett Publishers; 2010.
- 19. Deliens T, Van Crombruggen R, Verbruggen S, De Bourdeaudhuij I, Deforche B, Clarys P. Dietary interventions among university students: a systematic review. Appetite 2016; 105: 14-26. ArticlePubMed
- 20. Dr. diary. Gluet: glucose diet. Dr. diary; 2022.
- 21. Clark MM, Abrams DB, Niaura RS, Eaton CA, Rossi JS. Self-efficacy in weight management. J Consult Clin Psychol 1991; 59(5): 739-744. ArticlePubMed
- 22. Oh MH, Hong K, Kim SE. Relationship among the use of food-related content, dietary behaviors, and dietary self-efficacy of high school students in Seoul and Gyeonggi areas. J Nutr Health 2019; 52(3): 297-309. ArticleLink
- 23. Yook SM, Lim YS, Lee JS, Kim KN, Hwang HJ, Kwon S, et al. Revision of nutrition quotient for Korean adults: NQ-2021. J Nutr Health 2022; 55(2): 278-295. ArticleLink
- 24. Hu Y, Shen Y, Yan R, Li F, Ding B, Wang H, et al. Relationship between estimated glycosylated hemoglobin using flash glucose monitoring and actual measured glycosylated hemoglobin in a Chinese population. Diabetes Ther 2020; 11(9): 2019-2027. ArticlePubMedPMCPDF
REFERENCES
Figure & Data
REFERENCES
Citations
Citations to this article as recorded by 
 Cite
CiteThe impact of flash continuous glucose monitoring and nutrition coaching on dietary self-efficacy and weight management in university students in Korea: a pre-post intervention study


Fig. 1. Study design and flow of the 4-week multicomponent intervention. The intervention included baseline surveys, a 4-hour group nutrition education and flash-CGM workshop (week 1), weekly 5A’s-based nutrition coaching, app-based dietary and weight monitoring and a post-intervention evaluation (week 5). A total of 40 participants were screened, with 27 completing the study. CGM, continuous glucose monitoring; BMI, body mass index.
Fig. 2. Changes in BMI before and after the intervention by group. BMI significantly decreased in the total sample (*P < 0.05). No statistically significant changes were observed in the BMI < 23 kg/m2 and BMI ≥ 23 kg/m2 subgroups. BMI, body mass index; ns, not significant.
Fig. 1.
Fig. 2.
The impact of flash continuous glucose monitoring and nutrition coaching on dietary self-efficacy and weight management in university students in Korea: a pre-post intervention study
| Period | Time | Lecture topics | Contents |
|---|---|---|---|
| 1st | 10:00–10:50 | The importance of healthy eating | Diet and health problems in young adults |
| 2nd | 11:00–11:50 | What constitutes a healthy diet? | Principles of balance, variety, moderation of diet |
| 3rd | 13:00–13:50 | What are my nutritional problems? | General characteristics, nutrition quotient and dietary self- efficacy survey |
| 4th | 14:00–14:50 | Smart healthcare tools for healthy weight management | How can I manage my body weight? |
| Week | Nutrition coaching topic | Objective |
|---|---|---|
| 1 | Introduction to flash-CGM and nutritional basics | Educate participants on CGM functionality, glucose trends, and healthy eating guidelines |
| 2 | Meal timing and macronutrient distribution | Optimize meal schedules and balance macronutrients to minimize glucose spikes |
| 3 | Managing emotional and environmental eating triggers | Identify and implement strategies to control eating influenced by emotions or environmental cues |
| 4 | Sustaining behavioral changes and long-term goal setting | Review progress, address challenges, and set long-term goals for sustainable behavior change |
| Variable | Category | Total (n = 27) | BMI < 23 kg/m2 (n = 13) | BMI ≥ 23 kg/m2 (n = 14) |
|---|---|---|---|---|
| Age (year) | 20.33 ± 1.71 | 19.69 ± 1.49 | 21.0 ± 1.57 | |
| Sex | Female | 16 (59.25) | 9 (33.33) | 7 (25.93) |
| Male | 11 (40.74) | 4 (14.81) | 7 (25.93) | |
| Residence | Living at home | 9 (33.33) | 6 (22.22) | 3 (11.11) |
| Dormitory | 13 (48.15) | 5 (18.52) | 8 (29.63) | |
| Self-boarding | 5 (18.52) | 2 (7.41) | 3 (11.11) | |
| Smoking status | Current smoker | 5 (18.52) | 2 (7.41) | 3 (11.11) |
| Ex-smoker | 1 (3.70) | 1 (3.70) | 0 (0.00) | |
| Non-smoker | 21 (77.78) | 10 (37.04) | 11 (40.74) | |
| Alcohol drinking | ≥ 3 times/week | 3 (11.11) | 2 (7.41) | 1 (3.70) |
| 1–2 times/week | 4 (14.81) | 3 (11.11) | 1 (3.70) | |
| 1–3 times/month | 0 (0.00) | 0 (0.00) | 0 (0.00) | |
| Rarely | 20 (74.07) | 8 (29.63) | 12 (44.44) | |
| Vitamin & mineral supplements | Everyday | 6 (22.22) | 3 (11.11) | 3 (11.11) |
| 3–4 times/week | 2 (7.41) | 1 (3.70) | 1 (3.70) | |
| 1–2 times/week | 2 (7.41) | 0 (0.00) | 2 (7.41) | |
| 1 time/week | 2 (7.41) | 2 (7.41) | 0 (0.00) | |
| Never | 15 (55.56) | 7 (25.93) | 8 (29.63) | |
| Experience for nutrition coaching during the past year | Yes | 0 (0.00) | 0 (0.00) | 0 (0.00) |
| No | 27 (100) | 13 (48.15) | 14 (51.85) | |
| BMI (kg/m2) | 24.17 ± 5.64 | 19.75 ± 1.92 | 28.68 ± 4.69 | |
| Underweight (BMI < 18.5) | 2 (7.41) | 2 (7.41) | 0 (0.00) | |
| Normal (18.5 ≤ BMI < 23) | 11 (40.74) | 11 (40.74) | 0 (0.00) | |
| Overweight (23≤ BMI < 25) | 4 (14.81) | 0 (0.00) | 4 (14.81) | |
| Obese (BMI ≥ 25) | 10 (37.04) | 0 (0.00) | 10 (37.04) |
| Primary dietary goal | Total (n = 27) | BMI < 23 kg/m2 (n = 13) | BMI ≥ 23 kg/m2 (n = 14) |
|---|---|---|---|
| Weight loss | 15 (55.60) | 5 (38.50) | 10 (71.40) |
| Correction to nutritionally balanced diet | 6 (22.20) | 5 (38.50) | 1 (7.10) |
| Regular eating habits | 4 (14.80) | 1 (7.70) | 3 (21.40) |
| Correction of impulsive eating habits | 1 (3.70) | 1 (7.70) | 0 (0.00) |
| Disease prevention through diet | 1 (3.70) | 1 (7.70) | 0 (0.00) |
| Category | Variable | Total (n = 27) | BMI < 23 kg/m2 (n = 13) | BMI ≥ 23 kg/m2 (n = 14) |
|---|---|---|---|---|
| Affective factor control efficacy | I can resist eating when I am stressed | |||
| Pre | 5.78 ± 2.76 | 4.85 ± 2.67 | 6.64 ± 2.65 | |
| Post | 7.52 ± 1.67 |
7.46 ± 1.56 |
7.57 ± 1.83 | |
| I can resist eating when I am depressed | ||||
| Pre | 6.81 ± 2.84 | 6.46 ± 2.93 | 7.14 ± 2.82 | |
| Post | 7.67 ± 1.82 | 7.62 ± 1.89 | 7.71 ± 1.82 | |
| I can resist eating when I am angry | ||||
| Pre | 6.74 ± 2.82 | 6.54 ± 2.93 | 6.93 ± 2.81 | |
| Post | 7.56 ± 1.89 | 7.62 ± 1.98 | 7.50 ± 1.87 | |
| I can resist eating when I am bored | ||||
| Pre | 7.44 ± 2.34 | 7.23 ± 2.31 | 7.64 ± 2.44 | |
| Post | 7.33 ± 2.42 | 7.85 ± 2.58 | 6.86 ± 2.25 | |
| I can resist eating when I feel unstable | ||||
| Pre | 7.93 ± 1.80 | 7.85 ± 1.63 | 8.00 ± 2.00 | |
| Post | 8.48 ± 1.60 | 9.00 ± 1.15 |
8.00 ± 1.84 | |
| I can resist eating when I am tired | ||||
| Pre | 5.70 ± 2.71 | 4.85 ± 2.67 | 6.50 ± 2.59 | |
| Post | 8.74 ± 1.40 |
9.15 ± 0.90 |
8.36 ± 1.69 |
|
| I can resist eating when I am nervous | ||||
| Pre | 8.41 ± 1.80 | 8.15 ± 1.52 | 8.64 ± 2.06 | |
| Post | 8.93 ± 1.54 | 9.54 ± 0.78 |
8.36 ± 1.86 | |
| Subtotal | ||||
| Pre | 6.97 ± 1.81 | 6.56 ± 1.49 | 7.36 ± 2.04 | |
| Post | 8.03 ± 1.41 |
8.32 ± 1.08 |
7.76 ± 1.65 | |
| Environ mental stimulus control efficacy | I can resist eating even when others are pressuring me to eat | |||
| Pre | 6.44 ± 2.49 | 6.38 ± 2.69 | 6.50 ± 2.38 | |
| Post | 7.33 ± 1.80 | 7.46 ± 1.39 | 7.21 ± 2.15 | |
| I can resist eating when I eat at even event (wedding, holiday, etc.) or at a company dinner | ||||
| Pre | 5.33 ± 2.53 | 5.38 ± 2.66 | 5.29 ± 2.49 | |
| Post | 5.96 ± 2.30 | 5.85 ± 2.41 | 6.07 ± 2.27 | |
| I can resist eating when I eat with my friends | ||||
| Pre | 4.96 ± 2.67 | 4.62 ± 2.63 | 5.29 ± 2.76 | |
| Post | 6.30 ± 2.37 |
6.23 ± 2.65 | 6.36 ± 2.17 | |
| I can resist eating when I am alone | ||||
| Pre | 7.93 ± 2.22 | 7.54 ± 2.40 | 8.29 ± 2.05 | |
| Post | 8.19 ± 2.13 | 8.15 ± 2.67 | 8.21 ± 1.58 | |
| I can resist eating when I am watching TV or smartphone | ||||
| Pre | 7.59 ± 2.36 | 7.46 ± 2.30 | 7.71 ± 2.49 | |
| Post | 7.26 ± 2.30 | 7.69 ± 2.39 | 6.86 ± 2.21 | |
| I can resist eating when I am watching food advertisement or eating show | ||||
| Pre | 7.85 ± 2.33 | 7.08 ± 2.53 | 8.57 ± 1.95 | |
| Post | 8.74 ± 1.70 | 9.00 ± 1.78 | 8.50 ± 1.65 | |
| Subtotal | ||||
| Pre | 6.69 ± 1.72 | 6.41 ± 1.61 | 6.94 ± 1.84 | |
| Post | 7.30 ± 1.50 | 7.40 ± 1.56 | 7.20 ± 1.50 | |
| Pre | 6.84 ± 1.64 | 6.49 ± 1.36 | 7.16 ± 1.86 | |
| Post | 7.69 ± 1.26 |
7.89 ± 1.06 |
7.50 ± 1.43 |
| Measurements | Pre-intervention (n = 27) | Post-intervention (n = 27) | P-value |
|---|---|---|---|
| Overall blood glucose distribution and variability (mg/dL) | |||
| Total (n = 27) | 105.75 ± 11.47 | 104.77 ± 9.40 | 0.822 |
| BMI < 23 kg/m2 (n = 13) | 104.68 ± 9.91 | 102.82 ± 7.11 | 0.635 |
| BMI ≥ 23 kg/m2 (n = 14) | 106.75 ± 13.05 | 106.59 ± 11.07 | 0.808 |
| Overall estimated HbA1c (%) | |||
| Total (n = 27) | 5.26 ± 0.32 | 5.24 ± 0.33 | 0.863 |
| BMI < 23 kg/m2 (n = 13) | 5.27 ± 0.33 | 5.28 ± 0.34 | 0.48 |
| BMI ≥ 23 kg/m2 (n = 14) | 5.25 ± 0.33 | 5.21 ± 0.32 | 0.18 |
| Variable | Pre-intervention (n = 27) | Post-intervention (n = 27) | P-value |
|---|---|---|---|
| NQ category | |||
| Balance | 14.56 ± 3.24 | 15.70 ± 3.82 | 0.136 |
| Moderation | 16.44 ± 4.11 | 15.67 ± 2.95 | 0.265 |
| Practice | 12.74 ± 2.19 | 13.22 ± 2.52 | 0.428 |
| Overall NQ score | 43.74 ± 6.32 | 44.59 ± 6.24 | 0.485 |
| Frequency of sweetened-beverage consumption |
1.67 ± 1.09 | 2.78 ± 1.11 | 0.473 |
| Frequency of exercise |
2.44 ± 1.03 | 3.44 ± 0.87 | 0.512 |
| Evaluation (range of overall NQ score) | |||
| High (68.5–100) | 0 | 0 | |
| Medium (52.7–68.5) | 2 | 3 | |
| Low (0–52.7) | 25 | 24 |
| Category | Variable | Total (n = 27) | BMI < 23 kg/m2 (n = 13) | BMI ≥ 23 kg/m2 (n = 14) |
|---|---|---|---|---|
| Balance | Number of vegetable dishes excluding Kimchi at each meal | |||
| Pre | 2.67 ± 1.21 | 2.69 ± 1.11 | 2.64 ± 1.34 | |
| Post | 2.78 ± 0.70 | 2.77 ± 0.83 | 2.79 ± 0.58 | |
| Intake frequency of fruits | ||||
| Pre | 1.63 ± 0.49 | 1.69 ± 0.48 | 1.57 ± 0.51 | |
| Post | 1.89 ± 0.58 |
2.00 ± 0.71 |
1.79 ± 0.43 | |
| Intake frequency of milk or dairy products | ||||
| Pre | 1.78 ± 0.70 | 1.54 ± 0.52 | 2.00 ± 0.78 | |
| Post | 1.89 ± 0.85 | 1.62 ± 0.51 | 2.14 ± 1.03 | |
| Intake frequency of fishes | ||||
| Pre | 1.41 ± 0.64 | 1.46 ± 0.66 | 1.36 ± 0.63 | |
| Post | 1.41 ± 0.64 | 1.38 ± 0.65 | 1.43 ± 0.65 | |
| Intake frequency of beans or bean products | ||||
| Pre | 1.67 ± 0.78 | 1.62 ± 0.51 | 1.71 ± 0.99 | |
| Post | 1.81 ± 0.92 | 1.62 ± 0.51 | 2.00 ± 1.18 | |
| Intake frequency of nuts | ||||
| Pre | 1.63 ± 0.84 | 1.54 ± 0.78 | 1.71 ± 0.91 | |
| Post | 1.89 ± 1.05 | 1.54 ± 0.88 | 2.21 ± 1.12 | |
| Intake frequency of whole grains or mixed grains | ||||
| Pre | 2.19 ± 1.24 | 1.85 ± 0.90 | 2.50 ± 1.45 | |
| Post | 2.41 ± 0.97 | 2.08 ± 0.64 | 2.71 ± 1.14 | |
| Intake frequency of breakfast | ||||
| Pre | 1.59 ± 1.19 | 1.31 ± 0.63 | 1.86 ± 1.51 | |
| Post | 1.63 ± 1.18 | 1.46 ± 0.78 | 1.79 ± 1.48 | |
| Moderation | Moderation Intake frequency of greasy baked products or snacks | |||
| Pre | 3.15 ± 1.17 | 3.38 ± 1.19 | 2.93 ± 1.14 | |
| Post | 3.04 ± 0.90 | 3.08 ± 0.64 | 3.00 ± 1.11 | |
| Intake frequency of fast foods | ||||
| Pre | 2.78 ± 0.70 | 2.77 ± 0.60 | 2.79 ± 0.80 | |
| Post | 2.67 ± 0.88 | 2.77 ± 0.73 | 2.57 ± 1.02 | |
| Intake frequency of spicy and salty soup and stew | ||||
| Pre | 2.48 ± 0.80 | 2.54 ± 0.88 | 2.43 ± 0.76 | |
| Post | 2.41 ± 0.89 | 2.46 ± 0.88 | 2.36 ± 0.93 | |
| Intake frequency of red meats | ||||
| Pre | 2.93 ± 1.11 | 2.92 ± 1.19 | 2.93 ± 1.07 | |
| Post | 3.26 ± 0.81 | 3.23 ± 0.83 | 3.29 ± 0.83 | |
| Intake frequency of processed meats | ||||
| Pre | 2.56 ± 0.97 | 2.62 ± 0.65 | 2.50 ± 1.22 | |
| Post | 2.44 ± 1.01 | 2.46 ± 0.88 | 2.43 ± 1.16 | |
| Frequency of overeating or binge eating | ||||
| Pre | 2.56 ± 1.53 | 2.46 ± 1.56 | 2.64 ± 1.55 | |
| Post | 1.85 ± 0.99 | 1.62 ± 0.87 | 2.07 ± 1.07 | |
| Practice | Efforts to have healthy eating habits | |||
| Pre | 3.04 ± 0.71 | 2.77 ± 0.83 | 3.29 ± 0.47 | |
| Post | 3.30 ± 0.72 | 3.38 ± 0.87 | 3.21 ± 0.58 | |
| Nutrition labeling check when eating out or purchasing processed foods | ||||
| Pre | 2.59 ± 1.15 | 2.54 ± 1.27 | 2.64 ± 1.08 | |
| Post | 3.22 ± 1.34 |
3.15 ± 1.41 | 3.29 ± 1.33 | |
| Washing hands practices before eating meals | ||||
| Pre | 4.00 ± 1.00 | 3.85 ± 1.21 | 4.14 ± 0.77 | |
| Post | 4.04 ± 0.94 | 4.15 ± 0.99 | 3.93 ± 0.92 | |
| Heavy drinking frequency of alcohol | ||||
| Pre | 3.11 ± 1.31 | 3.15 ± 1.34 | 3.07 ± 1.33 | |
| Post | 2.67 ± 1.30 | 2.38 ± 1.19 | 2.93 ± 1.38 |
| Category | Variable | Satisfaction scores (n = 27) |
|---|---|---|
| Educational effectiveness | The nutrition education helped me learn that postprandial glucose changes can assist in weight management | 4.67 ± 0.55 |
| The contents of Gluet textbook were easy to understand | 4.74 ± 0.45 | |
| Device usability | The flash-CGM device made it easy to monitor my blood glucose levels | 4.78 ± 0.42 |
| I was able to understand my daily blood glucose patterns using the flash-CGM device | 4.70 ± 0.47 | |
| The flash-CGM device helped me feel capable of managing my weight | 4.52 ± 0.64 | |
| Using the flash-CGM device and nutrition coaching increased my interest in blood glucose and weight control | 4.52 ± 0.70 | |
| Coaching satisfaction | The nutrition coach tailored the service to my ability and needs | 4.56 ± 0.51 |
| I believe that the materials provided by the nutrition coach are accurate and reliable | 4.59 ± 0.57 | |
| I was satisfied with the attitude and behavior of the nutrition coach | 4.78 ± 0.42 | |
| I actively utilized the nutrition coaching service | 4.11 ± 1.05 | |
| I would recommend the nutrition coaching service to family and friends | 4.63 ± 0.56 | |
| I am willing to purchase nutrition coaching service in the future | 4.11 ± 0.89 | |
| Behavioral and lifestyle changes | The coaching service improved my dietary choices over 4 weeks | 4.37 ± 0.88 |
| The coaching service helped improve other health habits such as exercise | 4.44 ± 0.75 | |
| I am confident in maintaining the improved lifestyle habits after the coaching service ends | 4.33 ± 0.83 | |
| Overall | 4.52 ± 0.65 |
Table 1. Baseline group nutrition education session
Table 2. Weekly consultation topics for 5A’s nutrition coaching1)
CGM, continuous glucose monitoring. Weekly nutrition coaching sessions (average 15–30 minutes) were conducted via a KakaoTalk channel, guided by the 5A’s model: Assess, Advise, Agree, Assist, and Arrange for self-management support provided with the Gluet textbook.
Table 3. General characteristics of the participants
Mean ± SD or n (%). BMI, body mass index.
Table 4. Primary dietary goals reported by participants according to BMI group
n (%). BMI, body mass index.
Table 5. Changes in dietary self-efficacy scores by intervention according to BMI group
Mean ± SD. Values are expressed as mean ± SD on a 10-point Likert scale. Higher score means higher DSE. BMI, body mass index. The
Table 6. Changes in glycemic indicators
Mean ± SD. Glycemic indicators including average blood glucose and estimated HbA1c were derived from CGM data through the LibreView platform. BMI, body mass index; HbA1c, hemoglobin A1c (glycated hemoglobin). The
Table 7. Changes in the NQ score of respective dimension
Mean ± SD or n. NQ, nutrition quotient. 5-point Likert scale (1 = rarely, 5 = everyday). 5-point Likert scale (1 = ≤ 1–2 times/week, 5 = ≥ 3 times/day). The
Table 8. Changes in the NQ score of each question according to BMI group
Mean ± SD. The
Table 9. Satisfaction evaluation of flash-CGM and nutrition coaching services
Mean ± SD. Values are expressed as mean ± SD on a 5-point Likert scale (1 = not satisfied at all, 5 = very satisfied). CGM, continuous glucose monitoring.


