
Articles
- Page Path
- HOME > Korean J Community Nutr > Volume 17(1); 2012 > Article
-
Original Article
- A Comparison of Salty Taste Assessments and Dietary Attitudes and Dietary Behaviors Associated with High-Salt Diets in Four Regions in Korea
- Hyun-Hee Kim, Yun-Young Jung, Yeon-Kyung Lee
-
Korean Journal of Community Nutrition 2012;17(1):38-48.
DOI: https://doi.org/10.5720/kjcn.2012.17.1.38
Published online: February 29, 2012
Department of Food Science and Nutrition, Kyungpook National University, Daegu, Korea.
- Corresponding author: Yeon-Kyung Lee, Department of Food Science and Nutrition, Kyungpook National University, 1370 Sankyuk Dong, Buk-ku Daegu 702-701, Korea. Tel: (053) 950-6234, Fax: (053) 950-6229, yklee@knu.ac.kr
• Received: October 13, 2011 • Revised: January 20, 2012 • Accepted: February 7, 2012
Copyright © 2012 The Korean Society of Community Nutrition
- 2,097 Views
- 0 Download
- 20 Crossref
Abstract
- The purpose of this study was to compare regional differences in salty taste assessments, nutrition knowledge, dietary attitudes and dietary behaviors associated with high-salt diets in four national regions in Korea (Region 1: Seoul, Sokcho, Region 2: Buyeo, Jecheon, Gong Ju, Region 3: Daegu, Gyeongsan, Region 4: Jeon Ju). Subjects were 860 persons who participated in sodium reduction campaign. The result of the salty taste assessment by region was not significantly different. The nutrition knowledge score of subjects in Region 1 was the highest. Dietary attitude scores that showed preference for high-salt diets of Region 2 and Region 4 subjects were higher than those of Regions 1 and 3 subjects (p < 0.001). Dietary behavior scores were not significantly different among regions. The correlation between sodium intake and salty taste assessment was significant (p < 0.01). Older subjects who had high blood pressure levels and lower nutrition knowledge were more likely to have high sodium intakes. Even though the salty taste assessment and dietary behavior scores by region were not significantly different, the salty taste assessment scores had a significant negative correlation with nutrition knowledge and had a significant positive correlation with dietary attitude and dietary behavior in terms of preference for high-salt diets. Therefore, nationwide education regarding salt intake reduction and health and a campaign to encourage favorable attitudes and behavioral changes regarding consumption of a no-salt / low-salt diet is needed.
- 1. Ahn EJ, Noh HY, Chung JY, Paik HY. The effect of zinc status on salty taste acuity, salty taste preference, sodium intake and blood pressure in Korean young adults. Korean J Nutr. 2010; 43(2): 132-140.Article
- 2. Bertino M, Beauchamp GK, Engelman K. Long-term reduction in dietary sodium alters the taste of salt. Am J Clin Nutr. 1982; 36(6): 1134-1144.ArticlePubMed
- 3. Blais CA, Pangborn RM, Borhani NO, Ferrell MF, Prineas RJ, Laing B. Effect of dietary sodium restriction on taste responses to sodium chloride: a longitudinal study. Am J Clin Nutr. 1986; 44(2): 232-243.ArticlePubMed
- 4. Blaustein MP, Hamlyn JM. Role of natriuretic factor in essential hypertension: An hypothess. Ann Int Med. 1983; 98(5): 785-792.PubMed
- 5. Chang SO. Effect of a 6-month low sodium diet on the salt taste perception and pleasantness, blood pressure and the urinary sodium excretion in female college students. Korean J Nutr. 2010; 43(5): 433-442.Article
- 6. Cho MK. Development of education materials for lowing sodium intake and analysis of educational effects for elementary students. 2007; Changwon University; MS Thesis.
- 7. Chobanian AV, Hill M. National heart, lung, and blood institute workshop on sodium and blood pressure. A critical review of current scientific evidence. Hypertension. 2000; 35: 858-863.ArticlePubMed
- 8. Chung EJ, Shim Eg. Salt-related dietary behaviors and sodium intakes of university students in Gyeonggi-do. J Korean Soc Food Sci Nutr. 2008; 37(5): 578-588.Article
- 9. Contreras RJ, Ftank M. Sodium deprivation alters neural responses to gustatory stimuli. J Gen Physiol. 1979; 73(5): 569-594.ArticlePubMedPMCPDF
- 10. Department of Health. Choosing health: making health choices easier. 2004; UK.
- 11. Fregly MJ. Estimates of sodium and potassium intake. Ann Intern Med. 1983; 98(5 Pt 2): 792-799.ArticlePubMed
- 12. Jung YY, Shin EK, Lee HJ, Lee NH, Chun BY, Ann MY, Lee YK. Development and evaluation of nutrition education program on sodium reduction in elementary school students. Korean J Community Nutr. 2009; 14(6): 746-755.
- 13. Kim HH, Shin EK, Ann MY, Lee YK. Evaluation of the effectiveness of a salt reduction program for employees. Korean J Nutr. 2009a; 42(4): 350-357.Article
- 14. Kim HH, Shin EK, Lee HJ, Lee NH, Chun BY, Ann MY, Lee YK. Analysis by delphi survey of a performance evaluation index for a salt reduction project. Korean J Nutr. 2009b; 42(5): 486-495.Article
- 15. Kim JH, Choi MK. Salt intake behavior and blood pressure: the effect of taste sensitivity and preference. J Korean Living Sci Assoc. 2007; 16(4): 837-848.Article
- 16. Kim KS, Paik HY. A comparative study on optimum gustation of salt and sodium intake in young and middle aged Korean women. Korean J Nutr. 1992; 25(1): 32-41.
- 17. Kim MK, Hur YK, Choi JK. Interrater and intrater reliability of 'sip-and swallow' method for measurement of whole-mouth taste threshold. Korean J Oral Med. 2004; 29(2): 143-151.
- 18. Kim SH, Jang SY, Choi JK. Taste preference and whole mouth taste threshold in a Korean population in the age of the 3rd decade. Korean J Oral Med. 2003; 28(4): 413-426.
- 19. Kim YS, Paik HY. Measurement of the intake in Korean adult females. Korean J Nutr. 1987; 20(5): 341-349.
- 20. Kusaba T, Mori Y, Masami O, Hiroko N, Adachi T, Sugishita C, Sonomura K, Kimura T, Kishimoto N, Nakagawa H, Okigaki M, Hatta T, Matsubara H. Sodium restriction improves the gustatory threshold for salty taste in patients with chronic kidney disease gustatory threshold impairment in kidney disease. Kidney Int. 2009; 76(6): 638-643.PubMed
- 21. Lee HS. Studies on salt intake through eat - out foods in Andong area. Korean J Soc Food Sci. 1997; 13(3): 314-318.
- 22. Lee SK. A study on dietary sodium intake of office workers. 2011; Kyungwon University; MS Thesis.
- 23. Lee YK, Son SM, Lee JJ, Lee HJ, Shin EK, Park MJ. A study on a scheme to reduce sodium intake, report of management center for health promotion. Report of Korean Health Promotion Center. 2007.
- 24. MOHW/KIHASA. Korea National Health and Nutrition Examination Survey (KNHANES IV-2). 2008.
- 25. MOHW/KIHASA. Korea National Health and Nutrition Examination Survey (KNHANES IV-3). 2009.
- 26. Moon HK, Choi SO, Kim JE. Dishes contributing to sodium intake of elderly living in rural areas. Korean J Community Nutr. 2009; 14(1): 123-136.
- 27. Nam HW, Lee KY. A study on the sodium and potassium intakes and their metabolism of the pregnant women in Korea. Korean J Nutr. 1985; 18(3): 194-200.
- 28. Nicklas T, Weaver C, Britten P, Stitzel K. The 2005 dietary guidelines advisory committee: developing a key message. J Am Diet Assoc. 2005; 105(9): 1418-1424.ArticlePubMed
- 29. Nordin S, Razani LJ, Markison S, Murphy C. Age-associated increases in intensity discrimination for taste. Exp Aging Res. 2003; 29(3): 371-381.ArticlePubMed
- 30. Pamnani M, Huot S, Bugg J, Clough D, Haddy F. Demonstration of a humoral inhibitor of the Na-K pump in some models of experimental hypertension. Hypertension. 1981; 3(6 Pt 2): II-96-II-101.Article
- 31. Park HR, Jeong GO, Lee SL, Kim JY, Kang SA, Park KY, Ryou HJ. Workers intake too much salt from dishes of eating out and food service cafeterias; direct chemical analysis of sodium content. Nutr Res Pract. 2009; 3(4): 328-333.ArticlePubMedPMC
- 32. Park SK, Seo KI, Shon MY, Moon JS, Lee YH. Quality characteristics of home made Doenjang, a traditional Korean soybean paste. Korean J Soc Food Sci. 2000b; 16(2): 121-127.
- 33. Park YS, Son SM, Lim WJ, Kim SB, Jeong YS. Comparison of dietary behaviors related to sodium intake by gender and age. Korean J Community Nutr. 2008a; 13(1): 1-12.
- 34. Shin EK, Lee HJ, Ahn MY, Lee YK. Study on the development and evaluation of validity of salty taste assessment tool. Korean J Nutr. 2008a; 41(2): 184-191.
- 35. Shin EK, Lee HJ, Jun SY, Park EJ, Jung YY. Development and evaluation of nutrition education program for sodium reduction in foodservice operations. Korean J Community Nutr. 2008b; 13(2): 216-227.
- 36. Shin EK, Lee HJ, Lee JJ, Ann MY, Son SM, Lee YK. Estimation of sodium intake of adult female by 24-hour urine analysis, dietary records and dish frequency questionnaire (DFQ 55). Korean J Nutr. 2010; 43(1): 79-85.Article
- 37. Son SM, Huh GY. Salt intake and nutritional problems in Korean. Korean J Community Nutr. 2002; 7(3): 381-390.
- 38. Son SM, Huh GY, Lee HS. Development and evaluation of validity of dish frequency questionnaire (DFQ) and short DFQ using Na index for estimation of habitual sodium intake. Korean J Community Nutr. 2005; 10(5): 677-692.
- 39. Son SM, Park YS, Lim WJ, Kim SB. Preliminary study for low salt intake project of Korean people. 2006; Ministry of Health and Welfare.
- 40. Son SM, Park YS, Lim WJ, Kim SB, Jeong YS. Development and evaluation of validity of short dish frequency questionnaire (DFQ) for estimation of habitual sodium intake for Korean adults. Korean J Community Nutr. 2007a; 12(6): 838-853.
- 41. Son SM, Park YS, Lim WJ, Kim SB, Jeong YS. Sodium intakes of Korean adults with 24-hour urine analysis and dish frequency questionnaire and comparison of sodium intakes according to the regional area and dish group. Korean J Community Nutr. 2007b; 12(5): 545-558.
- 42. Willett WC, Sampson L, Stampfer MJ, Rosner B, Bain C, Witschi J, Hennekens CH, Speizer FE. Reproducibility and validity of a semiquantitative food frequency questionnaire. Am J Epidemiol. 1985; 122(1): 51-65.ArticlePubMed
- 43. Willett WC. In: Willett WC, editor. Food Frequency Methods. Nutritional eqidemiology. 1990; New York: Oxford University Press; 69-91.Article
- 44. Yamauchi Y, Endo S, Sakai F, Yoshimura I. A new whole-mouth gustatory test procedure. I. Thresholds and principal components analysis in healthy men and women. Acta Otolaryngol supple. 2002; 122(4): 39-48.Article
- 45. Yim JE, Cho MR, Yin CS, Seo BK, Koh HG, Choue RW. Nutrients and salt consumption of hypertension patients according to treatment status. Korean J Nutr. 2005; 38(9): 706-716.
REFERENCES
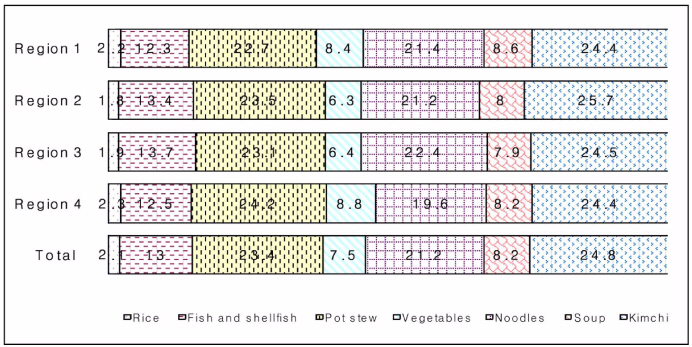
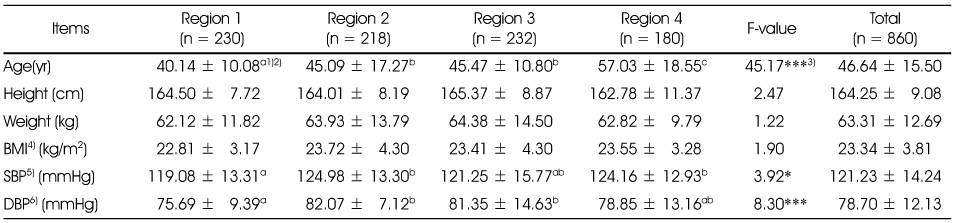
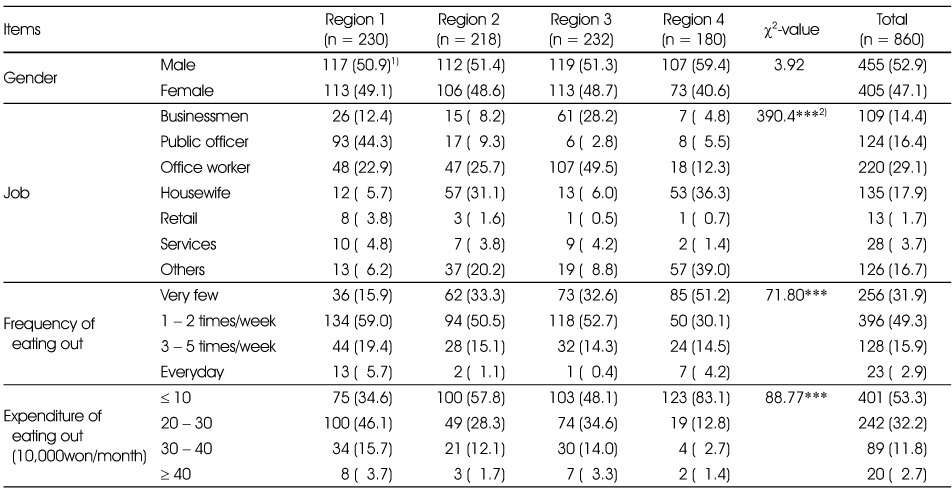
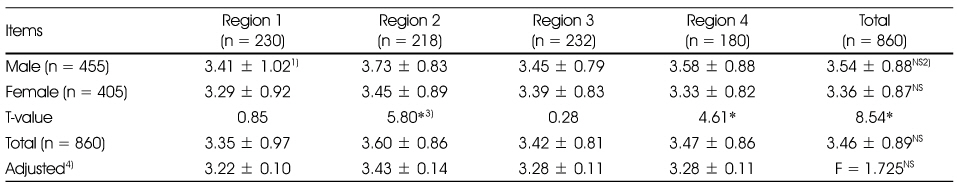
Table 4Comparison of nutrition knowledge by salty taste assessment among regions
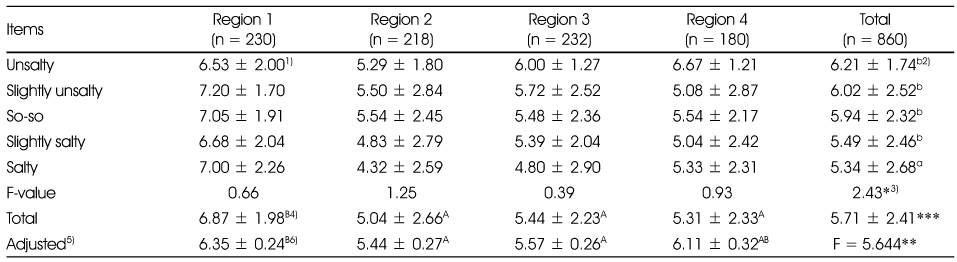
1) Mean ± SD, Total score = 10
2) Values with the different superscript are significantly different among different concentration by Duncan's multiple range test
3) *: p < 0.05, **: p < 0.01, ***: p < 0.001
4) Values with the different superscript are significantly different among different areas by Duncan's multiple range test
5) Adjusted for age, gender, job, frequency of eating out and expenditure of eating out
6) Values with the different superscript are significantly different among different areas by ANCOVA & Bonferroni comparison test
Table 5Comparison of eating attitude by salty taste assessment among regions
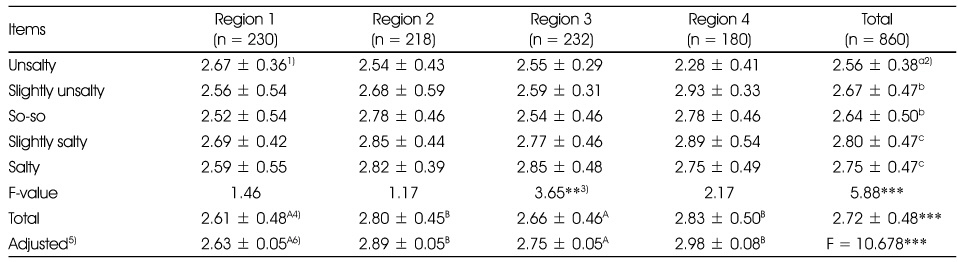
1) Mean ± SD, Total score = 5
2) Values with the different superscript are significantly different among different concentration by Duncan's multiple range test
3) **: p < 0.01, ***: p < 0.001
4) Values with the different superscript are significantly different among different areas by Duncan's multiple range test
5) Adjusted for age, gender, job, frequency of eating out and expenditure of eating out
6) Values with the different superscript are significantly different among different areas by ANCOVA & Bonferroni comparison test
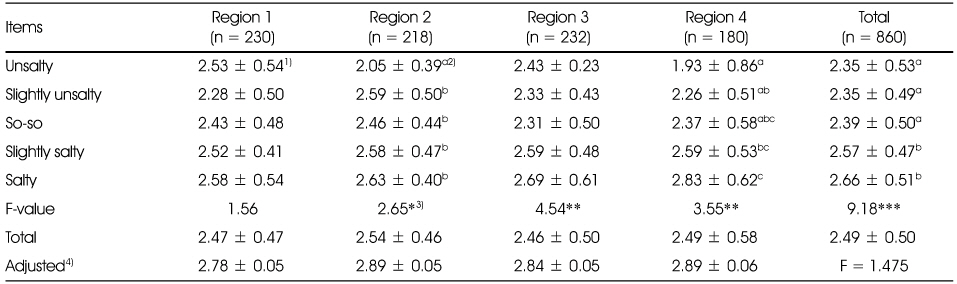
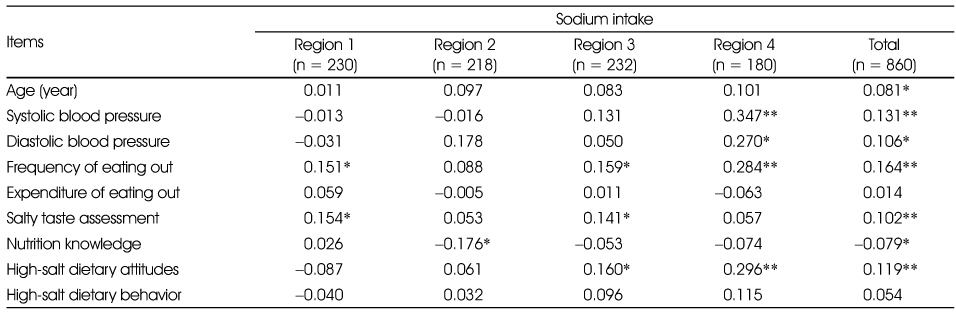
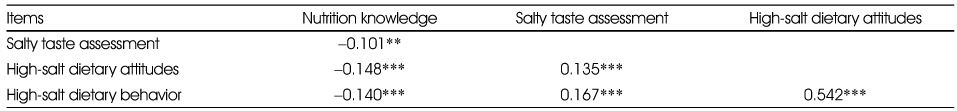
Figure & Data
REFERENCES
Citations
Citations to this article as recorded by 
- Estimation model for habitual 24-hour urinary-sodium excretion using simple questionnaires from normotensive Koreans
Ji-Sook Kong, Yeon-Kyung Lee, Mi Kyung Kim, Mi-Kyeong Choi, Young-Ran Heo, Taisun Hyun, Sun Mee Kim, Eun-Soon Lyu, Se-Young Oh, Hae-Ryun Park, Moo-Yong Rhee, Hee-Kyong Ro, Mi Kyung Song, Tatsuo Shimosawa
PLOS ONE.2018; 13(2): e0192588. CrossRef - Correlations Among Threshold and Assessment for Salty Taste and High-salt Dietary Behavior by Age
Lin Jiang, Yun-Young Jung, Yeon-Kyung Lee
Korean Journal of Community Nutrition.2016; 21(1): 75. CrossRef - Salt Preference and Sodium Intake among Pregnant Women
Mi Jeung Im, Dong Sook Cho
Korean Journal of Women Health Nursing.2016; 22(4): 297. CrossRef - Nutrition Knowledge, Dietary Attitude, and Dietary Behavior Related to Salt According to the Dietary Lifestyle Groups
Hei-Ryeo Yoon, Nam-E Kang, Juhyeon Kim
Korean Journal of Food & Cookery Science.2016; 32(3): 333. CrossRef - Healthy eating exploratory program for the elderly: Low salt intake in congregate meal service
Sunhee Seo, O.Y. Kim, J. Ahn
The Journal of nutrition, health and aging.2016; 20(3): 316. CrossRef - Comparison of salty taste assessment, high-salt dietary attitude and high-salt dietary behavior by stage of behavior change among students in Daegu
Hye-Hyun Hwang, Eun-Kyung Shin, Hye-Jin Lee, Tae-Yoon Hwang, Young Ae Kim, Yeon-Kyung Lee
Journal of Nutrition and Health.2016; 49(1): 36. CrossRef - Salt-Related Dietary Attitudes, Behaviors, and Nutrition Knowledge of University Students according to Estimated Salt Intake Using Urinary Salt Signal
Mi-Hyun Kim, Daun Min, Eungyoung Jang, Jee-Young Yeon, Jong Wook Kim, Yun-Jung Bae
Journal of the Korean Society of Food Science and Nutrition.2015; 44(2): 226. CrossRef - A Study on Sodium-related Dietary Attitude and Behaviors According to Sodium-related Nutrition Knowledge of University Students
Mi-Hyun Kim, Jee-Young Yeon, Jong Wook Kim, Jae-Eon Byun, So-Young Bu, Mi-Kyeong Choi, Yun-Jung Bae
Korean Journal of Community Nutrition.2015; 20(5): 327. CrossRef - Sodium-related Eating Behaviors of Parents and Its Relationship to Eating Behaviors of Their Preschool Children
Ye Seul Kim, Hong Mie Lee, Jung Hee Kim
Korean Journal of Community Nutrition.2015; 20(1): 11. CrossRef - Study on Sodium-related Dietary Attitude, Behaviors according to Practice of Dietary Guidelines of University Students
Yun-Jung Bae, Seung-Eun No, Jeong-Hwa Seo, Joo-Hee Son, Mi-Jin Lee, Da-Woon Jung
The Korean Journal of Food And Nutrition.2015; 28(3): 376. CrossRef - A Comparison of Salty Taste Assessment, Dietary Attitude and Dietary Behavior among Adult and Senior Women by Region and by Age in Korea
Lin Jiang, Yun-Young Jung, Hyung-Sook Kim, Gi-Seon Nam, Jin-Sook Yun, Jong-Wook Kim, Yeon-Kyung Lee
Korean Journal of Community Nutrition.2015; 20(2): 109. CrossRef - The Relationship between Dietary Behaviors/health Risk Factors and Preference for Salty Taste among Korean Elderly People Living in Rural Areas
Mee Sook Lee
Korean Journal of Community Nutrition.2014; 19(5): 448. CrossRef - Salt-related Dietary Behaviors of University Students in Gyeongbuk Area
Kyung-A Lee
Journal of the Korean Society of Food Science and Nutrition.2014; 43(7): 1122. CrossRef - A Study on the Knowledge, Dietary Behavior related to Sodium, Attitudes towards a Low-Salt Diet of Adults in the Jeonbuk Area
Jeongok Rho, Hyuna Kim
Korean Journal of Human Ecology.2013; 22(4): 693. CrossRef - Analysis of presumed sodium intake of office workers using 24-hour urine analysis and correlation matrix between variables
Hyun-Hee Kim, Yeon-Kyung Lee
Korean Journal of Nutrition.2013; 46(1): 26. CrossRef - Comparison of Salty Taste Assessment and High-Salt Dietary Behaviors among University Students and Chinese Students in Daegu, South Korea and University Students in Shenyang, China
Lin Jiang, Yeon-Kyung Lee
Korean Journal of Community Nutrition.2013; 18(6): 555. CrossRef - The Development of a Taste Kit for Education and Research into Sensory Characteristics
Mi-Hye Kim, Hae-Kyung Chung
Journal of the Korean Society of Food Culture.2013; 28(6): 585. CrossRef - Association between Preferences of Salty Food and Acuity and Preferences of Taste of the Elderly People Living in Rural Area
Mee Sook Lee
Korean Journal of Community Nutrition.2013; 18(3): 223. CrossRef - The Association between Smoking, Alcohol Intake, and Low-Salt Diet: Results from the 2008 Community Health Survey
In-Ae Chun, Jong Park, Mi-Ah Han, Seong-Woo Choi, So-Yeon Ryu
Journal of the Korean Dietetic Association.2013; 19(3): 223. CrossRef - Measurements of Salinity and Salt Content by Menu Types Served at Industry Foodservice Operations in Daegu
Ji-Ae Kim, Yun-Hwa Kim, Moon-Young Ann, Yeon-Kyung Lee
Korean Journal of Community Nutrition.2012; 17(5): 637. CrossRef
 Cite
CiteA Comparison of Salty Taste Assessments and Dietary Attitudes and Dietary Behaviors Associated with High-Salt Diets in Four Regions in Korea

Fig. 1
Contribution of food groups to the sodium intakes among regions.
Fig. 1
A Comparison of Salty Taste Assessments and Dietary Attitudes and Dietary Behaviors Associated with High-Salt Diets in Four Regions in Korea
Anthropometric measurements of the subjects
1) Mean ± SD
2) Values with the different superscript are significantly different among different areas by Duncan's multiple range test
3) *: p < 0.05, ***: p < 0.001
4) BMI: Body Mass Index = Weight (kg) / Height (m)2
5) SBP: Systolic Blood Pressure, 6) DBP: Diastolic Blood Pressure
General characteristics of the subjects
1) N (%), 2) ***: p < 0.001
Comparison of salty taste assessment among regions
1) Mean ± SD, 1: unsalty, 2: slightly unsalty, 3: so-so, 4: slightly salty, 5: salty
2) NS: Not significant
3) *: p < 0.05
4) Adjusted for age, gender, job, frequency of eating out and expenditure of eating out
Comparison of nutrition knowledge by salty taste assessment among regions
1) Mean ± SD, Total score = 10
2) Values with the different superscript are significantly different among different concentration by Duncan's multiple range test
3) *: p < 0.05, **: p < 0.01, ***: p < 0.001
4) Values with the different superscript are significantly different among different areas by Duncan's multiple range test
5) Adjusted for age, gender, job, frequency of eating out and expenditure of eating out
6) Values with the different superscript are significantly different among different areas by ANCOVA & Bonferroni comparison test
Comparison of eating attitude by salty taste assessment among regions
1) Mean ± SD, Total score = 5
2) Values with the different superscript are significantly different among different concentration by Duncan's multiple range test
3) **: p < 0.01, ***: p < 0.001
4) Values with the different superscript are significantly different among different areas by Duncan's multiple range test
5) Adjusted for age, gender, job, frequency of eating out and expenditure of eating out
6) Values with the different superscript are significantly different among different areas by ANCOVA & Bonferroni comparison test
Comparison of eating behavior by salty taste assessment among regions
1) Mean ± SD, Total score = 5
2) Values with the different superscript are significantly different among different concentration by Duncan's multiple range test
3) *: p < 0.05, **: p < 0.01, ***: p < 0.001
4) Adjusted for age, gender, job, frequency of eating out and expenditure of eating out
Correlation matrix between sodium intake and variables
*: p < 0.05, **: p < 0.01
Correlation coefficients among nutrition knowledge, salty taste assessment, eating attitudes, and eating behavior
**: p < 0.01, ***: p < 0.001
Table 1
Anthropometric measurements of the subjects
1) Mean ± SD 2) Values with the different superscript are significantly different among different areas by Duncan's multiple range test 3) *: p < 0.05, ***: p < 0.001 4) BMI: Body Mass Index = Weight (kg) / Height (m)2 5) SBP: Systolic Blood Pressure, 6) DBP: Diastolic Blood Pressure
Table 2
General characteristics of the subjects
1) N (%), 2) ***: p < 0.001
Table 3
Comparison of salty taste assessment among regions
1) Mean ± SD, 1: unsalty, 2: slightly unsalty, 3: so-so, 4: slightly salty, 5: salty 2) NS: Not significant 3) *: p < 0.05 4) Adjusted for age, gender, job, frequency of eating out and expenditure of eating out
Table 4
Comparison of nutrition knowledge by salty taste assessment among regions
1) Mean ± SD, Total score = 10 2) Values with the different superscript are significantly different among different concentration by Duncan's multiple range test 3) *: p < 0.05, **: p < 0.01, ***: p < 0.001 4) Values with the different superscript are significantly different among different areas by Duncan's multiple range test 5) Adjusted for age, gender, job, frequency of eating out and expenditure of eating out 6) Values with the different superscript are significantly different among different areas by ANCOVA & Bonferroni comparison test
Table 5
Comparison of eating attitude by salty taste assessment among regions
1) Mean ± SD, Total score = 5 2) Values with the different superscript are significantly different among different concentration by Duncan's multiple range test 3) **: p < 0.01, ***: p < 0.001 4) Values with the different superscript are significantly different among different areas by Duncan's multiple range test 5) Adjusted for age, gender, job, frequency of eating out and expenditure of eating out 6) Values with the different superscript are significantly different among different areas by ANCOVA & Bonferroni comparison test
Table 6
Comparison of eating behavior by salty taste assessment among regions
1) Mean ± SD, Total score = 5 2) Values with the different superscript are significantly different among different concentration by Duncan's multiple range test 3) *: p < 0.05, **: p < 0.01, ***: p < 0.001 4) Adjusted for age, gender, job, frequency of eating out and expenditure of eating out
Table 7
Correlation matrix between sodium intake and variables
*: p < 0.05, **: p < 0.01
Table 8
Correlation coefficients among nutrition knowledge, salty taste assessment, eating attitudes, and eating behavior
**: p < 0.01, ***: p < 0.001


