
Articles
- Page Path
- HOME > Korean J Community Nutr > Volume 31(1); 2026 > Article
-
Research Article
- Understanding the drivers of continuance intention in online grocery shopping using technology continuance theory: a cross-national comparison
-
Binglin Liu1),2)
 , Min A Lee3),†
 -
Korean Journal of Community Nutrition 2026;31(1):50-63.
DOI: https://doi.org/10.5720/kjcn.2026.00017
Published online: February 28, 2026
1)Lecturer, College of Cooking Science and Technology, Jiangsu College of Tourism, Yangzhou, China
2)Ph.D. Student, Department of Foods and Nutrition, Kookmin University, Seoul, Korea
3)Professor, Department of Foods and Nutrition, Kookmin University, Seoul, Korea
- †Corresponding author: Min A Lee Department of Foods and Nutrition, Kookmin University, 77 Jeongneung-ro, Seongbuk-gu, Seoul 02707, Korea Tel: +82-2-910-5745 Fax: +82-2-910-5249 Email: malee@kookmin.ac.kr
• Received: January 13, 2026 • Revised: February 12, 2026 • Accepted: February 24, 2026
© 2026 The Korean Society of Community Nutrition
This is an Open-Access article distributed under the terms of the Creative Commons Attribution Non-Commercial License (https://creativecommons.org/licenses/by-nc/4.0) which permits unrestricted non-commercial use, distribution, and reproduction in any medium, provided the original work is properly cited.
- 961 Views
- 32 Download
Abstract
-
Objectives
- This study examined the determinants of consumers’ continuance intention (CI) toward online grocery shopping (OGS) across different country markets. Drawing on technology continuance theory (TCT), this study compared key drivers of CI in a different countries market.
-
Methods
- Data were collected via online surveys from 638 OGS users in China (n = 338) and South Korea (n = 300) between November and December 2023. A TCT-based model incorporating satisfaction, attitude, perceived usefulness (PU), perceived ease of use, confirmation, and CI was tested using partial least squares structural equation modeling. Partial measurement invariance testing was conducted to ensure valid cross-national comparison.
-
Results
- In South Korea, both satisfaction and attitude significantly predicted CI, with satisfaction exerting a particularly strong effect. In China, attitude was the primary determinant of CI, whereas satisfaction had minimal impact. Across both countries, PU consistently and positively influenced satisfaction and attitude, thereby indirectly enhancing CI. Partial measurement invariance was confirmed, validating comparisons of the model across contexts.
-
Conclusion
- The findings suggest that the drivers of online grocery continuance differ by cross-national market. In Korean markets, strategies must enhance customer satisfaction (and its influence on attitude) to sustain OGS usage. In Chinese markets, fostering favorable consumer attitudes toward OGS is essential for promoting continued use. This cross-national analysis advances the theoretical understanding of continuance behavior while providing practical guidance for designing market-specific strategies to sustain online grocery engagement.
INTRODUCTION
METHODS
RESULTS
DISCUSSION
-
CONFLICT OF INTEREST
There are no financial or other issues that might lead to a conflict of interest.
-
FUNDING
None.
-
DATA AVAILABILITY
Due to privacy and ethical considerations, the dataset is not publicly available, as participants did not provide consent for unrestricted data sharing. However, anonymized data supporting the findings of this study are available from the corresponding author upon reasonable request for research purposes.
NOTES

Fig. 2.Path coefficients by country. CN, Chinese sample; KR, South Korean sample. **P < 0.01, ***P < 0.001.
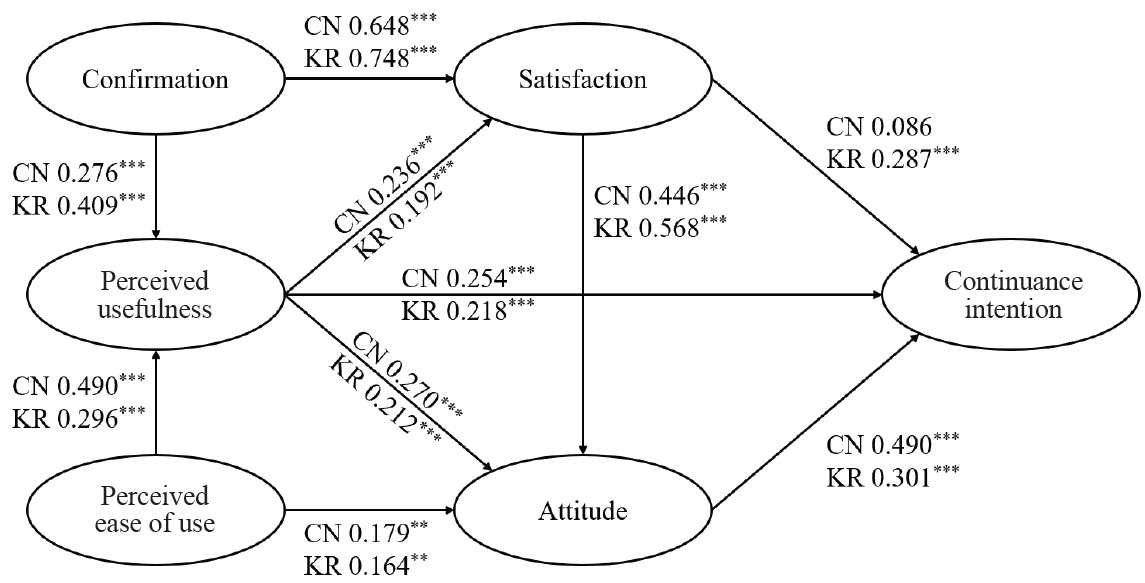
Table 1.Sample characteristics
| Variables | Chinese sample (n = 338) | South Korean sample (n = 300) | χ2 |
|---|---|---|---|
| Gender | |||
| Men | 161 (47.6) | 150 (50.0) | 0.268 |
| Women | 177 (52.4) | 150 (50.0) | |
| Age (year) | |||
| 20–29 | 71 (21.0) | 60 (20.0) | 7.919 |
| 30–39 | 71 (21.0) | 60 (20.0) | |
| 40–49 | 86 (25.4) | 60 (20.0) | |
| 50–59 | 68 (20.1) | 60 (20.0) | |
| ≥ 60 | 42 (12.4) | 60 (20.0) | |
| Education level | |||
| Junior high school | 17 (5.0) | 1 (0.3) | 13.311*** |
| High school | 63 (18.6) | 52 (17.3) | |
| Bachelor’s | 212 (62.7) | 202 (67.3) | |
| Master’s or above | 46 (13.6) | 45 (15.0) | |
| Occupation | |||
| Student | 13 (3.8) | 18 (6.0) | 44.671*** |
| Homemaker | 10 (3.0) | 44 (14.7) | |
| Office worker | 166 (49.1) | 134 (44.7) | |
| Public official | 18 (5.3) | 9 (3.0) | |
| Self-employed | 23 (6.8) | 27 (9.0) | |
| Specialized worker | 23 (6.8) | 26 (8.7) | |
| Service industry | 30 (8.9) | 22 (7.3) | |
| Production worker | 7 (2.1) | 2 (0.7) | |
| Other | 48 (14.2) | 18 (6.0) |
Table 2.Reliability and convergent validity of measurement model
Table 3.Fornell–Larcker criterion results
Table 4.Heterotrait–Monotrait ratio results
Table 5.HTMT inference based on bootstrapped confidence intervals
| Ratio | Lower limit | Upper limit | H1 | |
|---|---|---|---|---|
| Chinese sample | ||||
| SAT ↔ CON | 0.940 | 0.887 | 0.991 | Accepted |
| South Korean sample | ||||
| SAT ↔ ATT | 0.907 | 0.856 | 0.959 | Accepted |
| SAT ↔ CON | 0.966 | 0.931 | 0.998 | Accepted |
Table 6.Hypothesis testing of structural model
| Hypothesis | Chinese sample | South Korean sample | ||||||
|---|---|---|---|---|---|---|---|---|
| β | t-value | f2 | Remark | β | t-value | f2 | Remark | |
| H1 ATT → CI | 0.490 | 7.773*** | 0.220 | S | 0.301 | 3.727*** | 0.065 | S |
| H2 SAT → CI | 0.086 | 1.464 | 0.008 | NS | 0.287 | 3.524*** | 0.063 | S |
| H3 SAT → ATT | 0.446 | 9.233*** | 0.278 | S | 0.568 | 12.781*** | 0.565 | S |
| H4 PU → CI | 0.254 | 4.853*** | 0.077 | S | 0.218 | 3.721*** | 0.055 | S |
| H5 PU → ATT | 0.270 | 3.947*** | 0.094 | S | 0.212 | 4.629*** | 0.079 | S |
| H6 PU → SAT | 0.236 | 5.462*** | 0.105 | S | 0.192 | 4.967*** | 0.104 | S |
| H7 PEOU → ATT | 0.179 | 2.763** | 0.040 | S | 0.164 | 3.370** | 0.056 | S |
| H8 PEOU → PU | 0.490 | 8.799*** | 0.277 | S | 0.296 | 4.228*** | 0.104 | S |
| H9 CON → SAT | 0.648 | 17.174*** | 0.797 | S | 0.748 | 23.207*** | 1.578 | S |
| H10 CON → PU | 0.276 | 4.474*** | 0.088 | S | 0.409 | 6.258*** | 0.197 | S |
Table 7.Predictive ability of structural model
| Construct | Chinese sample | South Korean sample | ||
|---|---|---|---|---|
| R2 | Q2 | R2 | Q2 | |
| ATT | 0.619 | 0.524 | 0.673 | 0.550 |
| CI | 0.566 | 0.400 | 0.517 | 0.402 |
| PU | 0.488 | 0.479 | 0.380 | 0.367 |
| SAT | 0.656 | 0.637 | 0.758 | 0.737 |
Table 8.Path differences of structural model
- 1. Yu J. Dramatic changes in global consumer shopping habits in the context of the 2020 COVID-19 [Internet]. KANTAR; 2021 [cited 2025 Sep 18]. Available from: https://www.kantar.com/zh-cn/inspiration/fmcg/kantar-reveals-worlds-2020-pandemic-shopping-habits
- 2. Kumar N. 41 New online shopping statistics 2026 (global insights) [Internet]. Demandsage; 2026 [cited 2026 Jan 2]. Available from: https://www.demandsage.com/online-shopping-statistics/
- 3. Arora D, Kumar J, Nandi R. China online grocery market size, share and forecast trends - growth analysis and outlook report (2026-2035) [Internet]. Claight; 2025 [cited 2025 Dec 11]. Available from: https://www.expertmarketresearch.com/reports/china-online-grocery-market
- 4. Ma Y. Penetration rate of fresh food e-commerce in China from 2014 to 2024 [Internet]. Statista; 2025 [cited 2025 Dec 20]. Available from: https://www.statista.com/statistics/1194968/china-online-penetration-rate-of-fresh-ecommerce
- 5. Seok H. Still low online penetration despite rapid growth: online food market growth remains high [Internet]. Korea Logistics News; 2022 [cited 2025 Sep 18]. Available from: https://www.klnews.co.kr/news/articleView.html?idxno=304588
- 6. Yuan C, Moon H, Wang S, Yu X, Kim KH. Study on the influencing of B2B parasocial relationship on repeat purchase intention in the online purchasing environment: an empirical study of B2B E-commerce platform. Ind Market Manag 2021; 92: 101-110. Article
- 7. Citrin AV, Stem D, Spangenberg ER, Clark MJ. Consumer need for tactile input: an internet retailing challenge. J Bus Res 2023; 56(11): 915-922. Link
- 8. Kang C, Moon J, Kim T, Choe Y. Why consumers go to online grocery: comparing vegetables with grains. Proceedings of the 49th Annual Hawaii International Conference on System Sciences, HICSS 2016; 2016 Jan 5-8; Koloa, Hawaii. p. 3604-3613. Article
- 9. Drisdelle C, Kestens Y, Hamelin AM, Mercille G. Disparities in access to healthy diets: how food security and food shopping behaviors relate to fruit and vegetable intake. J Acad Nutr Diet 2020; 120(11): 1847-1858. ArticlePubMed
- 10. Avelino DC, Duffy VB, Puglisi M, Ray S, Lituma-Solis B, Nosal BM, et al. Can ordering groceries online support diet quality in adults who live in low food access and low-income environments? Nutrients 2023; 15(4): 862.ArticlePubMedPMC
- 11. Fernandez MA, Raine KD. Digital food retail: public health opportunities. Nutrients 2021; 13(11): 3789.ArticlePubMedPMC
- 12. Bennett R, Keeble M, Zorbas C, Sacks G, Driessen C, Grigsby-Duffy L, et al. The potential influence of the digital food retail environment on health: a systematic scoping review of the literature. Obes Rev 2024; 25(3): e13671.ArticlePubMed
- 13. Hoehle H, Zhang X, Venkatesh V. An espoused cultural perspective to understand continued intention to use mobile applications: a four-country study of mobile social media application usability. Eur J Inf Syst 2015; 24(3): 337-359. ArticlePDF
- 14. Kumar A, Kashyap AK. Understanding the factors influencing repurchase intention in online shopping: a meta-analytic review. Vision J Bus Perspect. 2022 https://doi.org/10.1177/09722629221107957. Article
- 15. Lee H, Xu Y, Li A. Technology visibility and consumer adoption of virtual fitting rooms (VFRs): a cross-cultural comparison of Chinese and Korean consumers. J Fash Mark Manag 2020; 24(2): 175-194. Article
- 16. Wang O, Somogyi S. Consumer adoption of online food shopping in China. Br Food J 2018; 120(12): 2868-2884. Article
- 17. Cui L, He S, Deng H, Wang X. Sustaining customer loyalty of fresh food e-tailers: an empirical study in China. Asia Pac J Mark Logist 2023; 35(3): 669-686. Article
- 18. Kim H, Kim M. Analysis of online food purchase behavior and factors determining online purchases by adult consumers. J Korean Soc Food Sci Nutr 2019; 48(1): 97-108. Article
- 19. Lee SH, Kwak MK, Cha SS. Consumers’ choice for fresh food at online shopping in the time of Covid19. J Distrib Sci 2020; 18(9): 45-53. Article
- 20. Cha SS, Lee SH. The effects of user experience factors on satisfaction and repurchase intention at online food market. J Ind Distrib Bus 2021; 12(4): 7-13. Article
- 21. Kang JW, Namkung Y. Measuring the service quality of fresh food delivery platforms: development and validation of the “Food PlatQual” scale. Sustainability 2022; 14(10): 5940.Article
- 22. Choi S. A study on the types of online food non-purchasing consumers. Culi Sci Hos Res 2023; 29(1): 110-120. Article
- 23. Park SC, Kim JU. Impacts of e-grocery consumers’ shadow work on mobile shopping avoidance and switching behavior. Inf Syst Rev 2021; 23(4): 165-182. Article
- 24. Prabowo H, Hindarwati EN, Yuniarty . Online grocery shopping adoption: a systematic literature review. Proceedings of 2020 International Conference on Information Management and Technology (ICIMTech); 2020 Aug 13-14; Bandung, Indonesia. p. 40-45. Article
- 25. Yan M, Filieri R, Gorton M. Continuance intention of online technologies: a systematic literature review. Int J Inf Manag 2021; 58: 102315.Article
- 26. Liao C, Palvia P, Chen JL. Information technology adoption behavior life cycle: toward a technology continuance theory (TCT). Int J Inf Manag 2009; 29(4): 309-320. Article
- 27. Oliver RL. Measurement and evaluation of satisfaction processes in retail settings. J Retail 1981; 57(3): 25-48. Link
- 28. Rahi S, Abd Ghani M. Examining internet banking user’s continuance intention through the lens of technology continuance theory and task technology fit model. Digit Policy Regul Gov 2021; 23(5): 456-474. Article
- 29. Foroughi B, Sitthisirinan S, Iranmanesh M, Nikbin D, Ghobakhloo M. Determinants of travel apps continuance usage intention: extension of technology continuance theory. Curr Issue Tour 2024; 27(4): 619-635. Article
- 30. Jain NK, Kaul D, Sanyal P. What drives customers towards mobile shopping? An integrative technology continuance theory perspective. Asia Pac J Mark Logist 2022; 34(5): 922-943. Article
- 31. Song HG, Jo H. Understanding the continuance intention of omnichannel: combining TAM and TPB. Sustainability 2023; 15(4): 3039.Article
- 32. Bhattacherjee A. Understanding information systems continuance: an expectation-confirmation model. MIS Quarterly 2001; 25(3): 351-370. Article
- 33. Dai HM, Teo T, Rappa NA, Huang F. Explaining Chinese university students’ continuance learning intention in the MOOC setting: a modified expectation confirmation model perspective. Comput Educ 2020; 150: 103850.Article
- 34. Khayer A, Bao Y. The continuance usage intention of Alipay: integrating context-awareness and technology continuance theory (TCT). Bottom Line 2019; 32(3): 211-229. Article
- 35. Hossain MA, Quaddus M. Expectation-confirmation theory in information system research: a review and analysis. In: Dwivedi Y, Wade M, Schneberger S, editors. Information systems theory. Springer; 2012. p. 441-469. Article
- 36. Nguyen GD, Ha MT. The role of user adaptation and trust in understanding continuance intention towards mobile shopping: an extended expectation-confirmation model. Cogent Bus Manag 2021; 8(1): 1980248.Article
- 37. Tsai H, Lee YP, Ruangkanjanases A. Understanding the effects of antecedents on continuance intention to gather food safety information on websites. Front Psychol 2020; 11: 579322.ArticlePubMedPMC
- 38. Foroughi B, Iranmanesh M, Hyun SS. Understanding the determinants of mobile banking continuance usage intention. J Enterp Inf Manag 2019; 32(6): 1015-1033. Article
- 39. Venkatesh V, Davis FD. A model of the antecedents of perceived ease of use: development and test. Decis Sci 1996; 27: 451-481. Article
- 40. Taylor S, Todd P. Assessing IT usage: the role of prior experience. MIS Quarterly 1995; 19(4): 561-570. ArticlePDF
- 41. Brislin RW. Back-translation for cross-cultural research. J Cross Cult Psychol 1970; 1(3): 185-216. ArticlePMCLink
- 42. Guenther P, Guenther M, Ringle CM, Zaefarian G, Cartwright S. Improving PLS-SEM use for business marketing research. Ind Mark Manag 2023; 111: 127-142. Article
- 43. Cheah JH, Amaro S, Roldán JL. Multigroup analysis of more than two groups in PLS-SEM: a review, illustration, and recommendations. J Bus Res 2023; 156: 113539.Article
- 44. Podsakoff PM, MacKenzie SB, Lee JY, Podsakoff NP. Common method biases in behavioral research: a critical review of the literature and recommended remedies. J Appl Psychol 2003; 88(5): 879-903. ArticlePubMedPMC
- 45. Hair JF, Risher JJ, Sarstedt M, Ringle CM. When to use and how to report the results of PLS-SEM. Eur Bus Rev 2019; 31(1): 2-24. ArticlePMC
- 46. Henseler J, Ringle CM, Sarstedt M. Testing measurement invariance of composites using partial least squares. Int Mark Rev 2016; 33(3): 405-431. Article
- 47. Kock N. Common method bias in PLS-SEM: a full collinearity assessment approach. Int J e-Collaboration 2015; 11(4): 1-10. Article
- 48. Rippé CB, Smith B, Weisfeld-Spolter S. The connection of attachment and self-gifting for the disconnection of loneliness across cultures. Int J Consum Stud 2022; 46: 1451-1467. ArticleLink
- 49. Cheng P, OuYang Z, Liu Y. Understanding bike sharing use over time by employing extended technology continuance theory. Transp Res Part A Policy Pract 2019; 124: 433-443. Article
- 50. Foroughi B, Iranmanesh M, Kuppusamy M, Ganesan Y, Ghobakhloo M, Senali MG. Determinants of continuance intention to use gamification applications for task management: an extension of technology continuance theory. Electron Libr 2023; 41(2/3): 286-307. Article
- 51. Fishbein M, Ajzen I. Belief, attitude, intention, and behavior: an introduction to theory and research. Philos Rhetor 1977; 10(2): 130-132. Link
- 52. Thong JYL, Hong SJ, Tam KY. The effects of post-adoption beliefs on the expectation-confirmation model for information technology continuance. Int J Hum Comput Stud 2006; 64(9): 799-810. Article
- 53. Mirhoseini M, Pagé SA, Léger PM, Sénécal S. What deters online grocery shopping? Investigating the effect of arithmetic complexity and product type on user satisfaction. J Theor Appl Electron Commer Res 2021; 16(4): 828-845. Article
- 54. Abdul-Muhmin AG. Repeat purchase intentions in online shopping: the role of satisfaction, attitude, and online retailers’ performance. J Int Consum Mark 2010; 23(1): 5-20. Article
- 55. Chiu W, Oh G, Cho H. An integrated model of consumers’ decision-making process in social commerce: a cross-cultural study of the United States and China. Asia Pac J Mark Logist 2023; 35(7): 1682-1698. Article
- 56. Bridges E, Florsheim R. Hedonic and utilitarian shopping goals: the online experience. J Bus Res 2008; 61(4): 309-314. Article
- 57. Huang Y, Oppewal H. Why consumers hesitate to shop online: an experimental choice analysis of grocery shopping and the role of delivery fees. Int J Retail Distrib Manag 2006; 34(4-5): 334-353. Article
- 58. Hellier PK, Geursen GM, Carr RA, Rickard JA. Customer repurchase intention: a general structural equation model. Eur J Mark 2003; 37(11-12): 1762-1800. Article
- 59. Abdul-Halim NA, Vafaei-Zadeh A, Hanifah H, Teoh AP, Nawaser K. Understanding the determinants of e-wallet continuance usage intention in Malaysia. Qual Quant 2022; 56(5): 3413-3439. ArticlePubMedPMCPDF
- 60. Sreeram A, Kesharwani A, Desai S. Factors affecting satisfaction and loyalty in online grocery shopping: an integrated model. J Indian Bus Res 2017; 9(2): 107-132. Article
REFERENCES
Appendix
Appendix
Figure & Data
REFERENCES
Citations
Citations to this article as recorded by 
 Cite
CiteUnderstanding the drivers of continuance intention in online grocery shopping using technology continuance theory: a cross-national comparison
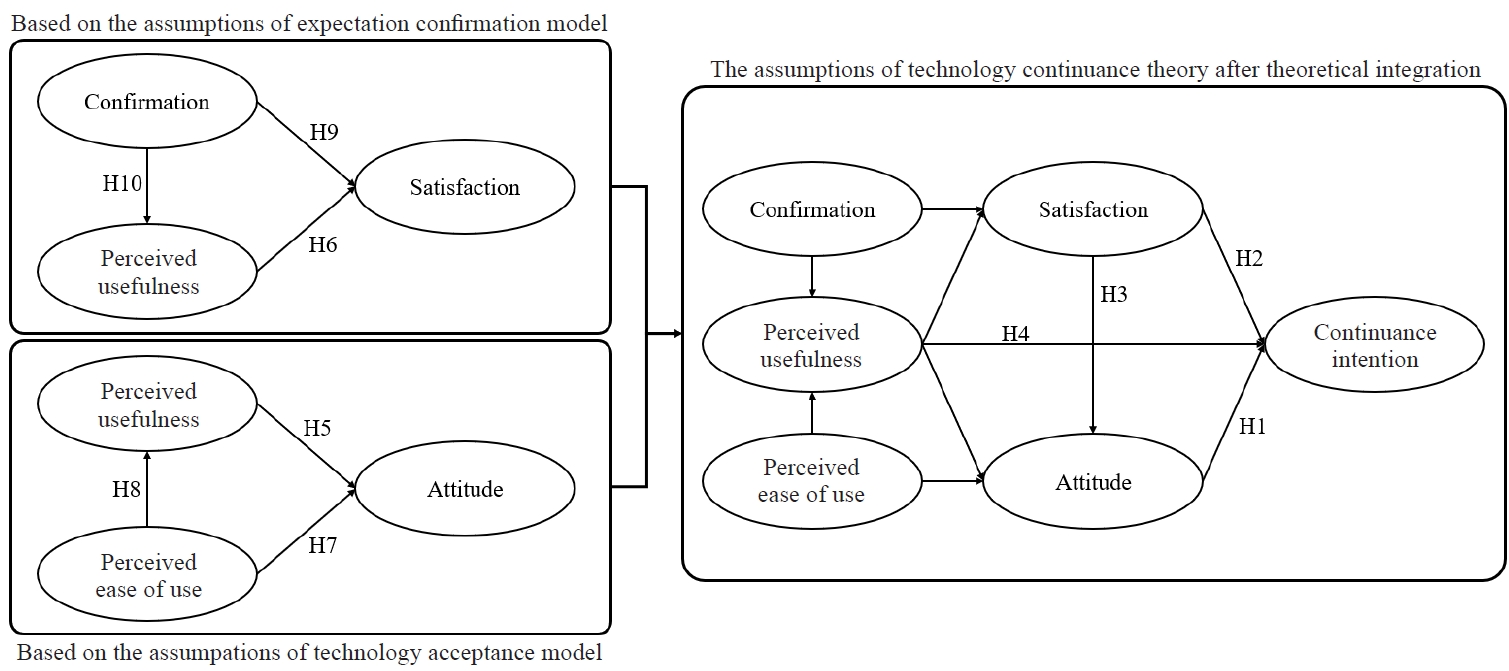

Fig. 1. Research model based on technology continuance theory.
Fig. 2. Path coefficients by country. CN, Chinese sample; KR, South Korean sample. **P < 0.01, ***P < 0.001.
Fig. 1.
Fig. 2.
Understanding the drivers of continuance intention in online grocery shopping using technology continuance theory: a cross-national comparison
| Variables | Chinese sample (n = 338) | South Korean sample (n = 300) | χ2 |
|---|---|---|---|
| Gender | |||
| Men | 161 (47.6) | 150 (50.0) | 0.268 |
| Women | 177 (52.4) | 150 (50.0) | |
| Age (year) | |||
| 20–29 | 71 (21.0) | 60 (20.0) | 7.919 |
| 30–39 | 71 (21.0) | 60 (20.0) | |
| 40–49 | 86 (25.4) | 60 (20.0) | |
| 50–59 | 68 (20.1) | 60 (20.0) | |
| ≥ 60 | 42 (12.4) | 60 (20.0) | |
| Education level | |||
| Junior high school | 17 (5.0) | 1 (0.3) | 13.311 |
| High school | 63 (18.6) | 52 (17.3) | |
| Bachelor’s | 212 (62.7) | 202 (67.3) | |
| Master’s or above | 46 (13.6) | 45 (15.0) | |
| Occupation | |||
| Student | 13 (3.8) | 18 (6.0) | 44.671 |
| Homemaker | 10 (3.0) | 44 (14.7) | |
| Office worker | 166 (49.1) | 134 (44.7) | |
| Public official | 18 (5.3) | 9 (3.0) | |
| Self-employed | 23 (6.8) | 27 (9.0) | |
| Specialized worker | 23 (6.8) | 26 (8.7) | |
| Service industry | 30 (8.9) | 22 (7.3) | |
| Production worker | 7 (2.1) | 2 (0.7) | |
| Other | 48 (14.2) | 18 (6.0) |
| Item | Chinese sample | South Korean sample | ||||||
|---|---|---|---|---|---|---|---|---|
| Outer loading | Cronbach’s α | CR | AVE | Outer loading | Cronbach’s α | CR | AVE | |
| ATT | ||||||||
| ATT1 | 0.823 | 0.848 | 0.898 | 0.687 | 0.843 | 0.822 | 0.882 | 0.653 |
| ATT2 | 0.868 | 0.842 | ||||||
| ATT3 | 0.815 | 0.750 | ||||||
| ATT4 | 0.809 | 0.792 | ||||||
| CI | ||||||||
| CI1 | 0.847 | 0.749 | 0.879 | 0.709 | 0.869 | 0.833 | 0.900 | 0.750 |
| CI2 | 0.836 | 0.823 | ||||||
| CI3 | 0.842 | 0.904 | ||||||
| CON | ||||||||
| CON1 | 0.830 | 0.801 | 0.883 | 0.715 | 0.912 | 0.875 | 0.923 | 0.800 |
| CON2 | 0.855 | 0.883 | ||||||
| CON3 | 0.852 | 0.888 | ||||||
| PEOU | ||||||||
| PEOU1 | 0.758 | 0.757 | 0.846 | 0.578 | 0.740 | 0.739 | 0.836 | 0.562 |
| PEOU2 | 0.749 | 0.659 | ||||||
| PEOU3 | 0.755 | 0.805 | ||||||
| PEOU4 | 0.778 | 0.787 | ||||||
| PU | ||||||||
| PU1 | 0.755 | 0.790 | 0.864 | 0.615 | 0.728 | 0.774 | 0.856 | 0.602 |
| PU2 | 0.712 | 0.610 | ||||||
| PU3 | 0.840 | 0.870 | ||||||
| PU4 | 0.824 | 0.864 | ||||||
| SAT | ||||||||
| SAT1 | 0.826 | 0.875 | 0.914 | 0.727 | 0.881 | 0.893 | 0.925 | 0.756 |
| SAT2 | 0.849 | 0.864 | ||||||
| SAT3 | 0.881 | 0.878 | ||||||
| SAT4 | 0.854 | 0.856 | ||||||
| Construct | ATT | CI | CON | PEOU | PU | SAT |
|---|---|---|---|---|---|---|
| Chinese sample | ||||||
| ATT | 0.829 | |||||
| CI | 0.722 | 0.842 | ||||
| CON | 0.678 | 0.601 | 0.845 | |||
| PEOU | 0.640 | 0.557 | 0.639 | 0.760 | ||
| PU | 0.665 | 0.633 | 0.589 | 0.666 | 0.784 | |
| South Korean sample | ||||||
| ATT | 0.808 | |||||
| CI | 0.666 | 0.866 | ||||
| CON | 0.711 | 0.623 | 0.895 | |||
| PEOU | 0.562 | 0.452 | 0.517 | 0.750 | ||
| PU | 0.644 | 0.588 | 0.562 | 0.508 | 0.776 | |
| SAT | 0.782 | 0.656 | 0.856 | 0.511 | 0.612 | 0.870 |
| Construct | ATT | CI | CON | PEOU | PU | SAT |
|---|---|---|---|---|---|---|
| Chinese sample | ||||||
| ATT | ||||||
| CI | 0.879 | |||||
| CON | 0.819 | 0.751 | ||||
| PEOU | 0.795 | 0.715 | 0.821 | |||
| PU | 0.810 | 0.798 | 0.735 | 0.852 | ||
| SAT | 0.840 | 0.719 | 0.940 | 0.772 | 0.741 | |
| South Korean sample | ||||||
| ATT | ||||||
| CI | 0.795 | |||||
| CON | 0.832 | 0.721 | ||||
| PEOU | 0.716 | 0.568 | 0.644 | |||
| PU | 0.788 | 0.714 | 0.671 | 0.674 | ||
| SAT | 0.907 | 0.754 | 0.966 | 0.630 | 0.725 |
| Ratio | Lower limit | Upper limit | H1 | |
|---|---|---|---|---|
| Chinese sample | ||||
| SAT ↔ CON | 0.940 | 0.887 | 0.991 | Accepted |
| South Korean sample | ||||
| SAT ↔ ATT | 0.907 | 0.856 | 0.959 | Accepted |
| SAT ↔ CON | 0.966 | 0.931 | 0.998 | Accepted |
| Hypothesis | Chinese sample | South Korean sample | ||||||
|---|---|---|---|---|---|---|---|---|
| β | t-value | f2 | Remark | β | t-value | f2 | Remark | |
| H1 ATT → CI | 0.490 | 7.773 |
0.220 | S | 0.301 | 3.727 |
0.065 | S |
| H2 SAT → CI | 0.086 | 1.464 | 0.008 | NS | 0.287 | 3.524 |
0.063 | S |
| H3 SAT → ATT | 0.446 | 9.233 |
0.278 | S | 0.568 | 12.781 |
0.565 | S |
| H4 PU → CI | 0.254 | 4.853 |
0.077 | S | 0.218 | 3.721 |
0.055 | S |
| H5 PU → ATT | 0.270 | 3.947 |
0.094 | S | 0.212 | 4.629 |
0.079 | S |
| H6 PU → SAT | 0.236 | 5.462 |
0.105 | S | 0.192 | 4.967 |
0.104 | S |
| H7 PEOU → ATT | 0.179 | 2.763 |
0.040 | S | 0.164 | 3.370 |
0.056 | S |
| H8 PEOU → PU | 0.490 | 8.799 |
0.277 | S | 0.296 | 4.228 |
0.104 | S |
| H9 CON → SAT | 0.648 | 17.174 |
0.797 | S | 0.748 | 23.207 |
1.578 | S |
| H10 CON → PU | 0.276 | 4.474 |
0.088 | S | 0.409 | 6.258 |
0.197 | S |
| Construct | Chinese sample | South Korean sample | ||
|---|---|---|---|---|
| R2 | Q2 | R2 | Q2 | |
| ATT | 0.619 | 0.524 | 0.673 | 0.550 |
| CI | 0.566 | 0.400 | 0.517 | 0.402 |
| PU | 0.488 | 0.479 | 0.380 | 0.367 |
| SAT | 0.656 | 0.637 | 0.758 | 0.737 |
| Hypothesis | Path coefficients-diff (CN−KR) | P-value of difference |
|---|---|---|
| H1 ATT → CI | 0.189 | 0.063 |
| H2 SAT → CI | −0.201 | 0.046 |
| H3 SAT → ATT | −0.122 | 0.062 |
| H4 PU → CI | 0.036 | 0.643 |
| H5 PU → ATT | 0.058 | 0.481 |
| H6 PU → SAT | 0.044 | 0.449 |
| H7 PEOU → ATT | 0.016 | 0.842 |
| H8 PEOU → PU | 0.193 | 0.024 |
| H9 CON → SAT | −0.100 | 0.047 |
| H10 CON → PU | −0.133 | 0.140 |
| Construct and indicators |
|---|
| Attitude |
| OGS would be a good idea |
| OGS would be a wise idea |
| I like the idea of using OGS |
| Satisfaction |
| My overall experience with OGS was: very satisfied |
| My overall experience with OGS was: very pleased |
| My overall experience with OGS was: very contented |
| My overall experience with OGS was: absolutely delighted |
| Continuance intention |
| I intend to continue using OGS rather than discontinue its use |
| My intentions are to continue using OGS than use any alternative means |
| If I could, I would like to continue using OGS as much as possible |
| Usefulness |
| Using the OGS improves my performance in my shopping |
| Using the OGS improves my productivity in my shopping |
| Using the OGS enhances my effectiveness in my shopping |
| I find the OGS to be useful in my shopping |
| Ease of use |
| My interaction with the OGS is clear and understandable |
| Interaction with the OGS does not require a lot of my mental effort |
| I find it easy to get the OGS to do what I want it to do |
| I find the OGS to be easy to use |
| Confirmation |
| My experience with using OGS was better than what I expected. |
| The service level provide by OGS was better than what I expected. |
| Overall, most of my expectations from using OGS were confirmed |
Table 1. Sample characteristics
n (%).
Table 2. Reliability and convergent validity of measurement model
CR, composite reliability; AVE, average variance extracted; ATT, attitude; CI, continuance intention; CON, confirmation; PEOU, perceived ease of use; PU, perceived usefulness; SAT, satisfaction.
Table 3. Fornell–Larcker criterion results
The diagonal is the square root of AVE. ATT, attitude; CI, continuance intention; CON, confirmation; PEOU, perceived ease of use; PU, perceived usefulness; SAT, satisfaction.
Table 4. Heterotrait–Monotrait ratio results
ATT, attitude; CI, continuance intention; CON, confirmation; PEOU, perceived ease of use; PU, perceived usefulness; SAT, satisfaction.
Table 5. HTMT inference based on bootstrapped confidence intervals
H0, HTMT ≥ 1; H1, HTMT < 1. If H0 holds indicates a lack of discriminant validity. ATT, attitude; CON, confirmation; SAT, satisfaction.
Table 6. Hypothesis testing of structural model
ATT, attitude; CI, continuance intention; CON, confirmation; PEOU, perceived ease of use; PU, perceived usefulness; SAT, satisfaction; S, significant; NS, not significant.
Table 7. Predictive ability of structural model
ATT, attitude; CI, continuance intention; PU, perceived usefulness; SAT, satisfaction.
Table 8. Path differences of structural model
CN, Chinese sample; KR, South Korean sample; ATT, attitude; CI, continuance intention; CON, confirmation; PEOU, perceived ease of use; PU, perceived usefulness; SAT, satisfaction.
OGS, online grocery shopping.


