Warning: mkdir(): Permission denied in /home/virtual/lib/view_data.php on line 81

Warning: fopen(upload/ip_log/ip_log_2024-11.txt): failed to open stream: No such file or directory in /home/virtual/lib/view_data.php on line 83

Warning: fwrite() expects parameter 1 to be resource, boolean given in /home/virtual/lib/view_data.php on line 84
Effect of Active Nutrition Care on Underweight Elderly Patients Receiving Long-term Enteral Tube Feeding
Skip Navigation
Skip to contents

Korean J Community Nutr : Korean Journal of Community Nutrition

OPEN ACCESS

Articles

Page Path
HOME > Korean J Community Nutr > Volume 23(1); 2018 > Article
Research Article
Effect of Active Nutrition Care on Underweight Elderly Patients Receiving Long-term Enteral Tube Feeding
Hwa-Young Yoon, Hye-Kyeong Kimorcid
Korean Journal of Community Nutrition 2018;23(1):48-59.
DOI: https://doi.org/10.5720/kjcn.2018.23.1.48
Published online: February 28, 2018

Department of Food Science & Nutrition, The Catholic University of Korea, Bucheon, Korea.

Corresponding author: Hye-Kyeong Kim. Department of Food Science & Nutrition, The Catholic University of Korea, 43 Jibongro, Wonmi-gu, Bucheon, Gyeonggi-do 14662, Korea. Tel: (02) 2164-4314, Fax: (02) 2164-4314, hkyeong@catholic.ac.kr
• Received: February 7, 2018   • Revised: February 21, 2018   • Accepted: February 21, 2018

Copyright © 2018 The Korean Society of Community Nutrition

This is an Open-Access article distributed under the terms of the Creative Commons Attribution Non-Commercial License (http://creativecommons.org/licenses/by-nc/3.0/) which permits unrestricted non-commercial use, distribution, and reproduction in any medium, provided the original work is properly cited.

  • 135 Views
  • 4 Download
  • 1 Crossref
prev next
  • Objectives
    This study was performed to investigate the effect of active nutrition care on feeding and nutritional status of elderly patients receiving long-term enteral tube feeding.
  • Methods
    Subjects included 77 elderly patients who had received enteral nutrition more than one week before admission. Nutrition care was provided to patients supplied less calories than required. Feeding intolerance was examined and managed every day and formula was adjusted to meet nutritional requirement during the first 3 months after admission. Patients were classified into under or over 80% of percent ideal body weight (PIBW) and medical records were used to compare changes in weight,, biochemical indices, and nutritional status during the study.
  • Results
    Weight, BMI, triglyceride and total cholesterol in blood, hemoglobin, and hematocrit levels were significantly lower in patients under 80% of the PIBW than in those over 80% of the PIBW at admission. The percentage of supply to required calories was also lower in patients under 80% of the PIBW. After 1 month of nutritional care, supplied volume of formula was significantly increased in patients under 80% of the PIBW. Weight, BMI, and PIBW were increased and there were no differences between groups after 6 months. In addition, the concentrations of triglyceride and total cholesterol in blood, hemoglobin, and hematocrit tended to increase in patients under 80% of the PIBW, leading to no difference between groups after 3 months.
  • Conclusions
    Personalized active nutrition care is effective to increase weight and improve feeding and nutritional status in underweight elderly patients receiving longterm enteral nutrition.
  • 1. Statistics Korea. Prospective statistics of Korean population 2015~2065 [internet]. Statistics Korea; 2016; cited 2017 Sep 25]. Available from: http://www.kostat.go.kr/.
  • 2. Ahmed T, Haboubi N. Assessment and management of nutrition in older people and its importance to health. Clin Interv Aging 2010; 5: 207-216.PubMedPMC
  • 3. Chapman IM. Weight loss in older persons. Med Clin North Am 2011; 95(3): 579-593.ArticlePubMed
  • 4. Chung SS. Nutrition support methods in elderly patients. J Clin Nutr 2014; 6(1): 7-10.Article
  • 5. Silver AJ, Morley JE, Strome LS, Jones D, Vickers L. Nutritional status in academic nursing homes. J Am Geriatr Soc 1988; 36(6): 487-491.PubMed
  • 6. Mitchell H, Porter J. The cost-effectiveness of identifying and treating malnutrition in hospitals: a systemic review. J Hum Nutr Diet 2016; 29(2): 156-164.PubMed
  • 7. Hebuterne X, Bozzetti F, Villares JM, Pertkiewicz M, Shaffer J, Staun M, et al. Home enteral nutrition in adults: a European multicentre survey. Clin Nutr 2003; 22(3): 261-266.ArticlePubMed
  • 8. Dorner B, Posthauer ME, Friedrich EK, Robinson GE. Enteral nutrition for older adults in nursing facilities. Nutr Clin Pract 2011; 26(3): 261-272.ArticlePubMedPDF
  • 9. Lee JH, Cho KH, Rhee BA, Lee SH, Choue R. A study on nutritional status, biochemical parameters, lipid and electrolytes concentrations according to the duration of enteral nutrition tubefeeding. Korean J Nutr 2002; 35(5): 512-523.
  • 10. Park CM. Nutritional support in critically ill surgical patients. J Korean Soc Parenter Enter Nutr 2013; 5(1): 15-19.Article
  • 11. McClave SA, Sexton LK, Spain DA, Adams JL, Owens NA, Sullins MB. . Enteral tube feeding in the intensive care unit: factors impeding adequate delivery. Crit Care Med 1999; 27(7): 1252-1256.PubMed
  • 12. Seol E, Suh YS, Ju DL, Bae HJ, Lee HJ. Nutritional screening tool for in-hospital patients. J Clin Nutr 2016; 8(1): 2-10.Article
  • 13. Hedberg AM, Garcia N, Trejus IJ, Weinmann-Winkler S, Gabriel ML, Lutz AL. Nutritional risk screening: development of a standardized protocol using dietetic technicians. J Am Diet Assoc 1988; 88(12): 1553-1556.ArticlePubMed
  • 14. Lee JW, Lee MS, Kim JH, Son SM, Lee BS. Nutritional assessment. 2nd ed. Paju: Kyomunsa; 2006. p. 204-221.
  • 15. Shikora SA, Blackburn GL. Nutritional support: theory and therapeutics. London: Springer; 1997. p. 464-481.
  • 16. Mueller C, Compher C, Ellen DM. A.S.P.E.N. clinical guidelines: nutritional screening, assessment, and intervention in adults. J Parenter Enteral Nutr 2011; 35(1): 16-24.ArticlePDF
  • 17. Martindale RG, McClave SA, Vanek VW, McCarthy M, Roberts P, Taylor B, et al. Guidelines for the provision and assessment of nutrition support therapy in the adult critically ill patient: Society of Critical Care Medicine and American Society for Parenteral and Enteral Nutrition: Executive Summary. Crit Care Med 2009; 37(5): 1757-1761.ArticlePubMed
  • 18. Perissinotto E, Pisent C, Sergi G, Grigoletto F, Enzi G. ILSA Working Group. Anthropometric measurements in the elderly: age and gender differences. Br J Nutr 2002; 87(2): 177-186.ArticlePubMed
  • 19. Park EK, Lee JH, Lim HS. Degree of enteral tube feeding in the intensive care unit and change in nutritional status. J Korean Diet Assoc 2001; 7(3): 217-226.
  • 20. Kim H, Choi SH, Ham YJ. Nutritional status and indicators of intensive care unit patients on enteral feeding. J Korean Acad Fundam Nurs 2009; 16(1): 21-29.
  • 21. Kim H, Shin JA, Shin JY, Cho OM. Adequacy of nutritional support and reasons for underfeeding in neurosurgical intensive care unit patients. Asian Nurs Res 2010; 4(2): 102-110.Article
  • 22. Reid CL. Frequency of under-and overfeeding in mechanically ventilated ICU patients: causes and possible consequences. J Hum Nutr Diet 2006; 19(1): 13-22.ArticlePubMed
  • 23. Adam S, Batson S. A study of problems associated with the delivery of enteral tube feed in critically ill patients in five ICUs in the UK. Intensive Care Med 1997; 23(3): 261-266.ArticlePubMedPDF
  • 24. Spain DA, McClave SA, Sexton LK, Adams JL, Blanford BS, Sullins ME, et al. Infusion protocol improves delivery of enteral tube feeding in the critical care unit. J Parenter Enteral Nutr 1999; 23(5): 288-292.
  • 25. Mackenie SL, Zygun DA, Whitmore BL, Doig CJ, Hameed SM. Implementation of a nutrition support protocol increases the proportion of mechanically ventilated patients reaching enteral nutrition targets in the adult intensive care unit. J Parenter Enteral Nutr 2005; 29(2): 74-80.ArticlePDF
  • 26. Sullivan DH, Walls RC, Bopp MM. Protein-energy undernutrition and the risk of mortality within one year of hospital discharge: a follow-up study. J Am Geriatr Soc 1995; 43(5): 507-512.ArticlePubMed
  • 27. Tayback M, Kumanyika S, Chee E. Body weight as a risk factor in the elderly. Arch Intern Med 1990; 150(5): 1065-1072.PubMed
  • 28. Galanos AN, Pieper CF, Cornoni-Huntley JC, Bales CW, Fillenbaum GG. Nutrition and function: is there a relationship between body mass index and the functional capabilities of community-dwelling elderly? J Am Geriatr Soc 1994; 42(4): 367-373.Article
  • 29. Peck A, Cohen CE, Mulvihill MN. Long-term enteral feeding of aged demented nursing home patients. J Am Geriatr Soc 1990; 38(11): 1195-1198.ArticlePubMed
  • 30. Milne AC, Avenell A, Potter J. Meta-analysis: protein and energy supplementation in older people. Ann Intern Med 2006; 144(1): 37-48.ArticlePubMed
  • 31. Torun B. Protein-energy malnutrition. In: Shils ME, Shike M, Ross AC, Caballero B, Cousins RJ, editors. Modern Nutrition in Health and Disease. 10th ed. LWW; 2005. p. 881-908.
  • 32. World Health Organization. Haemoglobin concentrations for the diagnosis of anaemia and assessment of severity [internet]. 2011; cited 2017 Dec 10]. Available from: http://www.who.int/vmnis/indicators/haemoglobin.pdf.
  • 33. Buzina R, Bates CJ, Beek J, Brubacher G, Chandra RK, Hallberg L, et al. Workshop on functional significance of mild-to-moderate malnutrition. Am J Clin Nutr 1989; 50(1): 172-176.Article
  • 34. Wang J, Hong Z. Low plasma total cholesterol concentration: a sensitive evaluation marker in hospitalized patients with nutritional deficiency malnutrition. J Food Nutr Res 2014; 2(9): 551-555.Article
  • 35. Onder G, Landi F, Volpato S, Fellin R, Carbonin P, Gambassi G, et al. Serum cholesterol levels and in-hospital mortality in the elderly. Am J Med 2003; 115(4): 265-271.ArticlePubMed
  • 36. Kondrup J, Allison SP, Elia M, Vellas B, Plauth M. ESPEN guidelines for nutrition screening 2002. Clin Nutr 2003; 22(4): 415-421.ArticlePubMed
  • 37. Guigoz Y. The Mini Nutritional Assessment (MNA) review of the literature: what does it tell us? J Nutr Health Aging 2006; 10(6): 466-485.PubMed
  • 38. Chung SH, Sohn CM. Nutritional status of hospitalized geriatric patients using by the mini nutritional assessment. Korean J Community Nutr 2005; 10(5): 645-653.
Fig. 1

The protocol of the study

kjcn-23-48-g001.jpg
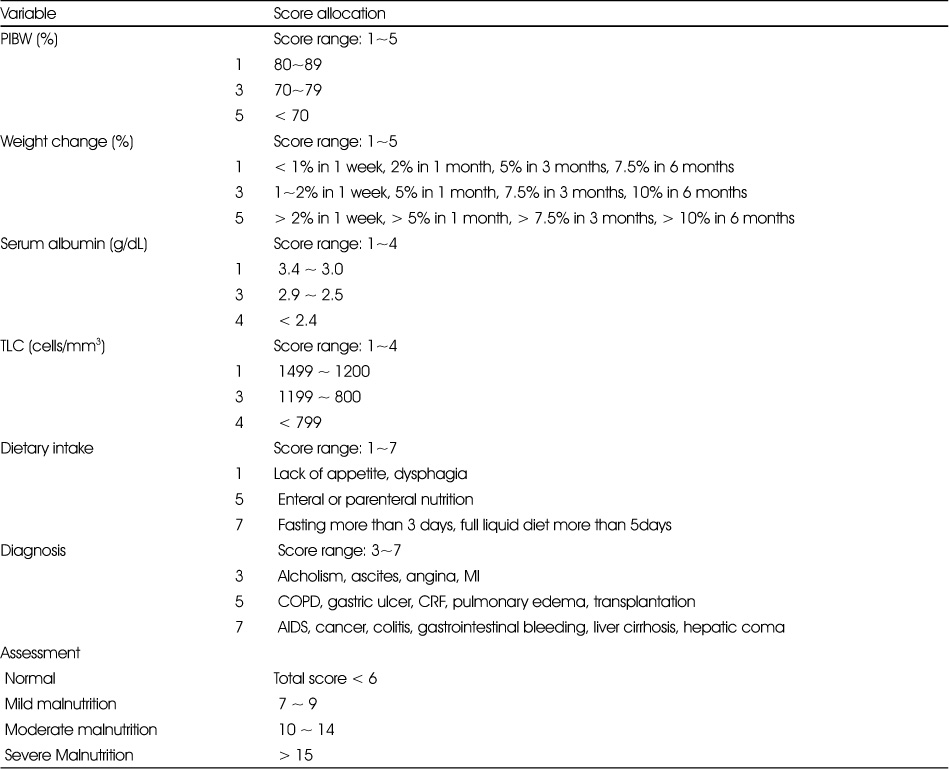
Table 1

Nutritional risk screening

kjcn-23-48-i001.jpg

PIBW; percentage of ideal body weight, MI; myocardiac infarction, COPD; chronic obstructive pulmonary disease, CRF; chronic renal failure, AIDS; acquired immune deficiency syndrome

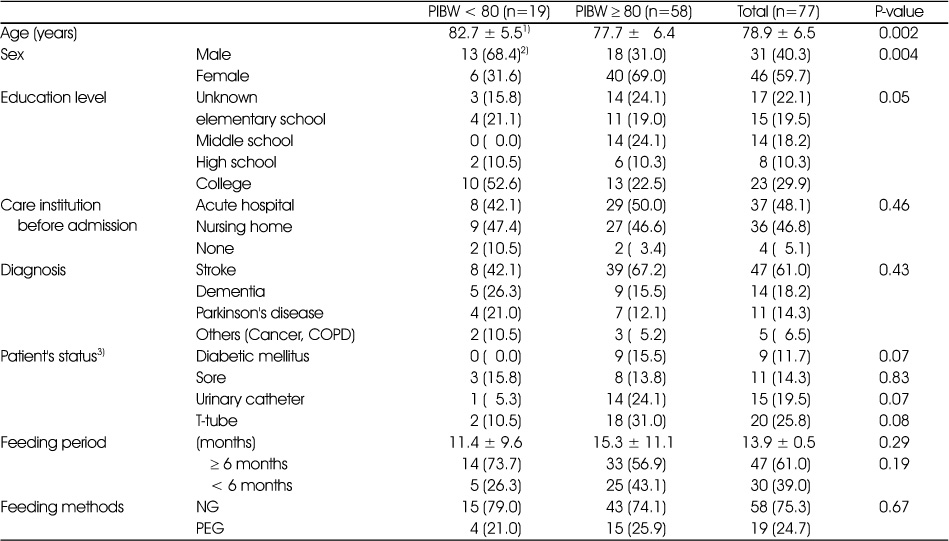
Table 2

General characteristics of the patients

kjcn-23-48-i002.jpg

PIBW; percent of ideal body weight, COPD; chronic obstructive pulmonary disease, T-tube; tracheostomy tube, NG: nasogastric tube, PEG: percutaneous endoscopic gastrostomy tube

1) Means ± SD, 2) N (%), 3) Patient's status to each item were checked and the result is the rate of ‘yes’ to each item

Table 3

Change of enteral feeding status during 6 months of nutrition support

kjcn-23-48-i003.jpg

RC; required calorie, SC; supplied calorie, SRC; supply to required calorie, RP; required protein, SP; supplied protein, SRP; supply to required protein, PIBW; percent ideal body weight

1) Means ± SD, Mean values with different superscripts are significantly different among the time points in each group at p<0.05 as determined by ANOVA and Duncan's multiple range test, 2) N (%), *: p<0.05, **: p<0.01, ***: p<0.0001 between groups

Table 4

Incidence of feeding intolerance during 6 months of nutrition support

kjcn-23-48-i004.jpg

PIBW; percent ideal body weight

1) Percent (%) of patients with each intolerance. Feeding intolerance was checked daily for the first 3 months after admission and when referral from doctor was given thereafter.

Table 5

Change of anthropometric data during 6 months of nutrition support

kjcn-23-48-i005.jpg

PIBW; percent of ideal body weight, BMI; body mass index

1) Means ± SD, Mean values with different superscripts are significantly different among the time points in each group at p<0.05 as determined by ANOVA and Duncan's multiple range test

*: p<0.05 between groups

Table 6

Change of laboratory data during 6 months of nutrition support

kjcn-23-48-i006.jpg

GOT : glutamate oxalacetate transaminase, GPT: glutamate pyruvate transaminase, TP: total protein, ALB: albumin, TC: total cholesterol, HDL-c: high density lipoprotein cholesterol, TG: triglyceride, LDL-c: low density lipoprotein cholesterol, Hb: hemoglobin, Hct: hematocrit, TLC: total lymphocyte count, PIBW; percent ideal body weight, N/A; not available

1) Means ± SD, Mean values with different superscripts are significantly different among the time points in each group at p<0.05 as determined by ANOVA and Duncan's multiple range test

*: p<0.05 between groups

Table 7

Change of nutritional status during 6 months of nutrition support

kjcn-23-48-i007.jpg

1) P value from chi-square test between groups at baseline

2) P value from chi-square test between groups after 6 months of nutrition support

3) P value from chi-square test between baseline and 6 months in each group

Figure & Data

REFERENCES

    Citations

    Citations to this article as recorded by  
    • The Status of Enteral Nutrition Formula Use by Dietitians in Hospitals Within Busan and Gyeongnam Area
      Haejin Kang, Minji Woo, Eunju Park, Yoo Kyoung Park
      Clinical Nutrition Research.2022; 11(1): 9.     CrossRef

    • PubReader PubReader
    • Cite
      CITE
      export Copy Download
      Close
      Download Citation
      Download a citation file in RIS format that can be imported by all major citation management software, including EndNote, ProCite, RefWorks, and Reference Manager.

      Format:
      • RIS — For EndNote, ProCite, RefWorks, and most other reference management software
      • BibTeX — For JabRef, BibDesk, and other BibTeX-specific software
      Include:
      • Citation for the content below
      Effect of Active Nutrition Care on Underweight Elderly Patients Receiving Long-term Enteral Tube Feeding
      Korean J Community Nutr. 2018;23(1):48-59.   Published online February 28, 2018
      Close
    • XML DownloadXML Download
    Figure
    • 0
    We recommend
    Effect of Active Nutrition Care on Underweight Elderly Patients Receiving Long-term Enteral Tube Feeding
    Image
    Fig. 1 The protocol of the study
    Effect of Active Nutrition Care on Underweight Elderly Patients Receiving Long-term Enteral Tube Feeding

    Nutritional risk screening

    PIBW; percentage of ideal body weight, MI; myocardiac infarction, COPD; chronic obstructive pulmonary disease, CRF; chronic renal failure, AIDS; acquired immune deficiency syndrome

    General characteristics of the patients

    PIBW; percent of ideal body weight, COPD; chronic obstructive pulmonary disease, T-tube; tracheostomy tube, NG: nasogastric tube, PEG: percutaneous endoscopic gastrostomy tube

    1) Means ± SD, 2) N (%), 3) Patient's status to each item were checked and the result is the rate of ‘yes’ to each item

    Change of enteral feeding status during 6 months of nutrition support

    RC; required calorie, SC; supplied calorie, SRC; supply to required calorie, RP; required protein, SP; supplied protein, SRP; supply to required protein, PIBW; percent ideal body weight

    1) Means ± SD, Mean values with different superscripts are significantly different among the time points in each group at p<0.05 as determined by ANOVA and Duncan's multiple range test, 2) N (%), *: p<0.05, **: p<0.01, ***: p<0.0001 between groups

    Incidence of feeding intolerance during 6 months of nutrition support

    PIBW; percent ideal body weight

    1) Percent (%) of patients with each intolerance. Feeding intolerance was checked daily for the first 3 months after admission and when referral from doctor was given thereafter.

    Change of anthropometric data during 6 months of nutrition support

    PIBW; percent of ideal body weight, BMI; body mass index

    1) Means ± SD, Mean values with different superscripts are significantly different among the time points in each group at p<0.05 as determined by ANOVA and Duncan's multiple range test

    *: p<0.05 between groups

    Change of laboratory data during 6 months of nutrition support

    GOT : glutamate oxalacetate transaminase, GPT: glutamate pyruvate transaminase, TP: total protein, ALB: albumin, TC: total cholesterol, HDL-c: high density lipoprotein cholesterol, TG: triglyceride, LDL-c: low density lipoprotein cholesterol, Hb: hemoglobin, Hct: hematocrit, TLC: total lymphocyte count, PIBW; percent ideal body weight, N/A; not available

    1) Means ± SD, Mean values with different superscripts are significantly different among the time points in each group at p<0.05 as determined by ANOVA and Duncan's multiple range test

    *: p<0.05 between groups

    Change of nutritional status during 6 months of nutrition support

    1) P value from chi-square test between groups at baseline

    2) P value from chi-square test between groups after 6 months of nutrition support

    3) P value from chi-square test between baseline and 6 months in each group

    Table 1 Nutritional risk screening

    PIBW; percentage of ideal body weight, MI; myocardiac infarction, COPD; chronic obstructive pulmonary disease, CRF; chronic renal failure, AIDS; acquired immune deficiency syndrome

    Table 2 General characteristics of the patients

    PIBW; percent of ideal body weight, COPD; chronic obstructive pulmonary disease, T-tube; tracheostomy tube, NG: nasogastric tube, PEG: percutaneous endoscopic gastrostomy tube

    1) Means ± SD, 2) N (%), 3) Patient's status to each item were checked and the result is the rate of ‘yes’ to each item

    Table 3 Change of enteral feeding status during 6 months of nutrition support

    RC; required calorie, SC; supplied calorie, SRC; supply to required calorie, RP; required protein, SP; supplied protein, SRP; supply to required protein, PIBW; percent ideal body weight

    1) Means ± SD, Mean values with different superscripts are significantly different among the time points in each group at p<0.05 as determined by ANOVA and Duncan's multiple range test, 2) N (%), *: p<0.05, **: p<0.01, ***: p<0.0001 between groups

    Table 4 Incidence of feeding intolerance during 6 months of nutrition support

    PIBW; percent ideal body weight

    1) Percent (%) of patients with each intolerance. Feeding intolerance was checked daily for the first 3 months after admission and when referral from doctor was given thereafter.

    Table 5 Change of anthropometric data during 6 months of nutrition support

    PIBW; percent of ideal body weight, BMI; body mass index

    1) Means ± SD, Mean values with different superscripts are significantly different among the time points in each group at p<0.05 as determined by ANOVA and Duncan's multiple range test

    *: p<0.05 between groups

    Table 6 Change of laboratory data during 6 months of nutrition support

    GOT : glutamate oxalacetate transaminase, GPT: glutamate pyruvate transaminase, TP: total protein, ALB: albumin, TC: total cholesterol, HDL-c: high density lipoprotein cholesterol, TG: triglyceride, LDL-c: low density lipoprotein cholesterol, Hb: hemoglobin, Hct: hematocrit, TLC: total lymphocyte count, PIBW; percent ideal body weight, N/A; not available

    1) Means ± SD, Mean values with different superscripts are significantly different among the time points in each group at p<0.05 as determined by ANOVA and Duncan's multiple range test

    *: p<0.05 between groups

    Table 7 Change of nutritional status during 6 months of nutrition support

    1) P value from chi-square test between groups at baseline

    2) P value from chi-square test between groups after 6 months of nutrition support

    3) P value from chi-square test between baseline and 6 months in each group


    Korean J Community Nutr : Korean Journal of Community Nutrition
    Close layer
    TOP