
Articles
- Page Path
- HOME > Korean J Community Nutr > Volume 18(2); 2013 > Article
-
Original Article
- Nutrition Knowledge, Dietary Attitude, and Dietary Behavior among Children and Adolescents with Type 1 Diabetes
- Na-Yeon Noh, So-Young Nam, Hee-Suk Kang, Ji-Eun Lee, Soo-Kyung Lee
-
Korean Journal of Community Nutrition 2013;18(2):101-111.
DOI: https://doi.org/10.5720/kjcn.2013.18.2.101
Published online: April 30, 2013
Department of Food and Nutrition, Inha University, Incheon, Korea.
1Department of Pediatrics, Inha University Hospital, Incheon, Korea.
2Department of Pediatrics, School of Medicine, Inha University, Incheon, Korea.
- Corresponding author: Soo-Kyung Lee, Department of Food and Nutrition, Inha University, 100 Inharo, Namgu, Incheon 402-751, Korea. Tel: (032) 860-8121, Fax: (032) 860-8120, skleenutrition@inha.ac.kr
• Received: January 3, 2013 • Revised: March 15, 2013 • Accepted: April 1, 2013
Copyright © 2013 The Korean Society of Community Nutrition
- 1,950 Views
- 7 Download
- 1 Crossref


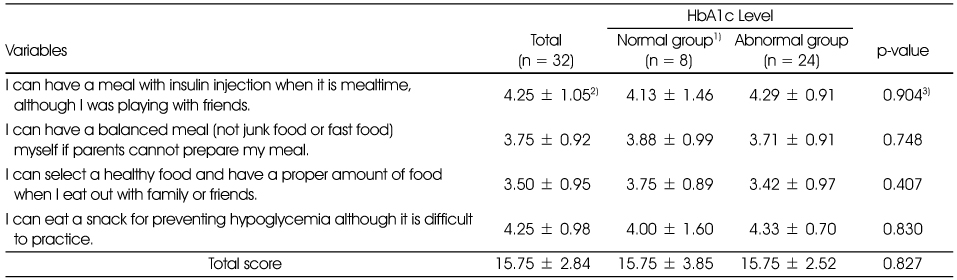


Figure & Data
REFERENCES
Citations
Citations to this article as recorded by 
- Spatial Distribution of Diabetes Prevalence Rates and Its Relationship with the Regional Characteristics
Eun-Kyung Jo, Eun-Won Seo, Kwang-Soo Lee
Health Policy and Management.2016; 26(1): 30. CrossRef
 Cite
CiteNutrition Knowledge, Dietary Attitude, and Dietary Behavior among Children and Adolescents with Type 1 Diabetes
Nutrition Knowledge, Dietary Attitude, and Dietary Behavior among Children and Adolescents with Type 1 Diabetes
General characteristics of the subjects
1) Normal HbAlc level was defined as: 6 - 12 y < 8.0%, 13 - 19 y < 7.5% and > 19 y < 7.0%.
2) N (%)
3) Fisher's exact test
4) Mean ± SD
5) Mann-Whitney U test
6) Single-parent family
Anthropometric and clinical characteristics of the subjects
1) Normal HbAlc level was defined as: 6 - 12 y < 8.0%, 13 - 19 y < 7.5% and > 19 y < 7.0%.
2) Mean ± SD
3) Mann-Whitney U test
4) N (%)
5) Fisher's exact test
HAZ: Height for Age z-score
WAZ: Weight for Age z-score
BAZ: Body Mass Index for Age z-score
Average intake of energy and nutrients
1) Normal HbAlc level was defined as: 6 - 12 y < 8.0%, 13 - 19 y < 7.5% and > 19 y < 7.0%.
2) Mean ± SD, 3) Mann-Whitney U test
Nutrition knowledge related to diabetes
1) Normal HbAlc level was defined as: 6 - 12 y < 8.0%, 13 - 19 y < 7.5% and > 19 y < 7.0%.
2) N (%), 3) Fisher's exact test, 4) Mean ± SD, 5) Mann-Whitney U test
Attitude toward diabetes-related dietary behaviors
1) Normal HbAlc level was defined as: 6 - 12 y < 8.0%, 13 - 19 y < 7.5% and > 19 y < 7.0%.
2) Mean ± SD, Response categories used a 5-point Likert scale (High scores indicate strong agreement.).
3) Mann-Whitney U test
Subjective norms toward diabetes-related dietary behaviors
1) Normal HbAlc level was defined as: 6 - 12 y < 8.0%, 13 - 19 y < 7.5% and > 19 y < 7.0%.
2) Mean ± SD, Response categories used a 5-point Likert scale (High scores indicate strong agreement.).
3) Mann-Whitney U test, 4) Data multiplied Normative Belief by Motivation to Comply
Perceived behavioral control toward diabetes-related dietary behaviors
1) Normal HbAlc level was defined as: 6 - 12 y < 8.0%, 13 - 19 y < 7.5% and > 19 y < 7.0%.
2) Mean ± SD, Response categories used a 5-point Likert scale (High scores indicate strong agreement.).
3) Mann-Whitney U test
Behavioral intention and dietary behaviors related to blood glucose control
1) Normal HbAlc level was defined as: 6 - 12 y < 8.0%, 13 - 19 y < 7.5% and > 19 y < 7.0%.
2) Mean ± SD, Response categories used a 5-point Likert scale (High scores indicate strong agreement.).
3) Mann-Whitney U test
Multiple regressions on the Theory of Planned Behavior
1) Multiple logistic regression analysis adjusted for age and sex.
2) Standardized parameter estimate R2 = 0.311, model F = 2.350, p = 0.069
3) Standardized parameter estimate R2 = 0.553, model F = 8.356, p = 0.000
Table 1
General characteristics of the subjects
1) Normal HbAlc level was defined as: 6 - 12 y < 8.0%, 13 - 19 y < 7.5% and > 19 y < 7.0%. 2) N (%) 3) Fisher's exact test 4) Mean ± SD 5) Mann-Whitney U test 6) Single-parent family
Table 2
Anthropometric and clinical characteristics of the subjects
1) Normal HbAlc level was defined as: 6 - 12 y < 8.0%, 13 - 19 y < 7.5% and > 19 y < 7.0%. 2) Mean ± SD 3) Mann-Whitney U test 4) N (%) 5) Fisher's exact test HAZ: Height for Age z-score WAZ: Weight for Age z-score BAZ: Body Mass Index for Age z-score
Table 3
Average intake of energy and nutrients
1) Normal HbAlc level was defined as: 6 - 12 y < 8.0%, 13 - 19 y < 7.5% and > 19 y < 7.0%. 2) Mean ± SD, 3) Mann-Whitney U test
Table 4
Nutrition knowledge related to diabetes
1) Normal HbAlc level was defined as: 6 - 12 y < 8.0%, 13 - 19 y < 7.5% and > 19 y < 7.0%. 2) N (%), 3) Fisher's exact test, 4) Mean ± SD, 5) Mann-Whitney U test
Table 5
Attitude toward diabetes-related dietary behaviors
1) Normal HbAlc level was defined as: 6 - 12 y < 8.0%, 13 - 19 y < 7.5% and > 19 y < 7.0%. 2) Mean ± SD, Response categories used a 5-point Likert scale (High scores indicate strong agreement.). 3) Mann-Whitney U test
Table 6
Subjective norms toward diabetes-related dietary behaviors
1) Normal HbAlc level was defined as: 6 - 12 y < 8.0%, 13 - 19 y < 7.5% and > 19 y < 7.0%. 2) Mean ± SD, Response categories used a 5-point Likert scale (High scores indicate strong agreement.). 3) Mann-Whitney U test, 4) Data multiplied Normative Belief by Motivation to Comply
Table 7
Perceived behavioral control toward diabetes-related dietary behaviors
1) Normal HbAlc level was defined as: 6 - 12 y < 8.0%, 13 - 19 y < 7.5% and > 19 y < 7.0%. 2) Mean ± SD, Response categories used a 5-point Likert scale (High scores indicate strong agreement.). 3) Mann-Whitney U test
Table 8
Behavioral intention and dietary behaviors related to blood glucose control
1) Normal HbAlc level was defined as: 6 - 12 y < 8.0%, 13 - 19 y < 7.5% and > 19 y < 7.0%. 2) Mean ± SD, Response categories used a 5-point Likert scale (High scores indicate strong agreement.). 3) Mann-Whitney U test
Table 9
Multiple regressions on the Theory of Planned Behavior
1) Multiple logistic regression analysis adjusted for age and sex. 2) Standardized parameter estimate R2 = 0.311, model F = 2.350, p = 0.069 3) Standardized parameter estimate R2 = 0.553, model F = 8.356, p = 0.000


