
Articles
- Page Path
- HOME > Korean J Community Nutr > Volume 18(2); 2013 > Article
-
Original Article
- Nutritional Assessment and Management in Long-term Care Insurance's Home Visit Care Service
- Mi-Ock Yoon, Hyun-Kyung Moon, Seo-Yeon Kim, Bok-Hee Kim
-
Korean Journal of Community Nutrition 2013;18(2):142-153.
DOI: https://doi.org/10.5720/kjcn.2013.18.2.142
Published online: April 30, 2013
Department of Food and Nutrition, Dankook University, Gyeonggi, Korea.
1Department of Food and Nutrition, Chosun University, Kwangju, Korea.
- Corresponding author: Hyun-Kyung Moon, Department of Food and Nutrition, Dankook University, 152 Jukjeon-ro, Suji-gu, Yongin-si, Gyeonggi-do 448-701, Korea. Tel: (031) 8005-3173, Fax: (031) 8021-7200, moonhk52@dankook.ac.kr
• Received: May 30, 2012 • Revised: January 31, 2013 • Accepted: March 27, 2013
Copyright © 2013 The Korean Society of Community Nutrition
- 1,692 Views
- 3 Download
- 8 Crossref
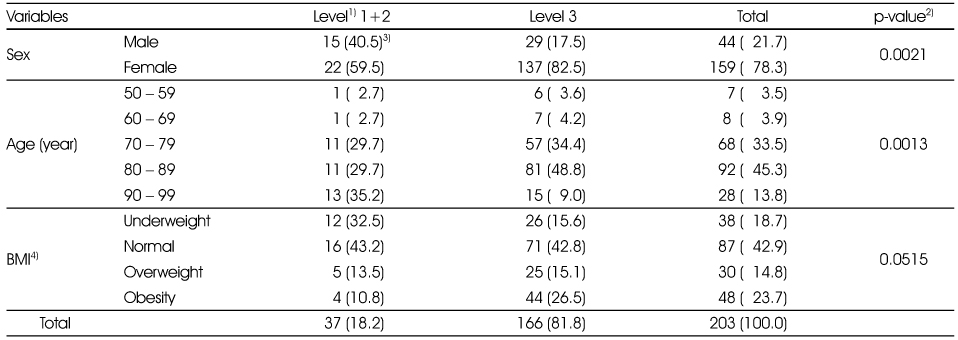
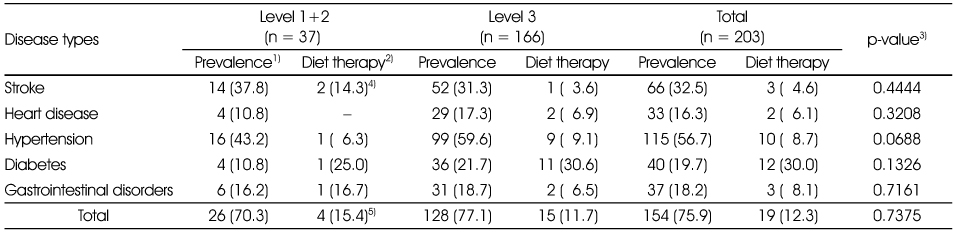
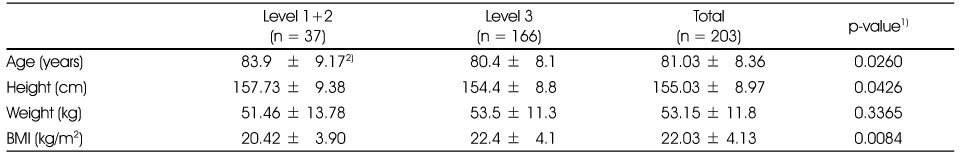
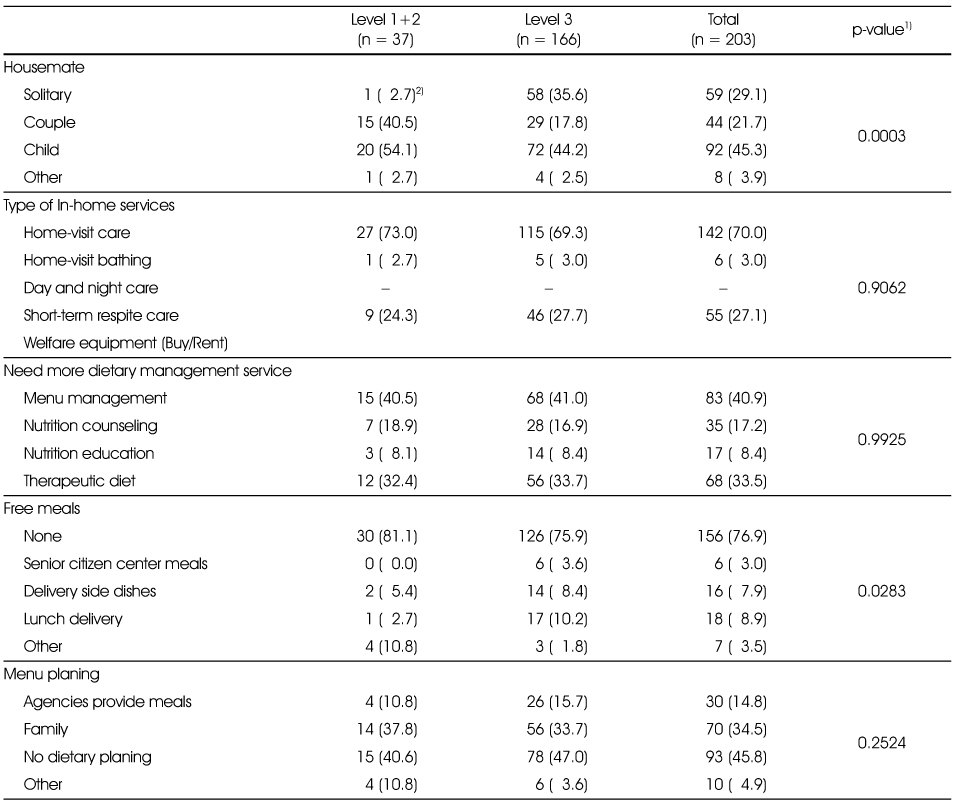
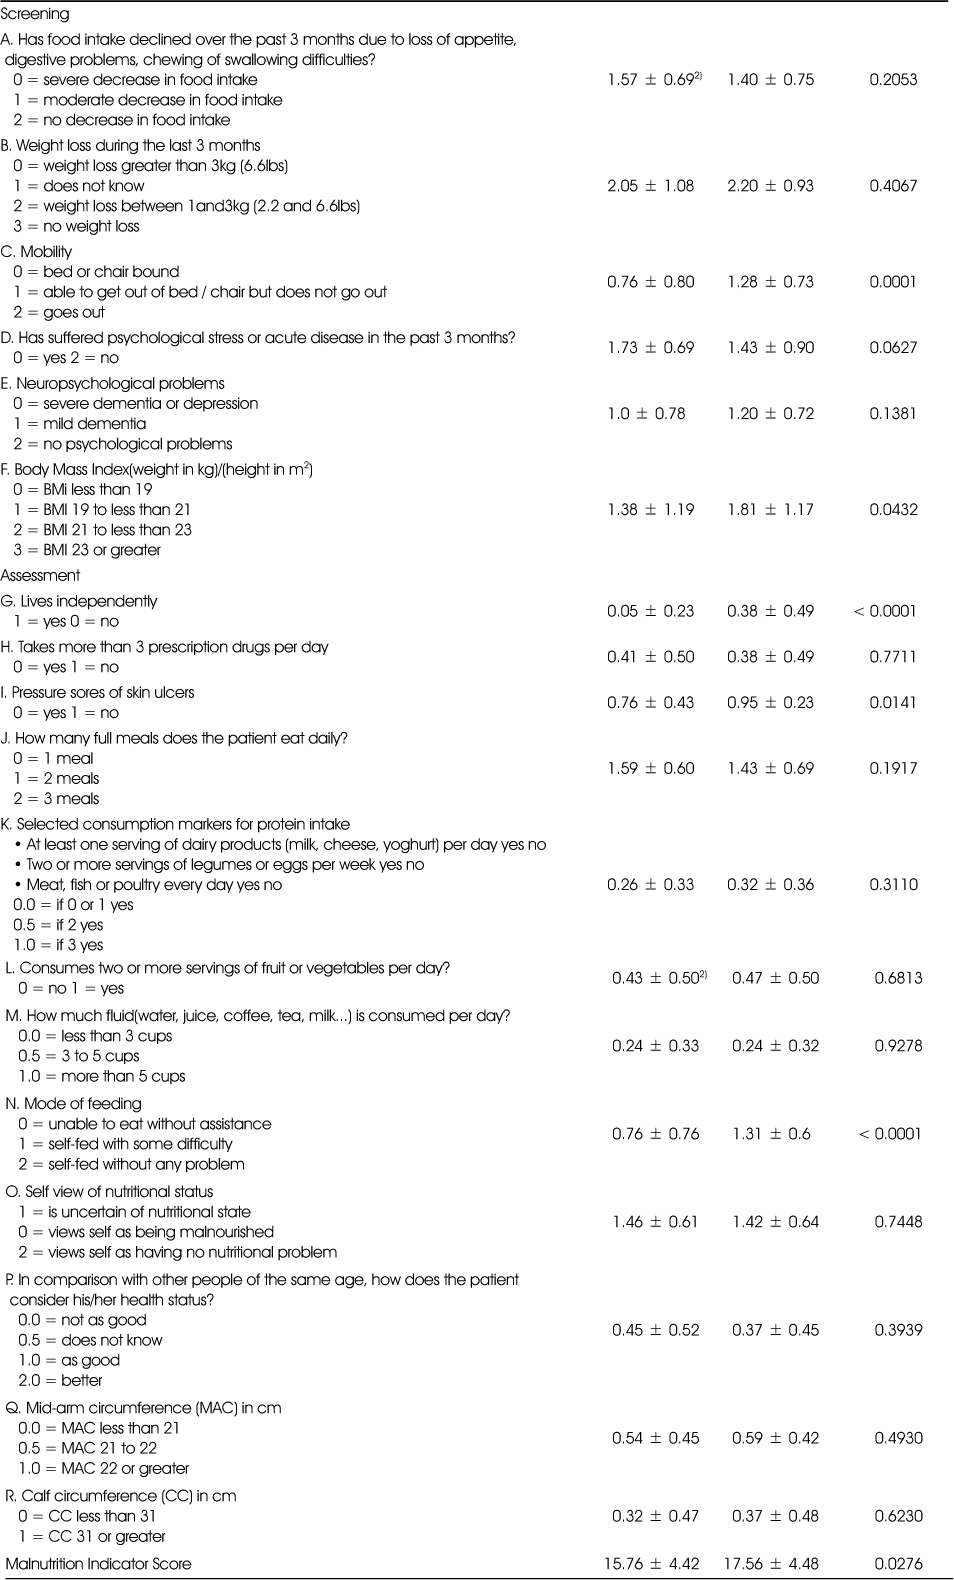
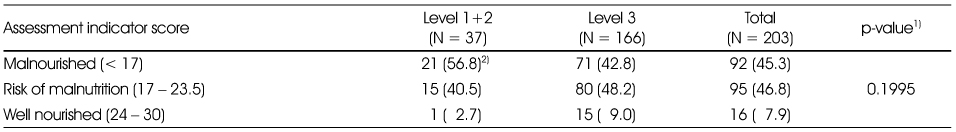
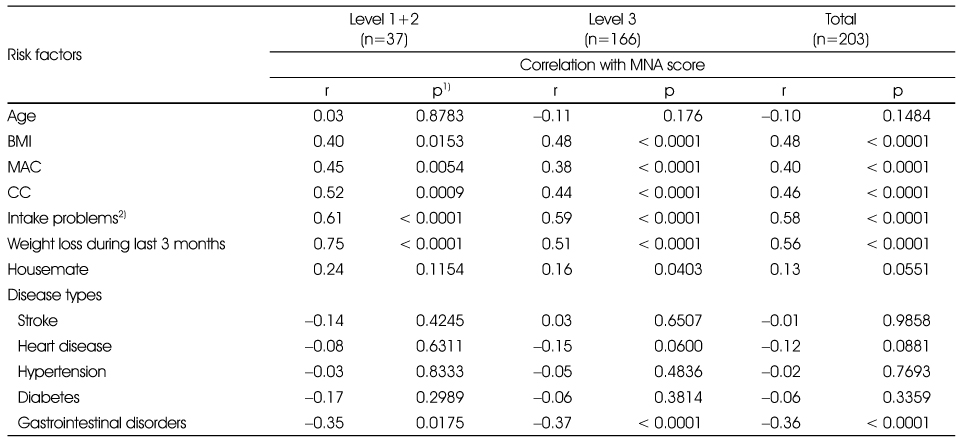
Figure & Data
REFERENCES
Citations
Citations to this article as recorded by 
- Factors associated with malnutrition in demented and non-demented elderly residing in the community of Korea: a cross-sectional descriptive and analytical study
Jinhee Kwon, Jung Hee Kim, Hyeonjin Jeong, Jung Suk Lee
Korean Journal of Community Nutrition.2024; 29(5): 359. CrossRef - The Factors Affecting Frailty among the Elderly in Korea: A Study Using the Frailty Cohort
DaSol Park, Hee-Sun Kim
International Journal of Environmental Research and Public Health.2022; 20(1): 670. CrossRef - Current Status of Sanitary and Nutritional Food Service in Elderly Day Care Center
Jeonghyeon Woo, Yoo Kyoung Park, Mi-Hyun Kim, Soo-Kyung Lee, Kyunghee Song, Hye-Kyeong Kim
Korean Journal of Community Nutrition.2020; 25(5): 374. CrossRef - Feasibility Study on the Dietary Improvement Program Development for Senior Citizens
Sung-Hee Kim, Boram Kim, Nami Joo
Korean Journal of Community Nutrition.2017; 22(3): 218. CrossRef - Job importance, job performance, and job satisfaction in dietitians at geriatric hospitals or elderly healthcare facilities in Jeju
Hye-Sook Kang, Yunkyoung Lee, In-Sook Chae
Journal of Nutrition and Health.2016; 49(3): 189. CrossRef - Comparison of Health Status and Mini Nutritional Assessment according to Self-esteem of Elderly in Care Hospital
Eun-mi Kim, Jin Kwon
Journal of the East Asian Society of Dietary Life.2015; 25(4): 631. CrossRef - Relationship between Sense of Belonging, Powerlessness and Nutritional status of Elderly People
Mi-Hye Kim, Hae-Kyung Chung
Journal of The Korean Society of Food Culture.2015; 30(1): 118. CrossRef - Nutrition Status of Elderly Female Patients in Long-term Care Hospital according to Meal Types and Eating Ability
Hyejin Ahn, Juhee Kang, Hongmie Lee
Korean Journal of Community Nutrition.2014; 19(2): 187. CrossRef
 Cite
CiteNutritional Assessment and Management in Long-term Care Insurance's Home Visit Care Service
Nutritional Assessment and Management in Long-term Care Insurance's Home Visit Care Service
General characteristics of the subjects
1) Level: Level 1 = Requires help in all aspects of daily life (score > 95, n = 9); Level 2 = Requires help in most parts of daily life (75 ≤ score < 95, n = 28); Level 3 = Requires help in part of daily life (55 ≤ score > 75, n = 166)
2) By chi-square tests
3) N (%)
4) BMI: Body Mass Index = body weight(kg)/height (m)2 (Underweight: BMI < 18.5, Normal: 18.5 ≤ BMI < 23.0, Overweight: 23.0 ≤ BMI < 25.0, Obesity: BMI ≥ 25.0)
Disease types and number of elderly with the diet therapy of the subjects
1) Number of disease holder within number of elderly
2) Number of diet therapy within number of disease holder
3) p-values were derived by chi-square tests between prevalence of level 1+2 group and level 3group. but Both were not significant.
4) N (%)
5) Number of disease holder (people with more than one disease counted as one person) with diet therapy
Age and anthropometry of the subjects by the long-term care level
1) p-values were calculated using the t-test comparing between the level 1+2 group and level 3 group
2) Mean ± SD
Diet related variables of the subjects by the long-term care level
1) By chi-square tests
2) N (%)
Comparison of MNA score of the subjects by the long-term care level
1) By t-test
2) Mean ± SD
MNA assesment of the subjects by the long-term care level
1) By chi-square test
2) N (%)
MNA: Mini Nutritional Assessment
Correlations between MNA score and Individual risk factors for malnutrition of the subjects by the long-term care level
1) by Pearson's correlation test: Age, BMI, MAC, CC, Intake problems, Weight loss during last 3 months; by Spearman's correlation test: Housemate, Disease types
2) Loss of appetite, digestive problems, chewing of swallowing difficulties
MNA: Mini Nutritional Assessment
BMI: Body Mass Index = body weight(kg)/height (m)2
MAC: Mid-arm circumference
CC: Calf-circumference
Table 1
General characteristics of the subjects
1) Level: Level 1 = Requires help in all aspects of daily life (score > 95, n = 9); Level 2 = Requires help in most parts of daily life (75 ≤ score < 95, n = 28); Level 3 = Requires help in part of daily life (55 ≤ score > 75, n = 166) 2) By chi-square tests 3) N (%) 4) BMI: Body Mass Index = body weight(kg)/height (m)2 (Underweight: BMI < 18.5, Normal: 18.5 ≤ BMI < 23.0, Overweight: 23.0 ≤ BMI < 25.0, Obesity: BMI ≥ 25.0)
Table 2
Disease types and number of elderly with the diet therapy of the subjects
1) Number of disease holder within number of elderly 2) Number of diet therapy within number of disease holder 3) p-values were derived by chi-square tests between prevalence of level 1+2 group and level 3group. but Both were not significant. 4) N (%) 5) Number of disease holder (people with more than one disease counted as one person) with diet therapy
Table 3
Age and anthropometry of the subjects by the long-term care level
1) p-values were calculated using the t-test comparing between the level 1+2 group and level 3 group 2) Mean ± SD
Table 4
Diet related variables of the subjects by the long-term care level
1) By chi-square tests 2) N (%)
Table 5
Comparison of MNA score of the subjects by the long-term care level
1) By t-test 2) Mean ± SD
Table 6
MNA assesment of the subjects by the long-term care level
1) By chi-square test 2) N (%) MNA: Mini Nutritional Assessment
Table 7
Correlations between MNA score and Individual risk factors for malnutrition of the subjects by the long-term care level
1) by Pearson's correlation test: Age, BMI, MAC, CC, Intake problems, Weight loss during last 3 months; by Spearman's correlation test: Housemate, Disease types 2) Loss of appetite, digestive problems, chewing of swallowing difficulties MNA: Mini Nutritional Assessment BMI: Body Mass Index = body weight(kg)/height (m)2 MAC: Mid-arm circumference CC: Calf-circumference


