
Articles
- Page Path
- HOME > Korean J Community Nutr > Volume 28(2); 2023 > Article
-
Research Article
- Changes in dietary habits and chronic diseases before and after COVID-19 by regions using data from the 2018-2020 Korea Community Health Survey and Consumer Behavior Survey for Foods: a cross-sectional study
-
Surim Park1)
 , Eun-hee Jang2), Seungmin Lee3),†
 -
Korean Journal of Community Nutrition 2023;28(2):124-140.
DOI: https://doi.org/10.5720/kjcn.2023.28.2.124
Published online: April 30, 2023
1)Master student, Department of Food and Nutrition, Sungshin Women’s University, Seoul, Korea
2)Doctoral student, Department of Food and Nutrition, Sungshin Women’s University, Seoul, Korea
3)Professor, Department of Food and Nutrition, Sungshin Women’s University, Seoul, Korea
- †Corresponding author Seungmin Lee Department of Food and Nutrition, Sungshin Women's University, 55, Dobong-ro 76 ga-gil, Gangbuk-gu, Seoul 01133, Korea Tel: +82-2-920-7671 Fax: +82-2-920-2076 E-mail: smlee@sungshin.ac.kr
• Received: November 28, 2022 • Revised: April 14, 2023 • Accepted: April 17, 2023
© 2023 The Korean Society of Community Nutrition
This is an Open-Access article distributed under the terms of the Creative Commons Attribution Non-Commercial License (http://creativecommons.org/licenses/by-nc/4.0) which permits unrestricted non-commercial use, distribution, and reproduction in any medium, provided the original work is properly cited.
- 1,711 Views
- 18 Download
Abstract
-
Objectives
- This study examined the changes in dietary habits, the prevalence of chronic diseases, and mental health problems in the regional areas of the Republic of Korea before and after the COVID-19 pandemic to provide evidence of the status of regional health inequalities.
-
Methods
- This study analyzed Korean adults aged 19 or older who participated in the Korea Community Health Survey (n = 686,708) and Consumer Behavior Survey for Foods (n = 19,109) from 2018 to 2020. The participants were classified according to their residence area (Seoul metropolitan area, Metropolitan cities, Provinces); 2018-2019 were defined as before COVID-19, and 2020 as after COVID-19. The dietary behaviors, chronic diseases, and mental health problems were measured using a self-report questionnaire.
-
Results
- After COVID-19, the eating-out usage rate in the Seoul metropolitan area and Provinces decreased compared to before COVID-19 (P < 0.001), and when responding that they eat out, the frequency of eating out with household members in the Seoul metropolitan area increased (P = 0.024). The deliveries/takeout usage rate in the Provinces decreased after COVID-19 compared to before (P < 0.001). After COVID-19, the prevalence of obesity decreased in all regions (P < 0.001), and the prevalence of hypertension increased significantly in the Provinces (P = 0.015). The prevalence of diabetes mellitus increased continuously before and after COVID-19 in all regions (P < 0.002). High-risk subjective stress levels increased significantly in the Seoul metropolitan area (P < 0.001), and sleep duration significantly increased in all regions (P < 0.001). Major depressive disorder was reduced significantly in Metropolitan cities (P = 0.042) and Provinces (P < 0.001).
-
Conclusions
- After the COVID-19 pandemic, the prevalence of chronic diseases and mental health problems showed regional differences along with changes in dietary habits. It is necessary to reflect the regional differences in dietary habits in future policies resolving regional health inequalities.
Introduction
Methods
1) Korea Community Health Survey
2) Consumer Behavior Survey for Foods
Results
Discussion
Conclusion
-
Conflict of Interest
There are no financial or other issues that might lead to a conflict of interest.
-
Funding
This study was supported by the Korean Society of Community Nutrition funded by the Korea Disease Control and Prevention Agency (No. ISSN 2733-5488).
-
Acknowledgments
The author wishes to thank the Korean Society of Community Nutrition for providing the opportunity to participate in the 2022 Excellent Researcher Research Support Project.
-
Data Availability
The data that support the findings of this study are openly available in the Consumer Behavior Survey for Foods at https://www.krei.re.kr/foodSurvey/index.do, and are available at request in the Korea Community Health Survey at https://chs.kdca.go.kr/
NOTES
Fig. 1.Changes in chronic diseases and mental health before and after COVID-19 from the Korea Community Health Survey
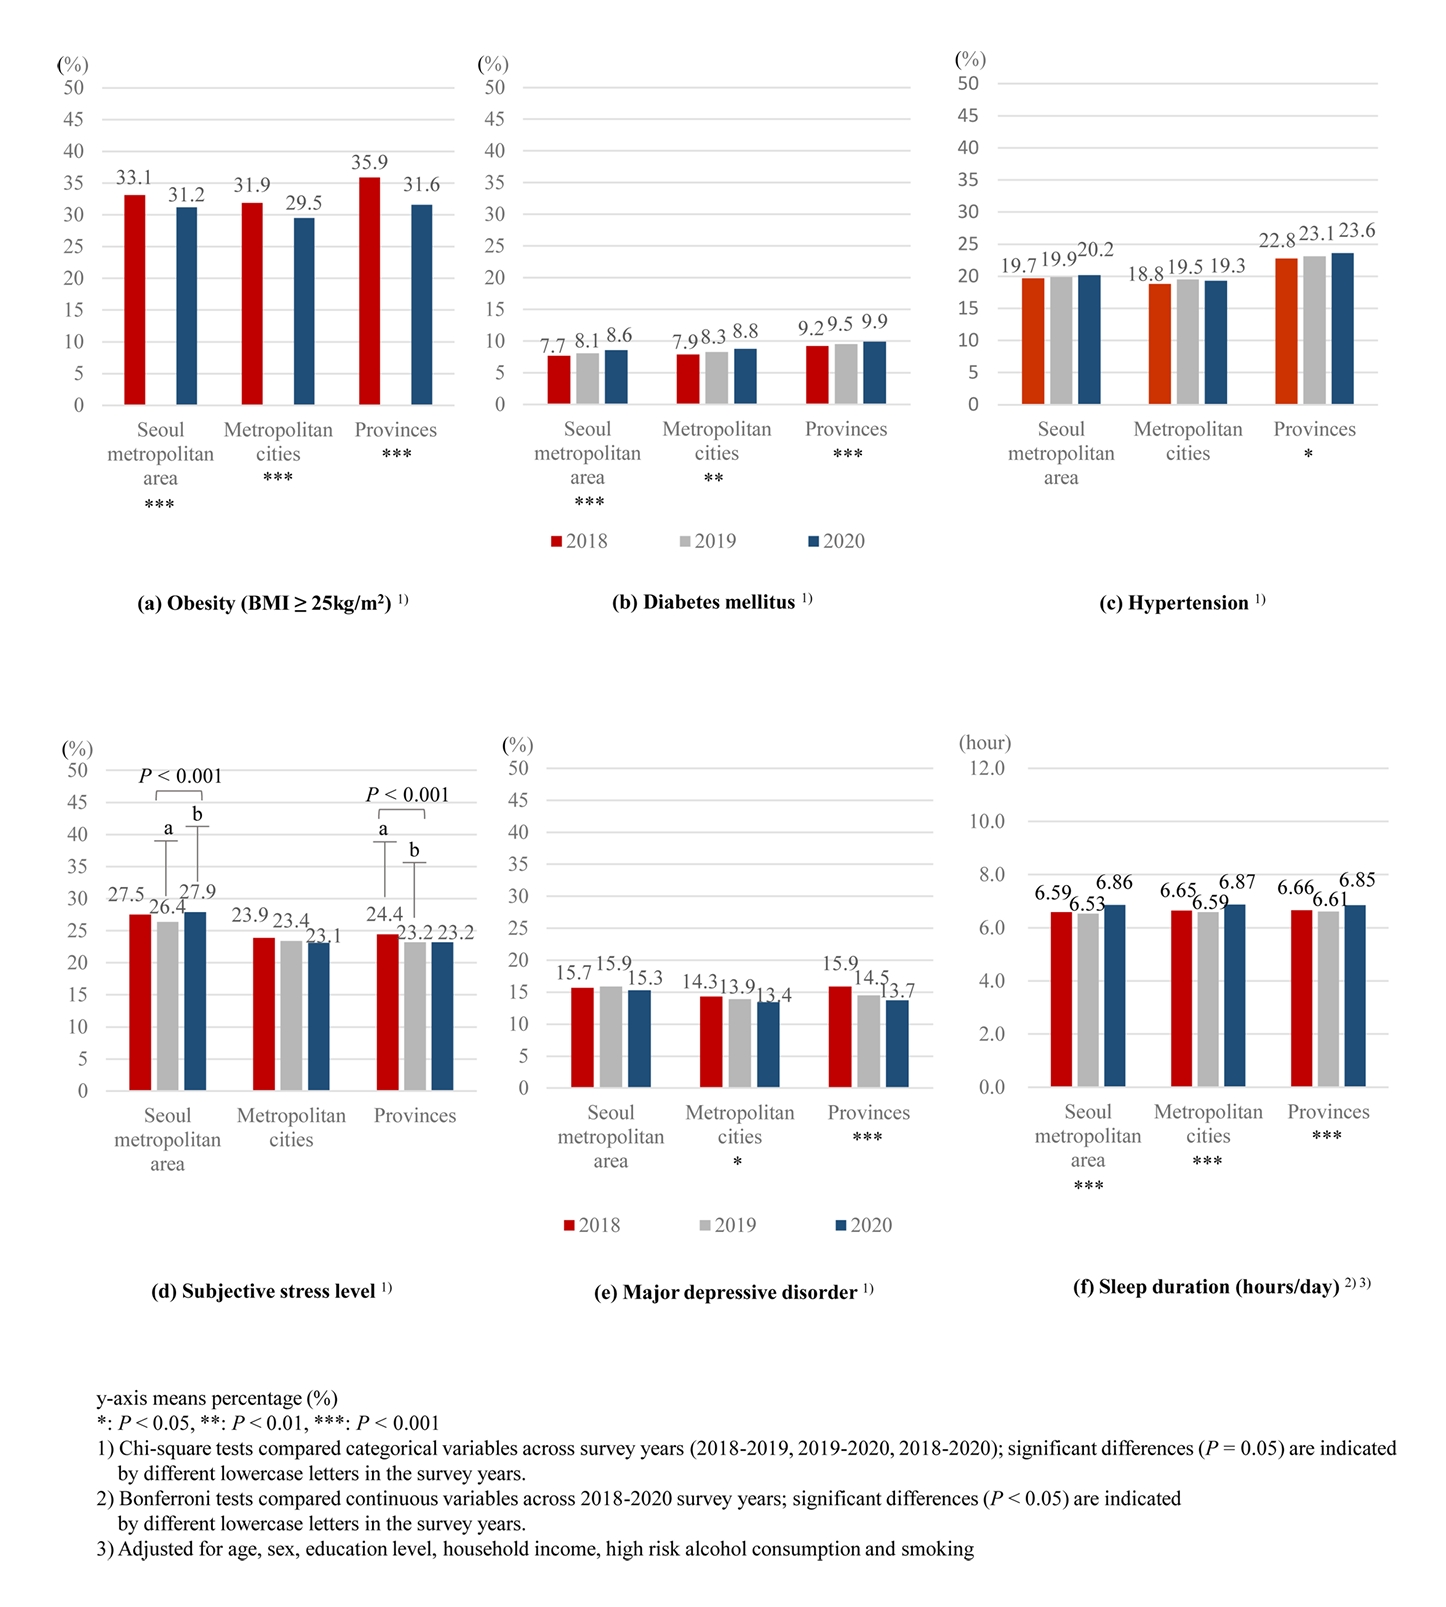
Table 1.General characteristics of the participants from the Korea Community Health Survey
Table 2.General characteristics of the participants from the Consumer Behavior Survey for Foods
Table 3.Changes in eating-out behaviors before and after COVID-19 according to the area from the Consumer Behavior Survey for Foods
| Variables |
Seoul metropolitan area |
P-value | ||
|---|---|---|---|---|
| 2018 (n = 2,011) | 2019 (n = 1,801) | 2020 (n = 1,936) | ||
| Eating-out1) | n = 2,011 | n = 1,801 | n = 1,936 | < 0.001 |
| Yes | 1,851 (92.5)a | 1,675 (94.1)a | 1,635 (85.3)b | |
| Frequency of eating out | n = 1,851 | n = 1,675 | n = 1,635 | 0.088 |
| ≥ 1 time/week | 1,166 (66.8) | 1,130 (71.1) | 1,072 (70.4) | |
| 1 time/2 weeks | 375 (18.5) | 275 (16.4) | 297 (15.9) | |
| ≤ 1 time/month | 310 (14.6) | 270 (12.5) | 266 (13.8) | |
| Eating-out expenditure (thousand won/month)2)3) | 110,862.6 ± 1,853.3a | 119,238.9 ± 1,779.4b | 121,962.9 ± 1,874.3b | < 0.001 |
| Eating-out with family1) | n = 2,011 | n = 1,801 | n = 1,936 | < 0.001 |
| Yes | 1,729 (87.4)a | 1,625 (92.3)b | 1,628 (83.7)a | |
| Frequency of eating out with family1) | n = 1,729 | n = 1,625 | n = 1,628 | 0.024 |
| ≥ 1 time/week | 483 (32.0)a | 558 (25.2)ab | 628 (41.5)b | |
| 1 time/2 weeks | 673 (36.9) | 558 (36.7) | 575 (32.2) | |
| ≤ 1 time/month | 573 (31.1) | 509 (38.1) | 425 (26.3) | |
| Eating-out expenditure with family (thousand won/month)2)3) | 124,559.7 ± 1,767.4a | 124,599.0 ± 1,662.4a | 130,443.8 ± 1,750.4b | < 0.001 |
| Variables |
Metropolitan cities |
P-value | ||
|---|---|---|---|---|
| 2018 (n = 1,805) | 2019 (n = 1,762) | 2020 (n = 1,727) | ||
| Eating-out | n = 1,805 | n = 1,762 | n = 1,727 | 0.092 |
| Yes | 1,691 (94.1) | 1,650 (92.7) | 1,576 (90.4) | |
| Frequency of eating out | n = 1,691 | n = 1,650 | n = 1,576 | 0.080 |
| ≥ 1 time/week | 964 (56.7) | 950 (59.3) | 943 (61.6) | |
| 1 time/2 weeks | 305 (17.3) | 288 (16.8) | 298 (18.6) | |
| ≤ 1 time/month | 422 (26.1) | 412 (23.8) | 335 (19.8) | |
| Eating-out expenditure (thousand won/month)2)3) | 96,369.1 ± 2,042.5a | 107,740.7 ± 2,028.0b | 108,115.5 ± 1,977.3b | < 0.001 |
| Eating-out with family | n = 1,805 | n = 1,762 | n = 1,727 | 0.174 |
| Yes | 1,613 (89.8) | 1,594 (91.2) | 1,510 (87.2) | |
| Frequency of eating out with family | n = 1,613 | n = 1,594 | n = 1,510 | 0.069 |
| ≥ 1 time/week | 610 (41.3) | 481 (31.7) | 500 (33.5) | |
| 1 time/2 weeks | 466 (26.0) | 480 (31.2) | 405 (27.2) | |
| ≤ 1 time/month | 537 (32.6) | 633 (37.1) | 605 (39.3) | |
| Eating-out expenditure with family (thousand won/month)2)3) | 108,300.4 ± 2,059.9 | 111,910.0 ± 2,016.2a | 107,146.6 ± 1,983.1a | 0.475 |
| Variables |
Provinces |
P-value | ||
|---|---|---|---|---|
| 2018 (n = 2,762) | 2019 (n = 2,613) | 2020 (n = 2,692) | ||
| Eating-out1) | n = 2,762 | n = 2,613 | n = 2,692 | < 0.001 |
| Yes | 2,274 (84.3)a | 2,212 (87.3)a | 2,174 (78.4)b | |
| Frequency of eating-out | n = 2,274 | n = 2,212 | n = 2,174 | 0.111 |
| ≥ 1 time/week | 1,024 (47.7) | 1,029 (49.0) | 972 (44.0) | |
| 1 time/2 weeks | 536 (22.0) | 458 (19.2) | 446 (21.6) | |
| ≤ 1 time/month | 714 (30.3) | 725 (31.8) | 756 (34.4) | |
| Eating-out expenditure (thousand won/month)2)3) | 88,540.9 ± 1,566.9 | 89,531.5 ± 1,497.3 | 89,273.0 ± 1,540.2 | 0.514 |
| Eating-out with family1) | n = 2,762 | n = 2,613 | n = 2,692 | 0.004 |
| Yes | 2,065 (76.6)a | 2,091 (82.3)b | 2,081 (75.9)a | |
| Frequency of eating-out with family | n = 2,065 | n = 2,091 | n = 2,081 | 0.274 |
| ≥ 1 time/week | 711 (36.1) | 615 (31.4) | 601 (29.9) | |
| 1 time/2 weeks | 549 (26.3) | 597 (28.2) | 619 (31.3) | |
| ≤ 1 time/month | 805 (37.6) | 879 (40.4) | 861 (38.8) | |
| Eating-out expenditure with family (thousand won/month)2)3) | 94,543.3 ± 1,722.0a | 101,290.0 ± 1,613.9b | 107,515.3 ± 1,636.1c | < 0.001 |
Mean ± SE or n (%)
P-values by chi-square or ANOVA test
1)Chi-square tests compared categorical variables across survey years (2018-2019, 2019-2020, 2018-2020); significant differences (P = 0.05) are indicated by different lowercase letters in the same row.
2)Bonferroni tests compared continuous variables across 2018-2020 survey years; significant differences (P < 0.05) are indicated by different lowercase letters in the same row.
3)Adjusted for age, sex, education level, and household income
Table 4.Changes in the deliveries/takeout before and after COVID-19 by area from the Consumer Behavior Survey for Foods
| Variables |
Seoul metropolitan area |
P-value | ||
|---|---|---|---|---|
| 2018 (n = 2,011) | 2019 (n = 1,801) | 2020 (n = 1,936) | ||
| Using deliveries/takeout | n = 2,011 | n = 1,801 | n = 1,936 | 0.051 |
| Yes | 1,297 (64.3) | 1,058 (60.3) | 1,020 (56.6) | |
| Frequency of deliveries/take-outs1) | n = 1,297 | n = 1,058 | n = 1,020 | < 0.001 |
| ≥ 1 time/week | 372 (30.5)a | 382 (40.0)b | 436 (44.4)b | |
| 1 time/2 weeks | 482 (36.1) | 393 (35.1) | 342 (34.1) | |
| ≤ 1 time/month | 443 (33.4) | 283 (24.9) | 242 (21.5) | |
| Deliveries/takeout food expenditure (thousand won/month)3) | - | 55,695.6 ± 13,273.1 | 57,983.2 ± 9,475.6 | < 0.001 |
| Using deliveries or takeout with family | n = 2,011 | n = 1,801 | n = 1,936 | 0.565 |
| Yes | 1,619 (81.6) | 1,421 (82.0) | 1,543 (79.5) | |
| Frequency of deliveries/takeout with family1) | n = 1,619 | n = 1,421 | n = 1,543 | < 0.001 |
| ≥ 1 time/week | 442 (31.4)a | 418 (31.6)a | 639 (44.1)b | |
| 1 time/2 weeks | 567 (33.6) | 572 (42.2) | 617 (39.4) | |
| ≤ 1 time/month | 610 (35.0) | 431 (26.3) | 287 (16.5) | |
| Deliveries/takeout food expenditure with family (thousand won/month)2)3) | 55,815.5 ± 1,042.6a | 54,407.5 ± 1,010.7a | 61,191.2 ± 1,025.7b | < 0.001 |
| Variables |
Metropolitan cities |
P-value | ||
|---|---|---|---|---|
| 2018 (n = 1,805) | 2019 (n = 1,762) | 2020 (n = 1,727) | ||
| Using deliveries/takeout | n = 1,805 | n = 1,762 | n = 1,727 | 0.310 |
| Yes | 798 (45.5) | 862 (50.4) | 808 (46.2) | |
| Frequency of deliveries/take-outs | n = 798 | n = 862 | n = 808 | 0.391 |
| ≥ 1 time/week | 258 (34.5) | 248 (30.5) | 247 (32.3) | |
| 1 time/2 weeks | 251 (30.8) | 270 (32.0) | 281 (36.0) | |
| ≤ 1 time/month | 289 (34.7) | 344 (37.6) | 280 (31.7) | |
| Deliveries/takeout food expenditure (thousand won/month)3) | - | 50,805.2 ± 15,047.7 | 46,188.7 ± 11,729.8 | 0.053 |
| Using deliveries or takeout with family | n = 1,805 | n = 1,762 | n = 1,727 | 0.080 |
| Yes | 1,390 (78.9) | 1,281 (73.9) | 1,297 (74.5) | |
| Frequency of deliveries/takeout with family | n = 1,390 | n = 1,281 | n = 1,297 | 0.263 |
| ≥ 1 time/week | 425 (34.6) | 402 (33.9) | 434 (33.7) | |
| 1 time/2 weeks | 475 (35.8) | 381 (28.6) | 361 (26.3) | |
| ≤ 1 time/month | 490 (29.6) | 498 (37.5) | 502 (5.00) | |
| Deliveries/takeout food expenditure with family (thousand won/month)3) | 49,346.4 ± 1,040.5 | 53,954.2 ± 1,059.0 | 46,603.0 ± 1,017.2 | 0.232 |
| Variables |
Provinces |
P-value | ||
|---|---|---|---|---|
| 2018 (n = 2,762) | 2019 (n = 2,613) | 2020 (n = 2,692) | ||
| Using deliveries/takeout1) | n = 2,762 | n = 2,613 | n = 2,692 | < 0.001 |
| Yes | 1,120 (44.1)a | 951 (40.1)ab | 939 (35.0)b | |
| Frequency of deliveries/take-outs | n = 1,120 | n = 951 | n = 939 | 0.178 |
| ≥ 1 time/week | 313 (32.6) | 266 (30.5) | 232 (25.3) | |
| 1 time/2 weeks | 318 (26.5) | 209 (21.6) | 283 (29.8) | |
| ≤ 1 time/month | 489 (40.9) | 476 (48.0) | 424 (44.8) | |
| Deliveries/takeout food expenditure (thousand won/month)3) | - | 36,884.8 ± 13,725.2 | 39,227.2 ± 10,660.1 | 0.001 |
| Using deliveries or takeout with family | n = 2,762 | n = 2,613 | n = 2,692 | 0.063 |
| Yes | 1,758 (67.9) | 1,600 (64.0) | 1,717 (62.3) | |
| Frequency of deliveries/takeout with family | n = 1,758 | n = 1,600 | n = 1,717 | 0.444 |
| ≥ 1 time/week | 452 (28.6) | 396 (28.0) | 498 (29.0) | |
| 1 time/2 weeks | 558 (33.5) | 498 (32.3) | 598 (37.5) | |
| ≤ 1 time/month | 748 (37.8) | 706 (39.5) | 621 (33.5) | |
| Deliveries/takeout food expenditure with family (thousand won/month)2)3) | 47,929.1 ± 1,008.6a | 52,152.6 ± 51,007.1b | 56,267.8 ± 10,994.7c | < 0.001 |
Mean ± SE or n (%)
P-values by chi-square or ANOVA test
1)Chi-square tests compared categorical variables across survey years (2018-2019, 2019-2020, 2018-2020); significant differences (P < 0.05) are indicated by different lowercase letters in the same row.
2)Bonferroni tests compared continuous variables across 2018-2020 survey years; significant differences (P < 0.05) are indicated by different lowercase letters in the same row.
3)Adjusted for age, sex, education level, and household income
Table 5.Changes in the frequency of breakfast and use of nutrition labeling when purchasing processed foods before and after COVID-19, according to the area from the Korea Community Health Survey
| Variables | 2018 (n = 228,340) | 2019 (n = 229,099) | 2020 (n = 229,269) | P-value1)2) |
|---|---|---|---|---|
| Frequency of breakfast (times/week) | ||||
| Seoul metropolitan area (n = 220,486) | 5.01 ± 0.01Aa | 3.89 ± 0.01Ab | 3.76 ± 0.01Ac | < 0.001 |
| Metropolitan cities (n = 109,331) | 5.23 ± 0.01Ba | 4.12 ± 0.01Bb | 3.96 ± 0.01Bc | < 0.001 |
| Provinces (n = 356,828) | 5.60 ± 0.01Ca | 4.54 ± 0.01Cb | 4.44 ± 0.01Cc | < 0.001 |
| P-value2)3) | < 0.001 | < 0.001 | < 0.001 | |
| Use of nutrition labels when purchasing processed foods (yes) | ||||
| Seoul metropolitan area (n = 220,486) | 14,655 (21.9)a | 17,088 (25.1)b | 17,761 (25.6)b | < 0.001 |
| Metropolitan cities (n = 109,331) | 7,076 (21.3)a | 8,053 (23.7)b | 8,284 (24.3)b | < 0.001 |
| Provinces (n = 356,828) | 14,716 (16.4)a | 18,461 (20.2)b | 19,251 (20.5)b | < 0.001 |
| P-value4) | < 0.001 | < 0.001 | < 0.001 | |
Mean ± SE or n (%)
P-values by chi-square or ANOVA test
1)Bonferroni tests compared continuous variables across 2018-2020 survey years; significant differences (P < 0.05) are indicated by different lowercase letters in the same row.
2)Adjusted for age, sex, education level, and household income
3)Bonferroni tests compared continuous variables across regions (Seoul metropolitan area, Metropolitan cities, Provinces); significant differences (P < 0.05) are indicated by different uppercase letters in the same column.
4)Chi-square tests compared categorical variables across survey years (2018-2019, 2019-2020, 2018-2020); significant differences (P < 0.05) are indicated by different lowercase letters in the same row.
- 1. World Health Organization. WHO COVID-19 Dashboard [internet]. World Health Organization; 2020 [cited 2022 Nov 24]. Available from: https://covid19.who.int
- 2. Kim JH, An JA, Min PK, Bitton A, Gawande A. How South Korea responded to the covid-19 outbreak in Daegu. NEJM Catalyst 2020; 1(4): 1-14.Article
- 3. Cucinotta D, Vanelli M. WHO declares COVID-19 a pandemic. Acta Biomed 2020; 91(1): 157-160.PubMedPMC
- 4. Liu J, Hao J, Sun Y, Shi Z. Network analysis of population flow among major cities and its influence on covid-19 transmission in China. Cities 2021; 112(1): 103-138.ArticlePubMedPMC
- 5. Lee JH, Park MS. Study on the major infection pathways and spread patterns of COVID-19 by region. Korea Research Institute for Human Settlements; 2021 Nov. Report No. WP 21-20.
- 6. Lee JH, Park MS, Lee SW. Spatiotemporal evolution and the diffusion pattern of COVID-19 in South Korea in three waves. Korea Spat Plan Rev 2021; 110: 43-62.
- 7. Cheng C, Barceló J, Hartnett AS, Kubinec R, Messerschmidt L. COVID-19 government response event dataset (CoronaNet v.1.0). Nat Hum Behav 2020; 4(7): 756-768.ArticlePubMedPDF
- 8. Curtis RG, Olds T, Ferguson T, Fraysse F, Dumuid D, Esterman A, et al. Changes in diet, activity, weight, and wellbeing of parents during COVID-19 lockdown. PLoS One 2021; 16(3): e0248008.ArticlePubMedPMC
- 9. Giacalone D, Frøst MB, Rodríguez-Pérez C. Reported changes in dietary habits during the COVID-19 lockdown in the Danish population: The Danish COVIDiet study. Front Nutr 2020; 7: 1-8.ArticlePubMedPMC
- 10. Clay LA, Rogus S. Food access worries, food assistance use, purchasing behavior, and food insecurity among New Yorkers during COVID-19. Front Nutr 2021; 8: 1-10.ArticlePubMedPMC
- 11. Rha JY, Lee BH, Nam YW, Yoon JH. COVID-19 and changes in Korean consumers' dietary attitudes and behaviors. Nutr Res Pract 2021; 15(S1): S94-S109.ArticlePubMedPMCLink
- 12. Kim MS, Jung BM. A study on the dietary and lifestyle changes of middle-aged women in the Gwangju area in the COVID-19 era. Korean J Community Nutr 2021; 26(4): 259-269.ArticleLink
- 13. Di Renzo L, Gualtieri P, Pivari F, Soldati L, Attinà A, Cinelli G, et al. Eating habits and lifestyle changes during COVID-19 lockdown: An Italian survey. J Transl Med 2020; 18(1): 1-15.PubMedPMC
- 14. Lee GB, Kim Y, Park S, Kim HC, Oh K. Obesity, hypertension, diabetes mellitus, and hypercholesterolemia in Korean adults before and during the COVID-19 pandemic: A special report of the 2020 Korea National Health and Nutrition Examination Survey. Epidemiol Health 2022; 44(1): e2022041.ArticlePubMedPMCPDF
- 15. Korea Disease Control and Prevention Agency. Statistics Information Report for the Korea Community Health Survey. Korea Disease Control and Prevention Agency; 2022 Mar. Report No. 117075.
- 16. Lee KI, Kim SH, Shin SY, Shim HH, Park IH. The Consumer Behavior Survey for Food 2021. Korea Rural Economic Institute; 2021 Dec Report No. E16-2021
- 17. Kim HC, Cho SMJ, Lee H, Lee HH, Baek J, Heo JE, et al. Korea hypertension fact sheet 2020: Analysis of nationwide population-based data. Clin Hypertens 2021; 27(1): 1-4.PubMedPMC
- 18. An JY, Seo ER, Lim KH, Shin JH, Kim JB. Standardization of the Korean version of screening tool for depression (Patient Health Questionnaire-9, PHQ-9). J Korean Soc Biol Ther Psychiatry 2013; 19(1): 47-56.
- 19. Kroenke K, Spitzer RL, Williams JB. The PHQ-9: Validity of a brief depression severity measure. J Gen Intern Med 2001; 16(9): 606-613.ArticlePubMedPMC
- 20. Kim YJ. The effect of the health status and the economic status on the mental health of the urban elderly and the rural elderly-with the focus on the comparison of the mediation model between the family life and the social life. J Rural Soc 2010; 20(1): 265-308.
- 21. Kim PH, Kim HS. Relationships between perceived stress, mental health, and social support in community residents. J Korean Public Health Nurs 2010; 24(2): 197-210.
- 22. Yun SJ, Jeong HR, Kim MH. A survey on the breakfast skipping rate of Korean adults relative to their lifestyle and breakfast skipping reasons and dietary behavior of breakfast skippers. Korean J Community Nutr 2010; 15(2): 191-205.
- 23. Chang SJ, Park JM, Kang JY. A study on the recognition of government policy and the change of dietary life after COVID-19: Focusing on economic, psychological, and physical effects. J Corp Innov 2022; 45(1): 3-31.
- 24. Kim SE. Can (emergency) disaster support funds and basic income be taxable? Tax Law 2020; 13(2): 99-129.
- 25. Hong MK. The impact of COVID 19 and the Korean stimulus payment on consumption spending. Mon Labor Rev 2020; 189: 21-38.
- 26. Ministry of the Interior and Safety. Government's Disaster Emergency Relief Funds, paid 14.235.7 trillion won to 22.16 million households nationwide [Internet]. Press Release. Ministry of the Interior and Safety; 2022 [cited 2022 Dec 22]. Available from: https://www.mois.go.kr
- 27. Kim SH, Moon DH, Ji JH. Emergency relief funds payment and the effect of food consumption under the COVID-19 situation. Korea Rural Economic Institute; 2020 Nov. Report No. 19.
- 28. Statistics Korea. Consumer Price Index by Product (By product characteristics: 2020=100) [internet]. KOSIS; 2022 [cited 2022 Dec 22]. Available from: https://kosis.kr
- 29. Kim YR. Changes in families due to the Covid-19 pandemic and policy recommendations. Korean Women's Development Institute; 2020 Jul. Report No. 60.
- 30. Korea Disease Control and Prevention Agency. Korea Health Statistics 2020: Korea National Health and Nutrition Examination Survey (KNHANES VIII-2). Korea Disease Control and Prevention Agency; 2022 Jan. Report No. 11-1351159-000027-10.
- 31. Yun SH, Oh KW. Dietary habits among Korean population. Public Health Wkly Rep 2022; 15(23): 1623-1632.
- 32. Ma X, Chen Q, Pu Y, Guo M, Jiang Z, Huang W, et al. Skipping breakfast is associated with overweight and obesity: A systematic review and meta-analysis. Obes Res Clin Pract 2020; 14(1): 1-8.ArticlePubMed
- 33. Bi H, Gan Y, Yang C, Chen Y, Tong X, Lu Z. Breakfast skipping and the risk of type 2 diabetes: A meta-analysis of observational studies. Public Health Nutr 2015; 18(16): 3013-3019.ArticlePubMedPMC
- 34. Rural Development Administration. How has our diet changed in the two years of COVID-19? [Internet]. Rural Development Administration; 2022 [cited 2022 24 Nov]. Available from: https://www.rda.go.kr
- 35. Lee YS, Park MS, Kim SH, Heo SY. In-depth analysis report on consumer attitudes survey towards processed food. Korea Rural Economic Institute; 2019 Dec. Report No. 11-1543000-002075-10.
- 36. Cecchini M, Warin L. Impact of food labeling systems on food choices and eating behaviours: A systematic review and meta-analysis of randomized studies: Impact of food labeling. Obes Rev 2016; 17(3): 201-210.PubMed
- 37. Kim SH, Shim HH. Analysis of changes in online delivery and retail application usage time before and after the outbreak of COVID-19. Korea Rural Economic Institute; 2021 Dec. Report No. 13.
- 38. Kim TH, Park Y, Myung J, Han E. Food price trends in South Korea through time series analysis. Public Health 2018; 165: 67-73.ArticlePubMed
- 39. Malik VS, Popkin BM, Bray GA, Després JP, Willett WC, Hu FB. Sugar-sweetened beverages and risk of metabolic syndrome and type 2 diabetes: A meta-analysis. Diabetes Care 2010; 33(11): 2477-2483.PubMedPMC
- 40. Pereira MA, Kartashov AI, Ebbeling CB, Van Horn L, Slattery ML, Jacobs DR Jr, et al. Fast-food habits, weight gain, and insulin resistance (the CARDIA study): A 15-year prospective analysis. Lancet 2005; 365(9453): 36-42.PubMed
- 41. Jeong HS, Park SY, Kim JH, Oh KW, Yim HW. Mental health of Korean adults before and during the COVID-19 pandemic: A special report of the 2020 Korea National Health and Nutrition Examination Survey. Epidemiol Health 2022; 44: 1-11.ArticlePubMedPMCPDF
- 42. Central Disaster and Safety Countermeasures Headquarters. Social distancing elevated to the second stage in Seoul and Gyeonggi Province from the 16th... PC Rooms also to be considered as High-Risk Facilities [internet]. Ministry of Culture, Sports and Tourism; 2020 [updated 2020 Aug 15; cited 2022 Nov 24]. Available from: https://www.korea.kr
- 43. Kim NY, Woo JM. Stress and depression. Stress 2006; 14(2): 85-89.
- 44. Sa HJ, Lee WS, Lee BG. Corona blue and leisure activities: Focusing on Korean case. J Internet Comput Serv 2021; 22(2): 109-121.
- 45. Van Winkle Z, Ferragina E, Recchi E. The unexpected decline in feelings of depression among adults ages 50 and older in 11 European countries amid the COVID-19 pandemic. Socius 2021; 7: 237802312110327.
- 46. Yuan RK, Zitting KM, Maskati L, Huang J. Increased sleep duration and delayed sleep timing during the COVID-19 pandemic. Sci Rep 2022; 12(1): 10937.ArticlePubMedPMCPDF
REFERENCES
Figure & Data
REFERENCES
Citations
Citations to this article as recorded by 
 Cite
CiteChanges in dietary habits and chronic diseases before and after COVID-19 by regions using data from the 2018-2020 Korea Community Health Survey and Consumer Behavior Survey for Foods: a cross-sectional study

Fig. 1. Changes in chronic diseases and mental health before and after COVID-19 from the Korea Community Health Survey
Fig. 1.
Changes in dietary habits and chronic diseases before and after COVID-19 by regions using data from the 2018-2020 Korea Community Health Survey and Consumer Behavior Survey for Foods: a cross-sectional study
| Variable | Seoul metropolitan area (n = 220,497) | Metropolitan cities (n = 109,333) | Provinces (n = 356,878) | P-value |
|---|---|---|---|---|
| Age (years) | 47.2 ± 0.1 | 48.3 ± 0.1 | 50.5 ± 0.1 | < 0.001 |
| Sex | ||||
| Men | 99,890 (49.4) | 49,205 (49.3) | 159,612 (50.1) | < 0.001 |
| Women | 120,607 (50.6) | 60,128 (50.7) | 197,266 (49.9) | |
| Education level | ||||
| ≤Middleschool | 49,999 (16.0) | 29,457 (21.0) | 167,280 (28.0) | < 0.001 |
| High school | 81,551 (37.5) | 38,581 (36.5) | 108,182 (37.5) | |
| College & university | 78,564 (40.8) | 37,693 (39.2) | 74,510 (31.5) | |
| Graduate school | 9,882 (5.2) | 3,528 (3.8) | 6,559 (2.7) | |
| Household income (10,000 won/month) | ||||
| ≤ 200 | 42,039 (15.4) | 28,047 (20.6) | 145,109 (27.0) | < 0.001 |
| 200-499 | 89,040 (41.2) | 47,643 (45.4) | 135,851 (43.4) | |
| ≥ 500 | 83,977 (43.5) | 32,525 (34.1) | 70,095 (29.6) | |
| High-risk alcohol consumption | 25,066 (14.2) | 11,856 (13.7) | 36,677 (15.3) | < 0.001 |
| Smoking | ||||
| None | 142,327 (62.6) | 70,686 (62.8) | 227,869 (60.8) | < 0.001 |
| Ex-smoker | 38,147 (17.5) | 19,241 (17.6) | 69,821 (18.8) | |
| Current smoker | 39,992 (19.9) | 19,400 (19.6) | 59,168 (20.4) | |
| Frequency of breakfast (times/week) | 4.2 ± 0.0 | 4.4 ± 0.0 | 4.5 ± 4.5 | < 0.001 |
| Use of nutrition label | 49,504 (24.2) | 23,413 (23.1) | 52,428 (19.0) | < 0.001 |
| Obesity (BMI ≥ 25 kg/m2) | 71,208 (32.6) | 33,866 (31.4) | 118,882 (34.5) | < 0.001 |
| Hypertension | 52,993 (19.9) | 25,022 (19.2) | 116,876 (23.2) | < 0.001 |
| Diabetes mellitus | 21,722 (8.1) | 10,946 (8.3) | 46,069 (9.5) | < 0.001 |
| High-risk subjective stress level | 57,183 (27.3) | 24,687 (23.5) | 72,888 (23.6) | < 0.001 |
| Major Depressive disorder | 7,763 (3.4) | 3,316 (2.7) | 11,482 (3.2) | < 0.001 |
| Sleep duration (hours/day) | 6.7 ± 0.0 | 6.7 ± 0.0 | 6.8 ± 0.0 | < 0.001 |
| Variables | Seoul metropolitan area (n = 5,748) | Metropolitan cities (n = 5,294) | Provinces (n = 8,067) | P-value |
|---|---|---|---|---|
| Age (years) | 45.4 ± 0.5 | 45.0 ± 0.5 | 48.2 ± 0.6 | < 0.001 |
| Sex | 0.017 | |||
| Men | 2,637 (50.2) | 2,421 (51.8) | 3,516 (48.2) | |
| Women | 3,111 (49.8) | 2,873 (48.2) | 4,551 (51.8) | |
| Education level | < 0.001 | |||
| ≤Middleschool | 414 (7.4) | 606 (11.9) | 1,778 (22.1) | |
| High school | 2,640 (41.4) | 2,588 (44.9) | 3,456 (39.5) | |
| College & university | 2,666 (50.6) | 2,051 (42.4) | 2,783 (37.6) | |
| Graduate school | 28 (0.6) | 49 (0.8) | 50 (0.8) | |
| Household income (10,000 won/month) | < 0.001 | |||
| ≤ 200 | 102 (1.8) | 226 (4.5) | 606 (7.9) | |
| 200-499 | 3,134 (51.2) | 3,437 (63.6) | 5,611 (68.4) | |
| ≥ 500 | 2,512 (47.0) | 1,631 (31.9) | 1,850 (23.6) |
| Variables | Seoul metropolitan area |
P-value | ||
|---|---|---|---|---|
| 2018 (n = 2,011) | 2019 (n = 1,801) | 2020 (n = 1,936) | ||
| Eating-out |
n = 2,011 | n = 1,801 | n = 1,936 | < 0.001 |
| Yes | 1,851 (92.5)a | 1,675 (94.1)a | 1,635 (85.3)b | |
| Frequency of eating out | n = 1,851 | n = 1,675 | n = 1,635 | 0.088 |
| ≥ 1 time/week | 1,166 (66.8) | 1,130 (71.1) | 1,072 (70.4) | |
| 1 time/2 weeks | 375 (18.5) | 275 (16.4) | 297 (15.9) | |
| ≤ 1 time/month | 310 (14.6) | 270 (12.5) | 266 (13.8) | |
| Eating-out expenditure (thousand won/month) |
110,862.6 ± 1,853.3a | 119,238.9 ± 1,779.4b | 121,962.9 ± 1,874.3b | < 0.001 |
| Eating-out with family |
n = 2,011 | n = 1,801 | n = 1,936 | < 0.001 |
| Yes | 1,729 (87.4)a | 1,625 (92.3)b | 1,628 (83.7)a | |
| Frequency of eating out with family |
n = 1,729 | n = 1,625 | n = 1,628 | 0.024 |
| ≥ 1 time/week | 483 (32.0)a | 558 (25.2)ab | 628 (41.5)b | |
| 1 time/2 weeks | 673 (36.9) | 558 (36.7) | 575 (32.2) | |
| ≤ 1 time/month | 573 (31.1) | 509 (38.1) | 425 (26.3) | |
| Eating-out expenditure with family (thousand won/month) |
124,559.7 ± 1,767.4a | 124,599.0 ± 1,662.4a | 130,443.8 ± 1,750.4b | < 0.001 |
| Variables | Seoul metropolitan area |
P-value | ||
|---|---|---|---|---|
| 2018 (n = 2,011) | 2019 (n = 1,801) | 2020 (n = 1,936) | ||
| Using deliveries/takeout | n = 2,011 | n = 1,801 | n = 1,936 | 0.051 |
| Yes | 1,297 (64.3) | 1,058 (60.3) | 1,020 (56.6) | |
| Frequency of deliveries/take-outs |
n = 1,297 | n = 1,058 | n = 1,020 | < 0.001 |
| ≥ 1 time/week | 372 (30.5)a | 382 (40.0)b | 436 (44.4)b | |
| 1 time/2 weeks | 482 (36.1) | 393 (35.1) | 342 (34.1) | |
| ≤ 1 time/month | 443 (33.4) | 283 (24.9) | 242 (21.5) | |
| Deliveries/takeout food expenditure (thousand won/month) |
- | 55,695.6 ± 13,273.1 | 57,983.2 ± 9,475.6 | < 0.001 |
| Using deliveries or takeout with family | n = 2,011 | n = 1,801 | n = 1,936 | 0.565 |
| Yes | 1,619 (81.6) | 1,421 (82.0) | 1,543 (79.5) | |
| Frequency of deliveries/takeout with family |
n = 1,619 | n = 1,421 | n = 1,543 | < 0.001 |
| ≥ 1 time/week | 442 (31.4)a | 418 (31.6)a | 639 (44.1)b | |
| 1 time/2 weeks | 567 (33.6) | 572 (42.2) | 617 (39.4) | |
| ≤ 1 time/month | 610 (35.0) | 431 (26.3) | 287 (16.5) | |
| Deliveries/takeout food expenditure with family (thousand won/month) |
55,815.5 ± 1,042.6a | 54,407.5 ± 1,010.7a | 61,191.2 ± 1,025.7b | < 0.001 |
| Variables | 2018 (n = 228,340) | 2019 (n = 229,099) | 2020 (n = 229,269) | P-value |
|---|---|---|---|---|
| Frequency of breakfast (times/week) | ||||
| Seoul metropolitan area (n = 220,486) | 5.01 ± 0.01Aa | 3.89 ± 0.01Ab | 3.76 ± 0.01Ac | < 0.001 |
| Metropolitan cities (n = 109,331) | 5.23 ± 0.01Ba | 4.12 ± 0.01Bb | 3.96 ± 0.01Bc | < 0.001 |
| Provinces (n = 356,828) | 5.60 ± 0.01Ca | 4.54 ± 0.01Cb | 4.44 ± 0.01Cc | < 0.001 |
| P-value |
< 0.001 | < 0.001 | < 0.001 | |
| Use of nutrition labels when purchasing processed foods (yes) | ||||
| Seoul metropolitan area (n = 220,486) | 14,655 (21.9)a | 17,088 (25.1)b | 17,761 (25.6)b | < 0.001 |
| Metropolitan cities (n = 109,331) | 7,076 (21.3)a | 8,053 (23.7)b | 8,284 (24.3)b | < 0.001 |
| Provinces (n = 356,828) | 14,716 (16.4)a | 18,461 (20.2)b | 19,251 (20.5)b | < 0.001 |
| P-value |
< 0.001 | < 0.001 | < 0.001 | |
Table 1. General characteristics of the participants from the Korea Community Health Survey
Mean ± SE or n (%)
Table 2. General characteristics of the participants from the Consumer Behavior Survey for Foods
Mean ± SE or n (%)
Table 3. Changes in eating-out behaviors before and after COVID-19 according to the area from the Consumer Behavior Survey for Foods
Mean ± SE or n (%) Chi-square tests compared categorical variables across survey years (2018-2019, 2019-2020, 2018-2020); significant differences ( Bonferroni tests compared continuous variables across 2018-2020 survey years; significant differences ( Adjusted for age, sex, education level, and household income
Table 4. Changes in the deliveries/takeout before and after COVID-19 by area from the Consumer Behavior Survey for Foods
Mean ± SE or n (%) Chi-square tests compared categorical variables across survey years (2018-2019, 2019-2020, 2018-2020); significant differences ( Bonferroni tests compared continuous variables across 2018-2020 survey years; significant differences ( Adjusted for age, sex, education level, and household income
Table 5. Changes in the frequency of breakfast and use of nutrition labeling when purchasing processed foods before and after COVID-19, according to the area from the Korea Community Health Survey
Mean ± SE or n (%) Bonferroni tests compared continuous variables across 2018-2020 survey years; significant differences ( Adjusted for age, sex, education level, and household income Bonferroni tests compared continuous variables across regions (Seoul metropolitan area, Metropolitan cities, Provinces); significant differences ( Chi-square tests compared categorical variables across survey years (2018-2019, 2019-2020, 2018-2020); significant differences (


