
Articles
- Page Path
- HOME > Korean J Community Nutr > Volume 24(3); 2019 > Article
-
Research Article
- Evaluation of the Nutrition Status and Metabolic Syndrome Prevalence of the Members according to the Number of Household Members based on the Korea National Health and Nutrition Examination Survey (2013–2014)
-
Jin-Young Lee
 , Soo-Kyong Choi, Jung-Sook Seo
 -
Korean Journal of Community Nutrition 2019;24(3):232-244.
DOI: https://doi.org/10.5720/kjcn.2019.24.3.232
Published online: June 30, 2019
1Department of Food and Nutrition, Yeungnam University, Gyeongsan, Korea, Student.
2Daegu Dong-gu Center for Children's Foodservice Management, Daegu, Korea, Nutrition team leader.
3Department of Food and Nutrition, Yeungnam University, Gyeongsan, Korea, Professor.
- Corresponding author: Jung-Sook Seo. Department of Food & Nutrition, Yeungnam University Gyeongsan 38573, Korea. Tel: (053) 810-2875, Fax: (053) 810-4768, jsseo@ynu.ac.kr
• Received: June 5, 2019 • Revised: June 25, 2019 • Accepted: June 25, 2019
Copyright © 2019 The Korean Society of Community Nutrition
This is an Open-Access article distributed under the terms of the Creative Commons Attribution Non-Commercial License (http://creativecommons.org/licenses/by-nc/3.0/) which permits unrestricted non-commercial use, distribution, and reproduction in any medium, provided the original work is properly cited.
- 3,811 Views
- 10 Download
- 16 Crossref
Abstract
-
Objectives
- This study evaluated the nutritional status and prevalence of metabolic syndrome of the people who participated in the KNHANES according to the number of household members. They were assessed by using information from the 2013~2014 Korea National Health and Nutrition Examination Survey (KNHANES).
-
Methods
- A total of 6,088 persons aged 19 years and over participated in 2013~2014 KNHANES, and they were classified into three groups according to the number of household members (single-person, two-person, three-person & over). The dietary behavior, nutritional status, health-related factors and the prevalence of metabolic syndrome of the subjects were investigated with using information from the survey questionnaires of KNHANES. The nutrient intake data of the subjects were obtained by the 24-hour recall method and this was analyzed for evaluating the nutrition adequacy ratio and the index of nutritional quality. The prevalence of metabolic syndrome among the subjects, and according to the study groups, was estimated using the blood and physical measurement data of the subjects.
-
Results
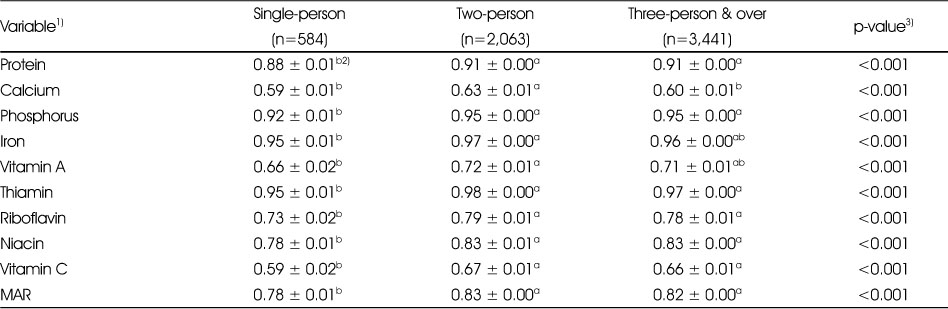
- As for EQ-5D index available for all the health states generated by the EQ-5D descriptive system, the single-person household member was the lowest among all the household types. The index of nutrition quality for protein, crude fiber, calcium, phosphorus, potassium, riboflavin and vitamin C in the single-person household was lower than that of the two-person or the three-person and over households (p<0.001). The mean adequacy ratio of single-person households was significantly decreased compared with that of the other types of households (p<0.001). The prevalence of metabolic syndrome was higher in the single-person households than that in the multiple-person households (p<0.001).
-
Conclusions
- These results showed that dietary behaviors, nutrition status and health status might be influenced by the number of household members. The results from this study would be useful for improving Korean people's dietary life and health status by implementing evidence-based, specialized intervention for the members of diverse types of households.
- 1. Jung KH, Nam SH, Jeong EJ, Lee JH, Lee YK, Kim JS, et al. Policy implications of changes in family structure: focused on the increase of single person households in Korea. Institute for Health and Social Affairs; 2012 12. Dec. Report No. 978-89-8187-905-1 93330.
- 2. Tsubota-Utsugi M, Kikuya M, Satoh M, Inoue R, Hosaka M, Metoki H. Living situations associated with poor dietary intake among healthy Japanese elderly: The Ohasama study. J Nutr Health Aging 2015; 19(4): 375-382.ArticlePubMedPMCPDF
- 3. Statistics Korea. Age of householder/Estimating households [internet]. Statistics Korea; 2018; cited 2019 Apr 20]. Available from: http://kosis.kr/statHtml/statHtml.do?orgId=101&tblId=DT_1BZ0506&vw_cd=MT_ZTITLE&list_id=A42_20&scrId=&seqNo=&lang_mode=ko&obj_var_id=&itm_id=&conn_path=K1&path.
- 4. Ha JK, Lee SL. The effect of health-related habitual consumption and lifetime on subjective health of one person households: Focusing on comparison between non-one person households and generations. Fam Environ Res 2017; 55(2): 141-152.Article
- 5. Kim YJ. Comparison of health practices between single- and multiple-member households by gender in Korean adults. J Korean Acad Public Health Nurs 2009; 23(2): 219-231.
- 6. Heo YK, Sim KH. Dietary attitude of single households in metropolitan areas. Korean J Food Nutr 2016; 29(5): 735-745.Article
- 7. Song YJ, Paik HY, Joung HJ. A comparison of cluster and factor analysis to derive dietary patterns in Korean adults using data from the 2005 Korea National Health and Nutrition Examination Survey. Korean J Community Nutr 2009; 14(6): 722-733.
- 8. Yang J, Sohn CM. Nutritional status and dietary quality by their residing types in college students. J Korean Living Sci Assoc 2009; 18(4): 959-970.Article
- 9. Kim HS, Chung CE. A study on the eating out behavior of university students in Seoul. Korean J Diet Cult 2001; 16(2): 147-157.
- 10. Kim C, Park YS. Comparing health-related behaviors, food behaviors, and the nutrient adequacy ratio of rural elderly by single-elderly families vs. extended families. Korean J Community Nutr 2000; 5(Suppl): 307-315.
- 11. Stoller EP. Parental caregiving by adult children. J Marriage Fam 1983; 45(4): 851-858.Article
- 12. Kim A. Effect of health behaviors, dietary habits, and psychological health on metabolic syndrome in one-person households among Korean young adults. J Digit Converg 2018; 16(7): 493-509.
- 13. Choi MK, Kang MH, Kim MH. Diet and health status of elderly women according to the family type. Korean J Community Nutr 2016; 21(3): 256-264.ArticleLink
- 14. Lee YJ, Kwon MK, Baek HJ, Lee SS. Comparative analysis of food intake according to the family type of elderly women in Seoul area. J Nutr Health 2015; 48(3): 277-288.Article
- 15. Hong IO. Health related quality of life by smoking, drinking, exercise, obesity and sociodemographic variables using EQ-5D [master's thesis]. Sahmyook University; 2011.
- 16. Hansen RG. An index of food quality. Nutr Rev 1973; 31(1): 1-7.ArticlePubMed
- 17. Grundy SM, Cleeman JL, Daniels SR, Donato KA, Eckel RH, Franklin BA. Diagnosis and management of the metabolic syndrome: An American Heart Association/ National Heart, Lung, and Blood Institute scientific statement. Circulation 2005; 112(17): 2735-2752.ArticlePubMed
- 18. Korean Society for the Study of Obesity. Guideline for the treatment of obesity 2009. Seoul: Korean Society for the Study of Obesity; 2009. p. 51-54.
- 19. Lee YH, Choi JS, Rhee JA, Ryu SY, Shin MH, Kim JH. A study on the application of the Korean valuation weights for EuroQoL-5 dimension. J Korean Soc Health Educ Promot 2009; 26(1): 1-13.
- 20. Gibson RS. Principles of nutritional assessment. 2th ed. New York: Oxford university press; 2005. p. 809-821.
- 21. Guthrie HA, Scheer JC. Validity of a dietary score for assessing nutrient adequacy. J Am Diet Assoc 1981; 78(3): 240-245.ArticlePubMed
- 22. Statistics Korea. Household Projections: 2015~2045 [internet]. Statistics Korea; 2017; updated 2017 Apr 13]. cited 2019 Apr 21]. Available from: http://kostat.go.kr/portal/korea/kor_nw/3/index.board?bmode=download&bSeq=&aSeq=359964&ord=3.
- 23. Statistics Korea. 2018 Elderly person statistics [internet]. Statistics Korea; 2018; updated 2018 Sep 27]. cited 2019 Apr 25]. Available from: http://kostat.go.kr/portal/korea/kor_nw/1/1/index.board?bmode=download&bSeq=&aSeq=370779&ord=1.
- 24. Lee KI, Hwang YJ, Ban HJ, Lim SJ. Impact of the growth of single-person households on the food market and policy tasks. Korea Rural Economic Institute; 2015 10. Report No. TRKO201600001479.
- 25. Jo PK. The effect of the economic characteristics of singleperson households on the food service industry. Korean J Community Nutr 2016; 21(4): 321-331.ArticleLink
- 26. Kim MH, Kim H, Lee WK, Kim SJ, Yeon JY. Food habits and dietary behavior related to using processed food among male college students residing in dormitory and self-boarding in Gangwon. Korean J Community Nutr 2013; 18(4): 372-385.Article
- 27. Nam SY. Differences in dietary, nutritional and health status between single-person households and non-single-person households in Korean adults by sex and age group [Dissertation]. Inha University; 2016.
- 28. Kang NY, Jung BM. Analysis of the difference in nutrients intake, dietary behaviors and food intake frequency of singleand non single-person households: The Korea National Health and Nutrition Examination Survey (KNHANES), 2014–2016. Korean J Community Nutr 2019; 24(1): 1-17.ArticleLink
- 29. Lee J, Shin A. Vegetable and fruit intake in one person household: The Korean national health and nutrition examination survey (2010~2012). J Nutr Health 2015; 48(3): 269-276.Article
- 30. Lee S. The effect of household demographic trend on food expenditure pattern. Consumption Cult Study 2014; 17(3): 85-104.Article
- 31. Choi BB. Recognition and consumption of meal alone and processed food according to major of college students. Korean J Food Nutr 2016; 29(6): 911-922.Article
- 32. Lee Y, Oh YJ, Cho W, Jo PK. Differences in solo eating perceptions and dietary behaviors of university students by gender. J Korean Diet Assoc 2015; 21(1): 57-71.Article
- 33. Kral JG, Buckley MC, Kissileff HR, Schaffiner F. Metabolic correlates of eating behavior in severe obesity. Int J Obes Relat Metab Disord 2001; 25(2): 258-264.ArticlePubMedPDF
- 34. Jun SC, Kim YJ, Kim YS, Kim SK, Kim DG, Chang UJ. The relationships of chewing frequency, eating rates, and food consumption with the body mass index and gender of college students. J Korean Diet Assoc 2013; 19(2): 103-111.Article
- 35. Bae YJ, Lee JC, Kim MH. Nutritional status and dietary quality of college students by residing types in Samcheok. J Korean Diet Assoc 2007; 13(4): 311-330.
- 36. Yi YH, Kim YJ, Cho DY. Family type and health behaviors in elderly: Korea National Health and Nutrition Examination Survey (KNHANES), 2010-2012. Korean J Health Serv Manag 2014; 8(4): 199-207.
- 37. Kim YS. The study of the impact of the family type on the health promoting behavior and physical and mental health of elderly people. Health Soc Welf Rev 2014; 34(3): 400-429.Article
- 38. Song EG, Yoon YS, Yang YJ, Lee ES, Lee JH, Lee JY. Factors associated with eating alone in Korean adults: findings from the sixth Korea National Health and Nutrition Examination Survey, 2014. Korean J Fam Pract 2017; 7(5): 698-706.Article
- 39. Umberson D. Family status and health behaviors: social control as a dimension of social integration. J Health Soc Behav 1987; 28(3): 306-319.ArticlePubMed
- 40. Umberson D. Gender, marital status and the social control of health behavior. Soc Sci Med 1992; 34(8): 907-917.ArticlePubMed
- 41. Azadbakht L, Akbari F, Esmaillzadeh A. Diet quality among Iranian adolescents needs improvement. Public Health Nutr 2015; 18(4): 615-621.ArticlePubMed
- 42. Park JK, Son SM. The dietary behaviors, depression rates and nutrient intakes of the elderly females living alone. Korean J Community Nutr 2003; 8(5): 716-725.
- 43. Lim YJ, Choi YS. Dietary behaviors and seasonal diversity of food intakes of elderly women living alone as compared to those living with family in Gyeongbuk rural area. Korean J Community Nutr 2008; 13(5): 620-629.
- 44. Shin SK, Kim HJ, Choi BY, Lee SS. A comparison of food frequency for the elderly regarding different family types: Based on community health survey for 2008. Korean J Nutr 2012; 45(3): 264-273.Article
- 45. Yim KS, Lee TY. Sociodemographic factors associated with nutrients intake of elderly in Korea. Korean J Nutr 2004; 37(3): 210-222.
- 46. Son HK. Analysis of solo economy [internet]. Statistical Research Institute; 2017; updated 2017]. cited 2019 May 20]. Available from: http://kostat.go.kr/edu/sri_kor_new/1/4/index.board?bmode=read&bSeq=&aSeq=370209&pageNo=7&rowNum=10&navCount=10&currPg=&searchInfo=&sTarget=title&sTxt=.
- 47. An BM, Son JH. Analysis of metabolic syndrome in Korean adult one-person households. J Korean Public Health Nurs 2018; 32(1): 30-43.
REFERENCES

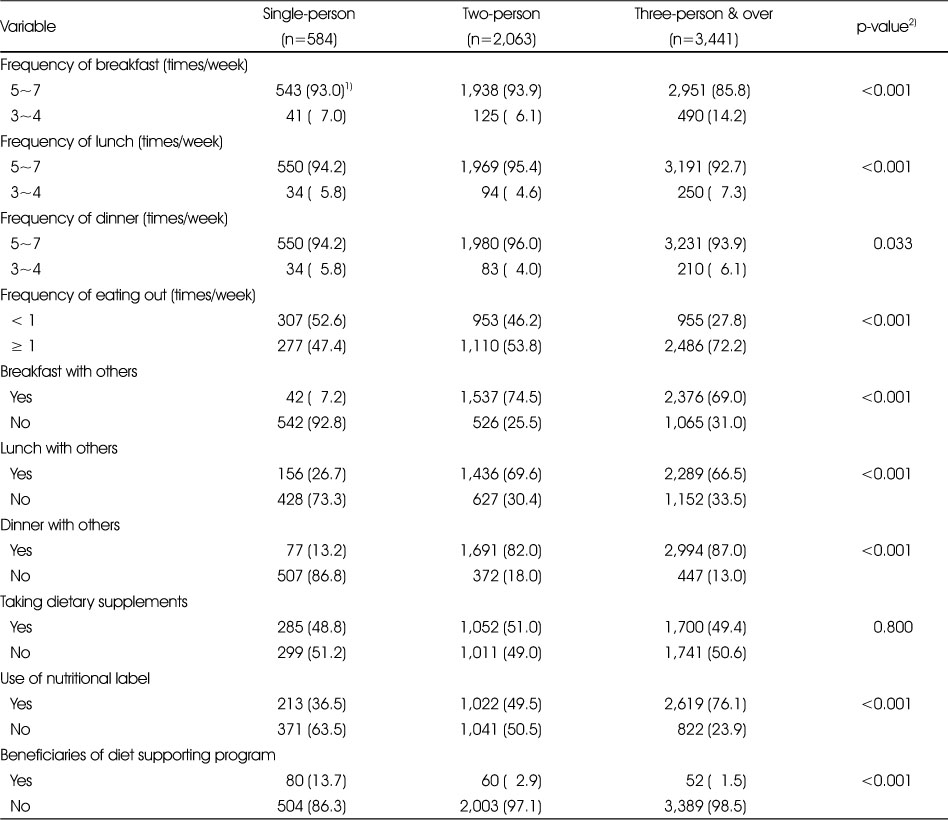


Table 5
Nutrient adequacy ratio and mean adequacy ratio of the subjects according to the number of household members

Figure & Data
REFERENCES
Citations
Citations to this article as recorded by 
- Dietary Behaviors and Health Status by Income Level in Single-Adult Households in Korea: An Analysis of Data From the 2016-2018 Korea National Health and Nutrition Examination Survey
Min-Hee Han, Bok-Mi Jung, Mi-Kyeong Choi
Clinical Nutrition Research.2025; 14(1): 55. CrossRef - Understanding the charactersitics and types of single-person households based on food purchase frequencies in Korea: a cross-sectional study using the 2023 Consumer Behavior Survey for Foods
So-Yun Kim, Youngmin Nam, Jong-Youn Rha, Haerang Lee
Korean Journal of Community Nutrition.2025; 30(1): 27. CrossRef - Beyond individual integration: Family systems, social support networks and living environment as health determinants among migrants in Germany
Franziska Reinhardt, Imad Maatouk
Journal of Migration and Health.2025; 12: 100368. CrossRef - Comparison of Food and Nutrient Intake according to the Income Level in Korean Adult Single-Person Households: Using Data from the Korea National Health and Nutrition Examination Survey (2016-2018)
Min-Hee Han, Bok-Mi Jung
The Korean Journal of Community Living Science.2024; 35(3): 445. CrossRef - Higher Animal-Based Protein Intake Levels Show a Greater Likelihood of Having Metabolic Syndrome in Single-Person Households Among Korean Adults
Yeongin Lee, Hyojee Joung
Nutrients.2024; 16(23): 4239. CrossRef - The association of the Korean Healthy Eating Index with chronic conditions in middle-aged single-person households
EunJung Lee, Ji-Myung Kim
Nutrition Research and Practice.2023; 17(2): 316. CrossRef - Analysis of Agrifood Consumer Competency and Dietary Satisfaction according to Household Type Using the Consumer Behavior Survey for Food
Meera Kim
Journal of the Korean Society of Food Science and Nutrition.2023; 52(4): 414. CrossRef - An analysis of customer needs for the operation of unmanned food stores on a university campus
Se-Eun Kim, Min-Seo Park, Hyun-Joo Bae
Journal of Nutrition and Health.2022; 55(5): 587. CrossRef - Assessment of Nutrient Intake and Dietary Quality of Korean Adults in Metabolic Syndrome Patients According to Taking Medical Care: Based on the 2017 Korea National Health and Nutrition Examination Survey
Juhee Lee, Kyungsuk Choi
Korean Journal of Community Nutrition.2022; 27(4): 321. CrossRef - Relationships of Dietary Factors with Obesity, Hypertension, and Diabetes by Regional Type among Single-Person Households in Korea
Kyung Won Lee, Dayeon Shin
Nutrients.2021; 13(4): 1218. CrossRef - Living Environment Considerations on Obesity Prevention Behaviors and Self-Efficacy among Chinese Americans
Doreen Liou, Jessica A. Karasik
International Journal of Environmental Research and Public Health.2021; 18(17): 9322. CrossRef - The Relationship between Meal Regularity and Oral Health and Metabolic Syndrome of Adults in Single Korean Households
Jin-Ah Jung, Hye-Won Cheon, On-Ju Ju
Journal of Dental Hygiene Science.2021; 21(3): 185. CrossRef - Association of Household Income Level with Vitamin and Mineral Intake
Haegyu Oh, Juyeon Kim, Yune Huh, Seung Hoon Kim, Sung-In Jang
Nutrients.2021; 14(1): 38. CrossRef - Nutritional status and metabolic syndrome risk according to the dietary pattern of adult single-person household, based on the Korea National Health and Nutrition Examination Survey
Yu Been Keum, Qi Ming Yu, Jung-Sook Seo
Journal of Nutrition and Health.2021; 54(1): 23. CrossRef - Home Meal Replacement Use and Eating Habits of Adults in One-Person Households
Mi-Kyeong Choi, Eun-Sun Park, Mi-Hyun Kim
Korean Journal of Community Nutrition.2019; 24(6): 476. CrossRef - Comparison of Dietary Behavior of Eating Alone in Single Households by Status of Workers and Age
Pil Kyoo Jo, Yu Jin Oh
Korean Journal of Community Nutrition.2019; 24(5): 408. CrossRef
 Cite
Cite- We recommend
- Related articles
-
- Changing patterns and related factors of kimchi consumption among Korean adults: a nationwide cross-sectional analysis of the Korea National Health and Nutrition Examination Survey, 2010–2024
- Comparison of dietary behaviors and nutrient intake by gender and household type among older Koreans: a cross-sectional study using data from the 8th Korea National Health and Nutrition Examination Survey
- Ultra-processed food intake and dietary behaviors in Korean adolescents: a cross-sectional study based on the 2019–2023 Korea National Health and Nutrition Examination Survey
- Self-reported weight change and diet quality in relation to metabolic syndrome among Korean cancer survivors: a cross-sectional study using the Korea National Health and Nutrition Examination Survey 2019–2021
- Analysis of the relationship between sugar intake and cancer prevalence: a cross-sectional study using the 8th Korea National Health and Nutrition Examination Survey
Evaluation of the Nutrition Status and Metabolic Syndrome Prevalence of the Members according to the Number of Household Members based on the Korea National Health and Nutrition Examination Survey (2013–2014)
Evaluation of the Nutrition Status and Metabolic Syndrome Prevalence of the Members according to the Number of Household Members based on the Korea National Health and Nutrition Examination Survey (2013–2014)
General characteristics of the subjects according to the number of household members
1) n (%)
2) p-Values are from chi-square test.
Dietary behaviors of the subjects according to the number of household members
1) n (%)
2) p-Values are from chi-square test.
Health-related factors of the subjects according to the number of household members
1) n (%)
2) p-Values are from chi-square test.
3) p-Values are from ANOVA test.
Index of nutrition quality of the subjects according to the number of household members
1) Values were adjusted for age and gender.
2) Mean ± SD
3) p-Values are from ANOVA test.
4) Mean of INQ
Nutrient adequacy ratio and mean adequacy ratio of the subjects according to the number of household members
1) Values were adjusted for age and gender.
2) Mean ± SD
3) p-Values are from ANOVA test.
Distribution of metabolic syndrome risk factors and metabolic syndrome prevalence of the subjects according to the number of household members
1) Values were adjusted for age and gender.
2) p-Values are from chi-square test.
3) WC: waist circumference
4) cut-off point in male
5) cut-off point in female
6) SBP: systolic blood pressure
7) DBP: diastolic blood pressure
Table 1
General characteristics of the subjects according to the number of household members
1) n (%) 2) p-Values are from chi-square test.
Table 2
Dietary behaviors of the subjects according to the number of household members
1) n (%) 2) p-Values are from chi-square test.
Table 3
Health-related factors of the subjects according to the number of household members
1) n (%) 2) p-Values are from chi-square test. 3) p-Values are from ANOVA test.
Table 4
Index of nutrition quality of the subjects according to the number of household members
1) Values were adjusted for age and gender. 2) Mean ± SD 3) p-Values are from ANOVA test. 4) Mean of INQ
Table 5
Nutrient adequacy ratio and mean adequacy ratio of the subjects according to the number of household members
1) Values were adjusted for age and gender. 2) Mean ± SD 3) p-Values are from ANOVA test.
Table 6
Distribution of metabolic syndrome risk factors and metabolic syndrome prevalence of the subjects according to the number of household members
1) Values were adjusted for age and gender. 2) p-Values are from chi-square test. 3) WC: waist circumference 4) cut-off point in male 5) cut-off point in female 6) SBP: systolic blood pressure 7) DBP: diastolic blood pressure


