
Articles
- Page Path
- HOME > Korean J Community Nutr > Volume 28(4); 2023 > Article
-
Research Article
가구소득 및 인구학적 특성에 따른 코로나19 유행 전·후 한국 노인의 영양소 섭취변화에 대한 단면연구: 국민건강영양조사 제8기(2019-2020) 자료를 활용하여 -
이유신1)
 , 이윤나2),†
 - Changes in nutritional status of Korean older adults during COVID-19 Pandemic by household income and demographic factors -using the Korea National Health and Nutrition Examination Survey(2019-2020): a cross-sectional study
-
You-Sin Lee1), Yoonna Lee2),†
-
Korean Journal of Community Nutrition 2023;28(4):302-316.
DOI: https://doi.org/10.5720/kjcn.2023.28.4.302
Published online: August 31, 2023
1)동국대학교 가정교육과, 겸임교수
2)신구대학교 식품영양학과, 교수
1)Adjunct Professor, Department of Home Economics Education, Dongguk University, Seoul, Korea
2)Associate Professor, Department of Food and Nutrition, Shingu College, Seongnam, Gyeonggi, Korea
- †Corresponding author Yoonna Lee Department of Food and Nutrition, Shingu College, Gwangmyeong-ro 377, Jungwon-gu, Seongnam, Gyeonggi-do, Korea Tel: +82-31-740-1528 Fax: +82-31-740-1590 Email: ynlee@shingu.ac.kr
• Received: June 11, 2023 • Revised: August 3, 2023 • Accepted: August 14, 2023
© 2023 The Korean Society of Community Nutrition
This is an Open-Access article distributed under the terms of the Creative Commons Attribution Non-Commercial License (http://creativecommons.org/licenses/by-nc/4.0) which permits unrestricted non-commercial use, distribution, and reproduction in any medium, provided the original work is properly cited.
- 2,907 Views
- 48 Download
- 4 Crossref
Abstract
-
Objectives
- The study aim was to identify changes in the nutritional status of older adults during the COVID-19 pandemic according to household income and demographic characteristics.
-
Methods
- Study participants were 2,408 adults aged 65 and over who participated in the 2019–2020 Korea National Health and Nutrition Examination Survey (KNHANES). To examine changes in nutrient intake levels resulting from COVID-19, data of 2019 and of 2020 were compared. Study participants were divided into three groups based on household income level to compare these changes. The changes were compared according to household income level, age group, and household type.
-
Results
- Percentages of recommended intakes for energy, protein, and most micronutrients were the lowest for the low-income group of both males and females in 2020. The Mean Adequacy Ratio (MAR) score was the lowest for the low-income group in both years. When comparing nutrient density for 2019 and 2020 by income group, the male low-income group experienced a decrease in nutrient densities of vitamin A, thiamine, calcium, and iron. For the same group, a decreased percentage for energy intake from protein was noted. Fruit intake was lowest in the low-income group for both males and females. Low-income males had the lowest intake levels for meat, fish, eggs, and legumes in both 2019 and 2020 and the lowest milk and milk product intake levels in 2020. Older adults living alone or single older adults with children had lower MAR scores than those living with a spouse. Older adults living alone experienced decreases in energy and thiamine and iron intake levels in 2020 compared to their intake levels in 2019.
-
Conclusions
- Because of the COVID-19 pandemic, nutrition intake levels worsened for older adult males in the low-income group and older adults living alone. This finding shows the need for a more systematic nutritional support strategy for the vulnerable older adults population in national disaster situations.
Introduction
Methods
1) 일반적 특성
2) 영양소 섭취상태
3) 식품군별 섭취 상태
Results
1) 영양섭취기준 대비 영양소 섭취비율과 MAR의 변화
2) 일일 에너지 섭취량과 영양소 밀도의 변화
3) 영양섭취기준 미만 섭취 대상자 비율의 변화
Discussion
Conclusion
-
Conflict of Interest
There are no financial or other issues that might lead to conflict of interest.
-
Funding
This research received no external funding.
-
Data Availability
The data that support the findings of this study are openly available in KNHANES at https://knhanes.kdca.go.kr/knhanes/sub03/sub03_02_05.do.
NOTES
Fig. 1.
Changes in the percentages of Korean older adults with nutrient intakes lower than the EAR during COVID-19 pandemic by income level. *P < 0.05, **P < 0.01 by χ2-test
EAR: Estimated Average Requirement

Table 1.Socio-demographic characteristics of study participants by sex and survey year
Table 2.Changes in nutrient intake (%RNI1)) of Korean older adults during COVID-19 pandemic by income level
| Characteristics |
Male (n = 1,054) |
|||||||||||||
|---|---|---|---|---|---|---|---|---|---|---|---|---|---|---|
|
Low income |
P-value2) |
Middle income |
P-value |
High income |
P-value |
Total |
P-value | 20193) P-value | 20204) P-value | |||||
| 2019 (n = 239) | 2020 (n = 165) | 2019 (n = 289) | 2020 (n = 247) | 2019 (n = 54) | 2020 (n = 60) | 2019 (n = 582) | 2020 (n = 472) | |||||||
| Energy | 86.00 ± 1.9a | 84.40 ± 2.9a | 0.660 | 94.80 ± 2.1b | 95.30 ± 2.5ab | 0.998 | 103.00 ± 5.5b | 92.30 ± 4.1b | 0.113 | 92.40 ± 1.5 | 91.30 ± 1.8 | 0.574 | 0.016 | 0.025 |
| Protein | 98.00 ± 3.2a | 90.20 ± 3.1a | 0.091 | 110.40 ± 3.4b | 110.50 ± 3.6b | 0.889 | 125.20 ± 6.9b | 114.80 ± 5.6b | 0.244 | 107.30 ± 2.6 | 104.50 ± 2.4 | 0.333 | 0.029 | < 0.001 |
| Vitamin A | 47.90 ± 4.4 | 35.30 ± 2.5a | 0.016 | 56.50 ± 7.4 | 55.10 ± 3.2b | 0.823 | 51.80 ± 4.7 | 54.90 ± 5.4b | 0.665 | 52.70 ± 4.1 | 48.60 ± 2.0 | 0.338 | 0.720 | < 0.001 |
| Vitamin C | 53.90 ± 4.3 | 48.10 ± 5.2 | 0.420 | 66.60 ± 4.9 | 64.90 ± 5.2 | 0.792 | 62.40 ± 8.3 | 69.80 ± 7.8 | 0.535 | 61.30 ± 3.1 | 60.10 ± 3.5 | 0.762 | 0.213 | 0.076 |
| Thiamin | 113.20 ± 3.6 | 101.00 ± 4.3 | 0.033 | 121.10 ± 4.0 | 109.70 ± 3.5 | 0.022 | 121.90 ± 10.1 | 114.30 ± 6.6 | 0.527 | 118.20 ± 2.9 | 107.50 ± 2.4 | 0.003 | 0.698 | 0.277 |
| Riboflavin | 90.50 ± 4.0a | 90.20 ± 4.4a | 0.969 | 108.50 ± 3.8b | 112.80 ± 4.5b | 0.516 | 123.00 ± 7.5b | 114.70 ± 8.3b | 0.454 | 103.30 ± 3.0 | 105.70 ± 3.2 | 0.653 | 0.005 | < 0.001 |
| Niacin | 79.90 ± 3.1 | 74.10 ± 3.4 | 0.202 | 89.30 ± 2.8 | 86.40 ± 2.7 | 0.396 | 87.20 ± 5.4 | 84.40 ± 4.5 | 0.694 | 85.50 ± 1.9 | 82.10 ± 2.0 | 0.202 | 0.124 | 0.050 |
| Calcium | 71.30 ± 3.7 | 59.20 ± 3.2a | 0.015 | 77.30 ± 3.1 | 74.60 ± 2.7b | 0.447 | 84.50 ± 5.0 | 79.20 ± 4.1b | 0.421 | 75.90 ± 2.5 | 70.20 ± 2.1 | 0.067 | 0.572 | < 0.001 |
| Phosphorus | 132.70 ± 4.3a | 124.00 ± 4.6a | 0.179 | 151.40 ± 3.9b | 149.50 ± 3.9b | 0.627 | 166.20 ± 8.1b | 157.10 ± 6.9b | 0.390 | 146.00 ± 3.1 | 142.30 ± 2.9 | 0.300 | 0.006 | < 0.001 |
| Iron | 126.50 ± 5.3 | 111.00 ± 5.7a | 0.051 | 145.50 ± 5.6 | 135.90 ± 6.5b | 0.202 | 145.30 ± 7.8 | 142.00 ± 8.1b | 0.771 | 138.30 ± 3.6 | 128.60 ± 4.1 | 0.058 | 0.144 | 0.011 |
| MAR | 0.71 ± 0.01a | 0.67 ± 0.01a | 0.123 | 0.76 ± 0.01b | 0.77 ± 0.01b | 0.580 | 0.80 ± 0.01b | 0.79 ± 0.01b | 0.648 | 0.74 ± 0.01 | 0.74 ± 0.01 | 0.716 | 0.002 | < 0.001 |
| Characteristics |
Female (n = 1,354) |
|||||||||||||
|
Low income |
P-value |
Middle income |
P-value |
High income |
P-value |
Total |
P-value | 2019 P-value | 2020 P-value | |||||
| 2019 (n = 397) | 2020 (n = 262) | 2019 (n = 323) | 2020 (n = 262) | 2019 (n = 55) | 2020 (n = 55) | 2019 (n = 775) | 2020 (n = 579) | |||||||
| Energy | 85.80 ± 1.9 | 82.60 ± 52.3a | 0.261 | 89.30 ± 1.7 | 92.70 ± 2.7b | 0.324 | 91.80 ± 3.8 | 103.10 ± 4.4b | 0.060 | 87.70 ± 1.3 | 89.40 ± 1.7 | 0.546 | 0.442 | 0.002 |
| Protein | 89.00 ± 2.4 | 85.20 ± 3.5a | 0.267 | 95.90 ± 2.5 | 103.90 ± 3.7b | 0.104 | 95.00 ± 5.1 | 117.80 ± 5.5b | 0.003 | 92.30 ± 1.7 | 97.30 ± 2.5 | 0.229 | 0.563 | < 0.001 |
| Vitamin A | 47.60 ± 3.0 | 44.40 ± 4.3 | 0.442 | 53.30 ± 4.3 | 59.10 ± 3.6 | 0.383 | 43.70 ± 4.3 | 60.70 ± 6.0 | 0.024 | 49.70 ± 2.5 | 52.90 ± 2.5 | 0.549 | 0.163 | 0.119 |
| Vitamin C | 52.60 ± 3.1 | 51.60 ± 5.1 | 0.716 | 72.30 ± 6.8 | 70.90 ± 5.6 | 0.768 | 67.30 ± 9.0 | 78.30 ± 8.3 | 0.381 | 61.90 ± 3.6 | 63.30 ± 3.3 | 0.936 | 0.057 | 0.062 |
| Thiamin | 109.70 ± 2.7 | 104.10 ± 4.0 | 0.315 | 107.60 ± 2.6 | 109.70 ± 4.1 | 0.613 | 98.20 ± 4.9 | 120.40 ± 7.0 | 0.007 | 108.00 ± 1.9 | 108.40 ± 2.6 | 0.732 | 0.208 | 0.073 |
| Riboflavin | 92.60 ± 3.5 | 98.40 ± 5.0a | 0.428 | 106.10 ± 3.6 | 119.10 ± 4.3b | 0.036 | 102.00 ± 8.1 | 122.90 ± 7.7b | 0.068 | 98.90 ± 2.8 | 110.50 ± 3.1 | 0.016 | 0.081 | 0.018 |
| Niacin | 64.60 ± 1.9a | 63.70 ± 2.6a | 0.679 | 74.00 ± 2.3b | 72.00 ± 2.7b | 0.474 | 68.40 ± 3.2ab | 86.50 ± 5.9b | 0.009 | 68.80 ± 1.4 | 69.90 ± 1.7 | 0.889 | 0.030 | 0.007 |
| Calcium | 47.90 ± 2.0 | 46.50 ± 2.0a | 0.461 | 54.70 ± 1.9 | 58.70 ± 2.4b | 0.002 | 55.20 ± 5.1 | 62.10 ± 4.3b | 0.335 | 51.30 ± 1.5 | 53.70 ± 1.6 | 0.496 | 0.222 | < 0.001 |
| Phosphorus | 103.90 ± 2.9 | 101.90 ± 3.5a | 0.503 | 115.60 ± 2.8 | 123.60 ± 3.9b | 0.143 | 117.60 ± 7.1 | 137.10 ± 6.3b | 0.024 | 109.80 ± 2.1 | 115.70 ± 2.6 | 0.204 | 0.153 | < 0.001 |
| Iron | 117.50 ± 3.5 | 113.00 ± 5.7a | 0.539 | 122.00 ± 3.1 | 133.40 ± 5.1b | 0.062 | 112.40 ± 5.8 | 127.30 ± 8.9ab | 0.167 | 119.00 ± 2.2 | 123.90 ± 3.7 | 0.289 | 0.349 | 0.007 |
| MAR | 0.66 ± 0.01a | 0.65 ± 0.01a | 0.385 | 0.72 ± 0.01b | 0.73 ± 0.01b | 0.679 | 0.70 ± 0.02 | 0.76 ± 0.02b | 0.076 | 0.69 ± 0.01 | 0.70 ± 0.01 | 0.778 | 0.012 | < 0.001 |
%, Mean ± SE
1)Estimated Energy Requirements (EER) for total energy, Recommended Nutrient Intake (RNI) for protein, vitamin A, vitamin C, thiamin, riboflavin, niacin, calcium, phosphorus and iron.
2)P-values were estimated by ANCOVA test in complex sample survey data analysis after adjusting for age.
3)P-values were estimated for 2019 income groups by ANCOVA test in complex sample survey data analysis after adjusting for age.
4)P-values were estimated for 2020 income groups by ANCOVA test in complex sample survey data analysis after adjusting for age.
a, b: Values with different superscripts in a row are significantly different from each other at P < 0.05 by Tukey test.
MAR: Mean Adequacy Ratio
Table 3.Changes in energy intake and nutrient density of Korean older adults during COVID-19 pandemic by income level
| Characteristics |
Male (n = 1,054) |
|||||||||||||
|---|---|---|---|---|---|---|---|---|---|---|---|---|---|---|
|
Low income |
P-value1) |
Middle income |
P-value |
High income |
P-value |
Total |
P-value | 20192) P-value | 20203) P-value | |||||
| 2019 (n = 239) | 2020 (n = 165) | 2019 (n = 289) | 2020 (n = 247) | 2019 (n = 54) | 2020 (n = 60) | 2019 (n = 582) | 2020 (n = 472) | |||||||
| Total energy (kcal/day) | 1,674.80 ± 38.20a | 1,644.00 ± 58.50a | 0.682 | 1,868.30 ± 43.80b | 1,881.40 ± 51.20b | 0.994 | 2,052.80 ± 110.70b | 1,836.50 ± 81.50ab | 0.109 | 1,815.60 ± 31.20 | 1,797.70 ± 36.90 | 0.573 | 0.014 | 0.026 |
| Carbohydrate (g/1,000 kcal) | 168.40 ± 2.50a | 172.40 ± 2.40 | 0.275 | 163.80 ± 2.20a | 163.00 ± 2.90 | 0.863 | 152.20 ± 3.90b | 161.30 ± 4.90 | 0.146 | 164.20 ± 1.60 | 165.80 ± 2.00 | 0.475 | 0.017 | 0.043 |
| Fat (g/1,000 kcal) | 15.70 ± 0.60a | 15.60 ± 0.70a | 0.914 | 18.50 ± 0.50b | 19.90 ± 0.90b | 0.231 | 21.30 ± 0.90c | 19.90 ± 1.50b | 0.453 | 17.80 ± 0.40 | 18.50 ± 0.60 | 0.430 | < 0.001 | < 0.001 |
| Protein (g/1,000 kcal) | 34.70 ± 0.70 | 32.90 ± 0.70a | 0.067 | 35.20 ± 0.60 | 35.20 ± 0.90b | 0.980 | 37.10 ± 0.90 | 37.30 ± 1.30b | 0.945 | 35.20 ± 0.40 | 34.70 ± 0.40 | 0.431 | 0.662 | 0.005 |
| Fiber (g/1,000 kcal) | 15.10 ± 0.40 | 14.80 ± 0.50a | 0.668 | 15.20 ± 0.40 | 15.80 ± 0.40ab | 0.289 | 14.20 ± 0.70 | 17.00 ± 0.80b | 0.008 | 15.10 ± 0.30 | 15.60 ± 0.30 | 0.193 | 0.559 | 0.021 |
| Vitamin A (μgRAE/1,000 kcal) | 189.40 ± 14.30 | 150.50 ± 8.70a | 0.023 | 198.30 ± 16.50 | 210.60 ± 12.70b | 0.568 | 179.00 ± 14.60 | 223.60 ± 24.60b | 0.125 | 192.70 ± 10.30 | 192.90 ± 7.70 | 0.972 | 0.578 | < 0.001 |
| Vitamin C (mg/1,000 kcal) | 30.60 ± 1.90 | 31.20 ± 4.60 | 0.900 | 37.20 ± 2.70 | 35.50 ± 2.90 | 0.698 | 29.90 ± 3.50 | 41.30 ± 5.00 | 0.071 | 33.90 ± 1.60 | 34.90 ± 2.20 | 0.712 | 0.085 | 0.423 |
| Thiamin (mg/1,000 kcal) | 0.75 ± 0.01 | 0.68 ± 0.01 | 0.007 | 0.73 ± 0.01 | 0.65 ± 0.01 | 0.001 | 0.66 ± 0.03 | 0.69 ± 0.02 | 0.550 | 0.73 ± 0.01 | 0.67 ± 0.01 | < 0.001 | 0.078 | 0.260 |
| Riboflavin (mg/1,000 kcal) | 0.71 ± 0.02 | 0.74 ± 0.03a | 0.357 | 0.79 ± 0.02 | 0.82 ± 0.02ab | 0.270 | 0.84 ± 0.04 | 0.87 ± 0.04b | 0.677 | 0.76 ± 0.01 | 0.80 ± 0.01 | 0.127 | 0.058 | 0.037 |
| Niacin (mgNE/1,000 kcal) | 6.40 ± 0.17 | 6.06 ± 0.16 | 0.158 | 6.60 ± 0.17 | 6.39 ± 0.12 | 0.305 | 6.09 ± 0.27 | 6.43 ± 0.25 | 0.370 | 6.47 ± 0.11 | 6.29 ± 0.09 | 0.210 | 0.382 | 0.510 |
| Calcium (mg/1,000 kcal) | 295.80 ± 12.80 | 253.60 ± 10.50a | 0.011 | 295.60 ± 10.20 | 286.20 ± 9.30b | 0.504 | 297.30 ± 20.20 | 316.30 ± 15.90b | 0.465 | 295.90 ± 8.00 | 279.80 ± 7.10 | 0.135 | 0.990 | < 0.001 |
| Phosphorus (mg/1,000 kcal) | 554.20 ± 10.70 | 531.40 ± 11.10a | 0.141 | 571.30 ± 8.80 | 563.30 ± 9.30ab | 0.555 | 582.50 ± 25.80 | 604.10 ± 17.60b | 0.480 | 566.00 ± 6.80 | 558.70 ± 6.80 | 0.438 | 0.361 | < 0.001 |
| Sodium (mg/1,000 kcal) | 1,970.20 ± 62.10 | 1,936.10 ± 69.50 | 0.709 | 1,842.90 ± 49.20 | 1,875.90 ± 44.30 | 0.656 | 1,907.00 ± 102.20 | 1,779.10 ± 120.70 | 0.400 | 1,898.50 ± 36.70 | 1,881.80 ± 33.00 | 0.756 | 0.169 | 0.801 |
| Potassium (mg/1,000 kcal) | 1,552.80 ± 44.80 | 1,581.30 ± 43.20a | 0.646 | 1,592.80 ± 34.90 | 1,676.80 ± 31.90ab | 0.062 | 1,563.00 ± 68.00 | 1,789.10 ± 52.70b | 0.008 | 1,574.20 ± 27.20 | 1,661.60 ± 24.40 | 0.017 | 0.763 | 0.001 |
| Iron (mg/1,000 kcal) | 6.77 ± 0.19 | 6.09 ± 0.22a | 0.022 | 7.04 ± 0.24 | 6.48 ± 0.20ab | 0.064 | 6.58 ± 0.33 | 7.17 ± 0.34b | 0.214 | 6.89 ± 0.14 | 6.45 ± 0.14 | 0.030 | 0.472 | 0.016 |
| % Energy from carbohydrate | 70.30 ± 0.70a | 71.60 ± 0.90a | 0.320 | 67.70 ± 0.60b | 66.80 ± 1.00b | 0.483 | 63.90 ± 1.20c | 66.00 ± 1.70b | 0.341 | 68.30 ± 0.50 | 68.20 ± 0.70 | 0.963 | 0.001 | < 0.001 |
| % Energy from fat | 14.90 ± 0.60a | 14.60 ± 0.70a | 0.797 | 17.40 ± 0.50b | 18.60 ± 0.90b | 0.303 | 20.30 ± 0.90c | 18.40 ± 1.40b | 0.268 | 16.80 ± 0.30 | 17.20 ± 0.60 | 0.607 | < 0.001 | < 0.001 |
| % Energy from protein | 14.70 ± 0.30 | 13.70 ± 0.20a | 0.023 | 14.70 ± 0.20 | 14.50 ± 0.20ab | 0.581 | 15.60 ± 0.70 | 15.50 ± 0.60b | 0.888 | 14.80 ± 0.20 | 14.40 ± 0.10 | 0.138 | 0.672 | 0.019 |
| Characteristics |
Female (n = 1,354) |
|||||||||||||
|
Low income |
P-value |
Middle income |
P-value |
High income |
P-value |
Total |
P-value | 2019 P-value | 2020 P-value | |||||
| 2019 (n = 397) | 2020 (n = 262) | 2019 (n = 323) | 2020 (n = 262) | 2019 (n = 55) | 2020 (n = 55) | 2019 (n = 775) | 2020 (n = 579) | |||||||
| Total energy (kcal/day) | 1,323.60 ± 29.60 | 1,282.50 ± 36.90a | 0.273 | 1,397.50 ± 27.30 | 1,458.80 ± 43.00b | 0.302 | 1,443.40 ± 60.20 | 1,615.10 ± 69.80b | 0.067 | 1,363.20 ± 20.70 | 1,399.20 ± 27.80 | 0.522 | 0.466 | 0.002 |
| Carbohydrate (g/1,000 kcal) | 179.30 ± 1.40a | 177.80 ± 1.80a | 0.651 | 172.50 ± 1.90b | 170.40 ± 1.70b | 0.439 | 173.80 ± 3.70ab | 164.20 ± 3.30b | 0.067 | 176.10 ± 1.20 | 173.00 ± 1.30 | 0.001 | 0.024 | 0.004 |
| Fat (g/1,000 kcal) | 15.60 ± 0.50 | 16.60 ± 0.60a | 0.326 | 18.70 ± 0.60 | 19.30 ± 0.60b | 0.489 | 18.80 ± 1.30 | 21.10 ± 1.50b | 0.289 | 17.20 ± 0.40 | 18.30 ± 0.40 | 0.129 | < 0.001 | 0.021 |
| Protein (g/1,000 kcal) | 33.10 ± 0.40 | 32.40 ± 0.60 | 0.316 | 34.30 ± 0.60 | 35.10 ± 0.50 | 0.320 | 32.80 ± 1.00 | 36.00 ± 1.40 | 0.088 | 33.60 ± 0.30 | 34.00 ± 0.40 | 0.536 | 0.426 | 0.002 |
| Fiber (g/1,000 kcal) | 15.20 ± 0.30a | 17.00 ± 0.40 | 0.004 | 17.20 ± 0.40b | 18.30 ± 0.50 | 0.109 | 17.10 ± 0.80ab | 17.30 ± 1.00 | 0.872 | 16.20 ± 0.20 | 17.70 ± 0.30 | 0.003 | 0.031 | 0.146 |
| Vitamin A (μgRAE/1,000 kcal) | 210.50 ± 12.90ab | 205.80 ± 18.90 | 0.770 | 228.10 ± 16.60a | 247.50 ± 16.50 | 0.477 | 177.10 ± 15.30b | 238.20 ± 26.30 | 0.047 | 215.50 ± 10.30 | 228.50 ± 11.40 | 0.496 | 0.027 | 0.499 |
| Vitamin C (mg/1,000 kcal) | 38.10 ± 1.80a | 39.00 ± 3.90 | 0.890 | 49.90 ± 3.80b | 49.30 ± 4.30 | 0.849 | 45.40 ± 5.20ab | 48.70 ± 4.90 | 0.658 | 43.60 ± 2.00 | 44.80 ± 2.50 | 0.891 | 0.023 | 0.337 |
| Thiamin (mg/1,000 kcal) | 0.73 ± 0.01a | 0.73 ± 0.02 | 0.849 | 0.72 ± 0.01ab | 0.71 ± 0.01 | 0.656 | 0.64 ± 0.03b | 0.69 ± 0.04 | 0.385 | 0.72 ± 0.01 | 0.71 ± 0.01 | 0.760 | 0.023 | 0.666 |
| Riboflavin (mg/1,000 kcal) | 0.71 ± 0.02a | 0.79 ± 0.02 | 0.049 | 0.80 ± 0.02b | 0.87 ± 0.02 | 0.054 | 0.74 ± 0.04ab | 0.83 ± 0.04 | 0.200 | 0.75 ± 0.01 | 0.83 ± 0.01 | 0.002 | 0.022 | 0.241 |
| Niacin (mgNE/1,000 kcal) | 6.03 ± 0.12a | 6.19 ± 0.16 | 0.511 | 6.70 ± 0.19b | 6.26 ± 0.14 | 0.030 | 6.16 ± 0.26ab | 6.62 ± 0.36 | 0.310 | 6.35 ± 0.10 | 6.27 ± 0.10 | 0.443 | 0.017 | 0.626 |
| Calcium (mg/1,000 kcal) | 288.30 ± 9.80 | 292.20 ± 10.50 | 0.872 | 318.70 ± 10.80 | 323.90 ± 11.00 | 0.787 | 299.70 ± 20.50 | 317.30 ± 19.90 | 0.572 | 301.90 ± 7.30 | 309.50 ± 7.10 | 0.613 | 0.199 | 0.255 |
| Phosphorus (mg/1,000 kcal) | 545.30 ± 7.90 | 551.70 ± 8.60a | 0.480 | 581.00 ± 9.10 | 588.50 ± 8.00b | 0.578 | 568.40 ± 22.00 | 604.40 ± 18.90b | 0.248 | 562.00 ± 6.00 | 574.30 ± 5.70 | 0.234 | 0.066 | 0.001 |
| Sodium (mg/1,000 kcal) | 1,711.80 ± 49.60ab | 1,794.00 ± 59.20 | 0.285 | 1,803.00 ± 62.00a | 1,748.80 ± 47.80 | 0.487 | 1,496.90 ± 85.90b | 1,645.90 ± 113.90 | 0.301 | 1,734.60 ± 40.80 | 1,757.30 ± 35.90 | 0.661 | 0.010 | 0.689 |
| Potassium (mg/1,000 kcal) | 1,595.70 ± 30.50 | 1,722.60 ± 32.20 | 0.008 | 1,745.80 ± 42.20 | 1,849.80 ± 38.30 | 0.097 | 1,687.80 ± 73.80 | 1,775.60 ± 59.40 | 0.361 | 1,665.30 ± 27.50 | 1,786.90 ± 22.70 | 0.002 | 0.103 | 0.051 |
| Iron (mg/1,000 kcal) | 6.58 ± 0.14 | 6.55 ± 0.24 | 0.875 | 6.77 ± 0.15 | 7.11 ± 0.21 | 0.217 | 6.11 ± 0.20 | 6.02 ± 0.42 | 0.864 | 6.63 ± 0.09 | 6.75 ± 0.15 | 0.577 | 0.064 | 0.020 |
| % Energy from carbohydrate | 72.30 ± 0.50a | 71.70 ± 0.70a | 0.622 | 69.20 ± 0.70b | 68.30 ± 0.60b | 0.400 | 69.70 ± 1.50ab | 66.30 ± 1.40b | 0.118 | 70.80 ± 0.40 | 69.60 ± 0.50 | 0.156 | 0.003 | 0.003 |
| % Energy from fat | 14.20 ± 0.40 | 15.10 ± 0.60a | 0.311 | 16.90 ± 0.50 | 17.40 ± 0.50b | 0.508 | 17.00 ± 1.20 | 19.10 ± 1.30b | 0.277 | 15.50 ± 0.30 | 16.60 ± 0.40 | 0.128 | < 0.001 | 0.025 |
| % Energy from protein | 13.30 ± 0.10 | 13.10 ± 0.20 | 0.322 | 13.80 ± 0.20 | 14.10 ± 0.20 | 0.357 | 13.20 ± 0.40 | 14.50 ± 0.50 | 0.069 | 13.50 ± 0.10 | 13.70 ± 0.10 | 0.542 | 0.461 | 0.006 |
Mean ± SE
1)P-values were estimated by ANCOVA test in complex sample survey data analysis after adjusting for age.
2)P-values were estimated for 2019 income groups by ANCOVA test in complex sample survey data analysis after adjusting for age.
3)P-values were estimated for 2020 income groups by ANCOVA test in complex sample survey data analysis after adjusting for age.
a, b: Values with different superscripts in a row are significantly different from each other at P < 0.05 by Tukey test.
Table 4.Changes in food group1) intake of Korean older adults during COVID-19 pandemic by income level
| Characteristics |
Male (n = 1,054) |
|||||||||||||
|---|---|---|---|---|---|---|---|---|---|---|---|---|---|---|
|
Low income |
P-value2) |
Middle income |
P-value |
High income |
P-value |
Total |
P-value | 20193) P-value | 20204) P-value | |||||
| 2019 (n = 239) | 2020 (n = 165) | 2019 (n = 289) | 2020 (n = 247) | 2019 (n = 54) | 2020 (n = 60) | 2019 (n = 582) | 2020 (n = 472) | |||||||
| Grains | 3.13 ± 0.08 | 3.20 ± 0.11 | 0.644 | 3.28 ± 0.08 | 3.36 ± 0.11 | 0.619 | 3.48 ± 0.26 | 3.11 ± 0.18 | 0.249 | 3.24 ± 0.05 | 3.27 ± 0.07 | 0.803 | 0.435 | 0.418 |
| Meats, fish, eggs, legumes | 2.88 ± 0.19a | 2.49 ± 0.18a | 0.146 | 3.56 ± 0.18b | 3.57 ± 0.28b | 0.916 | 4.29 ± 0.36b | 3.68 ± 0.31b | 0.207 | 3.38 ± 0.14 | 3.23 ± 0.18 | 0.408 | 0.021 | <0.001 |
| Vegetables | 6.70 ± 0.34 | 7.24 ± 0.54 | 0.386 | 7.08 ± 0.31 | 7.85 ± 0.31 | 0.089 | 7.22 ± 0.80 | 7.51 ± 0.60 | 0.766 | 6.95 ± 0.23 | 7.61 ± 0.25 | 0.071 | 0.961 | 0.657 |
| Fruits | 1.33 ± 0.14a | 1.16 ± 0.15a | 0.412 | 2.02 ± 0.24b | 2.01 ± 0.16b | 0.963 | 1.96 ± 0.39ab | 2.55 ± 0.50b | 0.350 | 1.75 ± 0.15 | 1.81 ± 0.14 | 0.809 | 0.027 | <0.001 |
| Milk & dairy products | 0.32 ± 0.05 | 0.27 ± 0.05a | 0.396 | 0.37 ± 0.04 | 0.41 ± 0.06b | 0.607 | 0.55 ± 0.13 | 0.53 ± 0.11b | 0.944 | 0.37 ± 003 | 0.38 ± 0.04 | 0.949 | 0.444 | 0.026 |
| Oils sweets | 1.12 ± 0.13 | 1.12 ± 0.13 | 0.993 | 1.41 ± 0.13 | 1.42 ± 0.11 | 0.983 | 1.47 ± 0.22 | 1.53 ± 0.29 | 0.869 | 1.31 ± 0.10 | 1.34 ± 0.08 | 0.859 | 0.300 | 0.187 |
| Characteristics |
Female (n = 1,354) |
|||||||||||||
|
Low income |
P-value |
Middle income |
P-value |
High income |
P-value |
Total |
P-value | 2019 P-value | 2020 P-value | |||||
| 2019 (n = 397) | 2020 (n = 262) | 2019 (n = 323) | 2020 (n = 262) | 2019 (n = 55) | 2020 (n = 55) | 2019 (n = 775) | 2020 (n = 579) | |||||||
| Grains | 2.64 ± 0.07 | 2.50 ± 0.08 | 0.175 | 2.57 ± 0.06 | 2.60 ± 0.09 | 0.867 | 2.74 ± 0.13 | 2.85 ± 0.23 | 0.641 | 2.62 ± 0.05 | 2.58 ± 0.06 | 0.597 | 0.350 | 0.385 |
| Meats, fish, eggs, legumes | 2.05 ± 0.10 | 2.11 ± 0.18 | 0.902 | 2.32 ± 0.11 | 2.64 ± 0.15 | 0.102 | 2.29 ± 0.24 | 2.84 ± 0.28 | 0.147 | 2.18 ± 0.08 | 2.43 ± 0.11 | 0.130 | 0.507 | 0.108 |
| Vegetables | 4.91 ± 0.21 | 5.48 ± 0.28 | 0.123 | 5.68 ± 0.37 | 6.19 ± 0.30 | 0.378 | 5.29 ± 0.43 | 6.10 ± 0.56 | 0.259 | 5.26 ± 0.19 | 5.87 ± 0.19 | 0.051 | 0.565 | 0.448 |
| Fruits | 1.52 ± 0.13a | 1.38 ± 0.15a | 0.345 | 2.10 ± 0.16b | 2.27 ± 0.21b | 0.578 | 1.93 ± 0.31ab | 2.55 ± 0.45b | 0.260 | 1.79 ± 0.10 | 1.92 ± 0.14 | 0.696 | 0.035 | <0.001 |
| Milk & dairy products | 0.39 ± 0.04 | 0.38 ± 0.05 | 0.880 | 0.44 ± 0.04 | 0.49 ± 0.06 | 0.542 | 0.65 ± 0.12 | 0.71 ± 0.12 | 0.756 | 0.43 ± 0.03 | 0.47 ± 0.04 | 0.607 | 0.146 | 0.073 |
| Oils sweets | 1.00 ± 0.12 | 0.85 ± 0.07a | 0.251 | 1.10 ± 0.08 | 1.25 ± 0.10b | 0.260 | 1.17 ± 0.18 | 1.63 ± 0.21b | 0.111 | 1.06 ± 0.07 | 1.12 ± 0.06 | 0.623 | 0.740 | <0.001 |
Number of servings, Mean ± SE
1)One serving is the amount of foods providing 300 kcal for grains, 100 kcal for meat, fish, eggs and legumes, 15 kcal for vegetables, 50 kcal for fruits, 125 kcal for milk and dairy products, and 45 kcal for fats, oils & sweets based on 2020 dietary reference intake for Koreans. Number of servings = total calories from a food group/calories in single serving.
2)P-values were estimated by ANCOVA test in complex sample survey data analysis after adjusting for age.
3)P-values were estimated for 2019 income groups by ANCOVA test in complex sample survey data analysis after adjusting for age.
4)P-values were estimated for 2020 income groups by ANCOVA test in complex sample survey data analysis after adjusting for age.
a, b: Values with different superscripts in a row are significantly different from each other at P < 0.05 by Tukey test.
Table 5.Changes in nutrient intake (%RNI1)) and MAR score of Korean older adults during COVID-19 pandemic by household type
| Characteristics |
Living alone (n = 570) |
P-value2) |
With spouse (n = 1185) |
P-value |
With spouse & children (n = 201) |
P-value |
Single with children (n = 101) |
P-value |
Other (n = 351) |
P-value |
Total (n = 2408) |
P-value | 20193) P-value | 20204) P-value | ||||||
|---|---|---|---|---|---|---|---|---|---|---|---|---|---|---|---|---|---|---|---|---|
| 2019 (n = 324) | 2020 (n = 246) | 2019 (n = 658) | 2020 (n = 527) | 2019 (n = 116) | 2020 (n = 85) | 2019 (n = 59) | 2020 (n = 42) | 2019 (n = 200) | 2020 (n = 151) | 2019 (n = 1,357) | 2020 (n=1,051) | |||||||||
| Energy | 89.32 ± 2.06 | 82.73 ± 2.13a | 0.015 | 89.88 ± 1.29 | 93.23 ± 1.69b | 0.137 | 97.68 ± 3.78 | 83.31 ± 4.17ab | 0.015 | 89.95 ± 4.65 | 87.89 ± 5.80ab | 0.652 | 84.75 ± 2.33 | 96.53 ± 3.77b | 0.026 | 89.74 ± 1.02 | 90.33 ± 1.51 | 0.936 | 0.177 | < 0.001 |
| Protein | 95.62 ± 3.11ab | 88.31 ± 3.02a | 0.054 | 100.63 ± 2.07bc | 107.50 ± 2.54b | 0.047 | 114.59 ± 5.98c | 94.70 ± 6.69ab | 0.034 | 90.95 ± 6.44ab | 97.15 ± 7.51ab | 0.636 | 90.70 ± 2.72a | 101.12 ± 5.46ab | 0.293 | 98.84 ± 1.65 | 100.59 ± 2.16 | 0.794 | 0.027 | 0.001 |
| Vitamin A | 44.72 ± 2.64 | 39.35 ± 2.64a | 0.099 | 51.50 ± 2.75 | 56.11 ± 2.77b | 0.241 | 70.44 ± 14.77 | 51.15 ± 7.32ab | 0.265 | 55.93 ± 12.68 | 55.38 ± 8.24ab | 0.880 | 43.59 ± 3.94 | 49.84 ± 4.92ab | 0.505 | 51.06 ± 2.60 | 50.99 ± 1.94 | 0.794 | 0.213 | 0.005 |
| Vitamin C | 53.24 ± 3.54 | 58.90 ± 5.33 | 0.489 | 61.89 ± 3.38 | 65.97 ± 4.05 | 0.470 | 64.61 ± 5.88 | 62.35 ± 9.62 | 0.912 | 78.89 ± 13.18 | 49.05 ± 7.45 | 0.041 | 63.81 ± 8.39 | 57.93 ± 5.57 | 0.333 | 61.70 ± 2.83 | 61.92 ± 2.76 | 0.851 | 0.256 | 0.346 |
| Thiamin | 110.64 ± 3.05 | 100.68 ± 3.30 | 0.031 | 114.41 ± 2.21 | 111.57 ± 2.54 | 0.439 | 118.93 ± 7.73 | 100.16 ± 8.18 | 0.109 | 109.81 ± 7.90 | 96.61 ± 6.65 | 0.199 | 106.24 ± 3.41 | 115.37 ± 5.02 | 0.180 | 112.43 ± 1.68 | 108.06 ± 2.08 | 0.099 | 0.391 | 0.005 |
| Riboflavin | 95.46 ± 3.38 | 94.82 ± 3.53a | 0.759 | 100.96 ± 2.84 | 117.18 ± 3.24b | <0.001 | 116.54 ± 7.57 | 102.07 ± 7.95ab | 0.239 | 97.43 ± 9.75 | 107.27 ± 9.92ab | 0.531 | 98.30 ± 5.35 | 105.08 ± 5.88ab | 0.727 | 100.88 ± 2.49 | 108.41 ± 2.83 | 0.076 | 0.473 | < 0.001 |
| Niacin | 71.09 ± 2.51 | 67.73 ± 2.54ac | 0.229 | 80.20 ± 1.88 | 80.54 ± 2.07c | 0.881 | 81.33 ± 4.46 | 71.77 ± 5.16abc | 0.186 | 68.68 ± 3.85 | 59.07 ± 4.13a | 0.055 | 70.61 ± 2.81 | 77.92 ± 4.16bc | 0.415 | 76.08 ± 1.35 | 75.48 ± 1.65 | 0.579 | 0.028 | < 0.001 |
| Calcium | 53.49 ± 2.13a | 52.10 ± 2.34a | 0.434 | 66.98 ± 2.14b | 67.50 ± 1.93b | 0.930 | 74.65 ± 4.93a | 59.35 ± 3.93ab | 0.018 | 54.30 ± 6.45ab | 50.07 ± 4.83a | 0.542 | 53.67 ± 3.26a | 59.62 ± 3.27ab | 0.509 | 61.95 ± 1.58 | 61.25 ± 1.60 | 0.483 | < 0.001 | < 0.001 |
| Phosphorus | 113.64 ± 3.27a | 112.46 ± 3.87a | 0.585 | 132.22 ± 2.50bc | 139.15 ± 2.93b | 0.093 | 147.36 ± 6.84c | 118.73 ± 6.62a | 0.003 | 114.64 ± 7.91ab | 113.22 ± 7.71a | 0.758 | 111.99 ± 3.88a | 124.71 ± 5.52ab | 0.259 | 125.47 ± 2.08 | 127.75 ± 2.46 | 0.766 | < 0.001 | < 0.001 |
| Iron | 123.14 ± 4.47 | 110.63 ± 4.19 | 0.030 | 131.37 ± 3.00 | 135.30 ± 4.61 | 0.492 | 140.76 ± 7.28 | 108.39 ± 6.65 | 0.001 | 116.02 ± 7.17 | 104.95 ± 8.38 | 0.234 | 117.52 ± 3.82 | 136.38 ± 9.54ab | 0.129 | 127.38 ± 2.05 | 126.11 ± 3.28 | 0.595 | 0.016 | < 0.001 |
| MAR | 0.68 ± 0.01a | 0.66 ± 0.01a | 0.211 | 0.73 ± 0.01b | 0.75 ± 0.01b | 0.175 | 0.76 ± 0.01b | 0.70 ± 0.02ab | 0.129 | 0.69 ± 0.03ab | 0.67 ± 0.03ab | 0.564 | 0.68 ± 0.01a | 0.71 ± 0.01ab | 0.460 | 0.71 ± 0.01 | 0.72 ± 0.01 | 0.955 | 0.002 | < 0.001 |
%, Mean ± SE
1)Estimated Energy Requirements (EER) for total energy, Recommended Nutrient Intake (RNI) for protein, vitamin A, vitamin C, thiamin, riboflavin, niacin, calcium, phosphorus and iron.
2)P-values were estimated by ANCOVA test in complex sample survey data analysis after adjusting for age.
3)P-values were estimated for 2019 household types by ANCOVA test in complex sample survey data analysis after adjusting for age.
4)P-values were estimated for 2020 household types by ANCOVA test in complex sample survey data analysis after adjusting for age.
a, b, c: Values with different superscripts in a row are significantly different from each other at P < 0.05 by Tukey test.
MAR: Mean Adequacy Ratio
- 1. Statistics Korea. Estimated future population: 2000-2025 [Internet]. Statistics Korea; 2020 [cited 2023 May 12]. Available from: https://kosis.kr/
- 2. National Health Insurance Service. 2021 National Health Insurance Statistical Yearbook [Internet]. National Health Insurance Service; 2022 [cited 2023 May 12]. Available from: https://www.nhis.or.kr/
- 3. Bowman S. Low economic status is associated with suboptimal intakes of nutritious foods by adults in the National Health and Nutrition Examination Survey. Nutr Res 2007; 27(9): 515-523.
- 4. Khil JM. Comparison of the health and nutritional status of Korean elderly considering the household income level, using the 2018 Korea National Health and Nutrition Examination Survey. J Nutr Health 2021; 54(1): 39-53.ArticleLink
- 5. Kwon DH, Park HA, Cho YG, Kim KW, Kim NH. Different associations of socioeconomic status on protein intake in the Korean elderly population: A cross-sectional analysis of the Korea National Health and Nutrition Examination Survey. Nutrients 2019; 12(1): 10.ArticlePubMedPMC
- 6. Kim S, Hong HS, Lee HJ. Nutrient intake status of the elderly in metropolitan, middle & small cities, and rural areas according to income level within the same region: Korea National Health and Nutrition Examination Survey (2016-2018). J Korean Soc Food Cult 2021; 36(1): 92-102.
- 7. World Health Organization. WHO director-general's opening remarks at the media briefing on COVID19 [Internet]. World Health Organization; 2020 [cited 2020 Mar 11]. Available from: https://www.who.int/
- 8. Banerjee D, Rai M. Social isolation in Covid-19: The impact of loneliness. Int J Soc Psychiatry 2020; 66(6): 525-527.ArticlePubMedPMCLink
- 9. Choi JY. COVID-19 in South Korea. Postgrad Med J 2020; 96(1137): 399-402.ArticlePubMedPMCPDF
- 10. Proto E, Quintana-Domeque C. COVID-19 and mental health deterioration by ethnicity and gender in the UK. PLoS One 2021; 16(1): e0244419.ArticlePubMedPMC
- 11. Oberndorfer M, Dorner TE, Brunnmayr M, Berger K, Dugandzic B, Bach M. Health-related and socio-economic burden of the COVID-19 pandemic in Vienna. Health Soc Care Community 2022; 30(4): 1550-1561.ArticlePubMedPMCLink
- 12. Park KH, Kim AR, Yang MA, Lim SJ, Park JH. Impact of the COVID-19 pandemic on the lifestyle, mental health, and quality of life of adults in South Korea. PLoS One 2021; 16(2): e0247970.ArticlePubMedPMC
- 13. Kim M, Chae H. Comparison of health behaviors of adult women in Korea before and during the COVID-19 pandemic: Secondary analysis of the Korea National Health and Nutrition Examination Survey 2019-2020. Korean J Women Health Nurs 2022; 28(3): 222-234.ArticlePubMedPMCPDF
- 14. Chew HSJ, Lopez V. Global impact of COVID-19 on weight and weight-related behaviors in the adult population: A scoping review. Int J Environ Res Public Health 2021; 18(4): 1876.ArticlePubMedPMC
- 15. Ministry of Health and Welfare (KR), The Korean Nutrition Society. Dietary Reference Intakes for Koreans 2020. Sejong: Ministry of Health and Welfare; 2020.
- 16. Yun S, Oh K. Dietary and nutritional status of Koreans based on the Health Plan 2020 nutrition indicators. Public Health Wkly Rep 2018; 11(44): 1483-1491.
- 17. Poskute AS, Nzesi A, Geliebter A. Changes in food intake during the COVID-19 pandemic in New York City. Appetite 2021; 163: 105191.ArticlePubMedPMC
- 18. Larson EA, Bader-Larsen KS, Magkos F. The effect of COVID-19-related lockdowns on diet and physical activity in older adults: A systematic review. Aging Dis 2021; 12(8): 1935-1947.ArticlePubMedPMC
- 19. Korea Disease Control and Prevention Agency. Korea Health Statistics 2021: Korea National Health and Nutrition Examination Survey (KNHANES Ⅷ-3). Cheongju: Korea Disease Control and Prevention Agency; 2022.
- 20. Morrow-Howell N, Galucia N, Swinford E. Recovering from the COVID-19 Pandemic: A focus on older adults. J Aging Soc Policy 2020; 32(4-5): 526-535.ArticlePubMed
- 21. Bowman S. Low economic status is associated with suboptimal intakes of nutritious foods by adults in the National Health and Nutrition Examination Survey 1999-2002. Nutr Res 2007; 27(9): 515-523.Article
- 22. Enriquez D, Goldstein A. COVID-19's socioeconomic impact on low-income benefit recipients: Early evidence from tracking surveys. Socius 2020; 6: 1-17.ArticleLink
- 23. Huang KM, Sant'Anna AC, Etienne X. How did Covid-19 impact US household foods? An analysis six months in. PLoS One 2021; 16(9): e0256921.ArticlePubMedPMC
- 24. Bonaccio M, Gianfagna F, Stival C, Amerio A, Bosetti C, Cavalieri d'Oro L, et al. Changes in a Mediterranean lifestyle during the COVID-19 pandemic among elderly Italians: An analysis of gender and socioeconomic inequalities in the “LOST in Lombardia” study. Int J Food Sci Nutr 2022; 73(5): 683-692.ArticlePubMed
- 25. Harrison E, Monroe-Lord L, Carson AD, Jean-Baptiste AM, Phoenix J, Jackson P, et al. COVID-19 pandemic-related changes in wellness behavior among older Americans. BMC Public Health 2021; 21(1): 755.ArticlePubMedPMCPDF
- 26. Enriquez-Martinez OG, Martins MCT, Pereira TSS, Pacheco SOS, Pacheco FJ, Lopez KV, et al. Diet and lifestyle changes during the COVID-19 pandemic in Ibero-American countries: Argentina, Brazil, Mexico, Peru, and Spain. Front Nutr 2021; 8: 1-14.ArticlePubMedPMC
- 27. Baik I. Region-specific COVID-19 risk scores and nutritional status of a high-risk population based on individual vulnerability assessment in the national survey data. Clin Nutr 2022; 41(12): 3100-3105.ArticlePubMedPMC
- 28. Na HM, Jung BM. Dietary behavior and diet quality in the Korean adult population by income level before and after the COVID-19 pandemic: Using the Korean National Health and Nutrition Examination Survey (2019-2020). Korean J Community Living Sci 2022; 33(3): 397-413.Article
- 29. Sengul M, Ufuk S. The importance of nutrition in protecting the elderly from COVID-19. Magna Sci Adv Biol Pharm 2021; 3(1): 64-71.
- 30. So EJ, Joung H. Socio-economic status is associated with the risk of inadequate energy intake among Korean elderly. J Nutr Health 2015; 48(4): 371-379.Article
- 31. Oh JH, Jung BM. Comparison analysis of dietary behavior and nutrient intakes of the elderly according to their family status: The Korea National Health and Nutrition Examination Survey 2013-2016. Korean J Community Nutr 2019; 24(4): 309-320.ArticleLink
- 32. Lim HS, Lee MN. Comparison of health status and nutrient intake by household type in the elderly population. J Bone Metab 2019; 26(1): 25-30.ArticlePubMedPMCLink
- 33. Visser M, Schaap LA, Wijnhoven HAH. Self-reported impact of the COVID-19 pandemic on nutrition and physical activity behaviour in Dutch older adults living independently. Nutrients 2020; 12(12): 3708.ArticlePubMedPMC
REFERENCES
Figure & Data
REFERENCES
Citations
Citations to this article as recorded by 
- Health status of poor, older urban adults compared with key health indicators from the 2023 Korea National Health and Nutrition Examination Survey in the Republic of Korea: a cross-sectional comparative study
Joo Hyun Kim, Yeon Jeong Heo, Curie Ahn, Ho Young Lee, Bumjo Oh, Jae Bok Kwak, Samil Park, Jung Sik Lee, Soyeon Kim, Chaewon Nam, Taerim Lee
Journal of Korean Biological Nursing Science.2026; 28(1): 179. CrossRef - How Did the Dietary Behavior of Older Korean Adults Change During the COVID-19 Pandemic?
Yong-Seok Kwon, Dasol Kim, Hee-Sook Lim
Nutrients.2025; 17(12): 1973. CrossRef - Development of Protein Enhanced Diet for Socially Vulnerable Elderly
Jihye Hong, Hyung-Geun Jeon, Seulgi Kim, Gitae Park
Journal of the East Asian Society of Dietary Life.2024; 34(1): 39. CrossRef - Comparison of nutrient intake and Korean Healthy Eating Index among the elderly in rural areas pre- and post- COVID-19 pandemic: the 2018–2021 Korea National Health and Nutrition Examination Survey data
Sangyeon Kim, Hye-Sook Hong, Hae-Jeung Lee
Journal of Nutrition and Health.2024; 57(5): 496. CrossRef
 Cite
Cite- Figure
-
- We recommend
- Related articles
-
- Differences in lunch nutrient intake and nutritional adequacy among Korean older adults by meal site: a cross-sectional analysis of the 2018–2021 Korea National Health and Nutrition Examination Survey data
- Association between nutrient intake and frailty status in Korean older adults: a cross-sectional study using the 9th (2022–2023) Korea National Health and Nutrition Examination Survey
- Comparison of dietary behaviors and nutrient intake by gender and household type among older Koreans: a cross-sectional study using data from the 8th Korea National Health and Nutrition Examination Survey
- Trends in growth and nutritional status of Korean toddlers and preschoolers: a cross-sectional study using 2010–2021 Korea National Health and Nutrition Examination Survey data
- Total sugar intake and its contributed foods by age groups in Koreans using the 8th (2019–2021) Korea National Health and Nutrition Examination Survey: a cross-sectional study
Changes in nutritional status of Korean older adults during COVID-19 Pandemic by household income and demographic factors -using the Korea National Health and Nutrition Examination Survey(2019-2020): a cross-sectional study
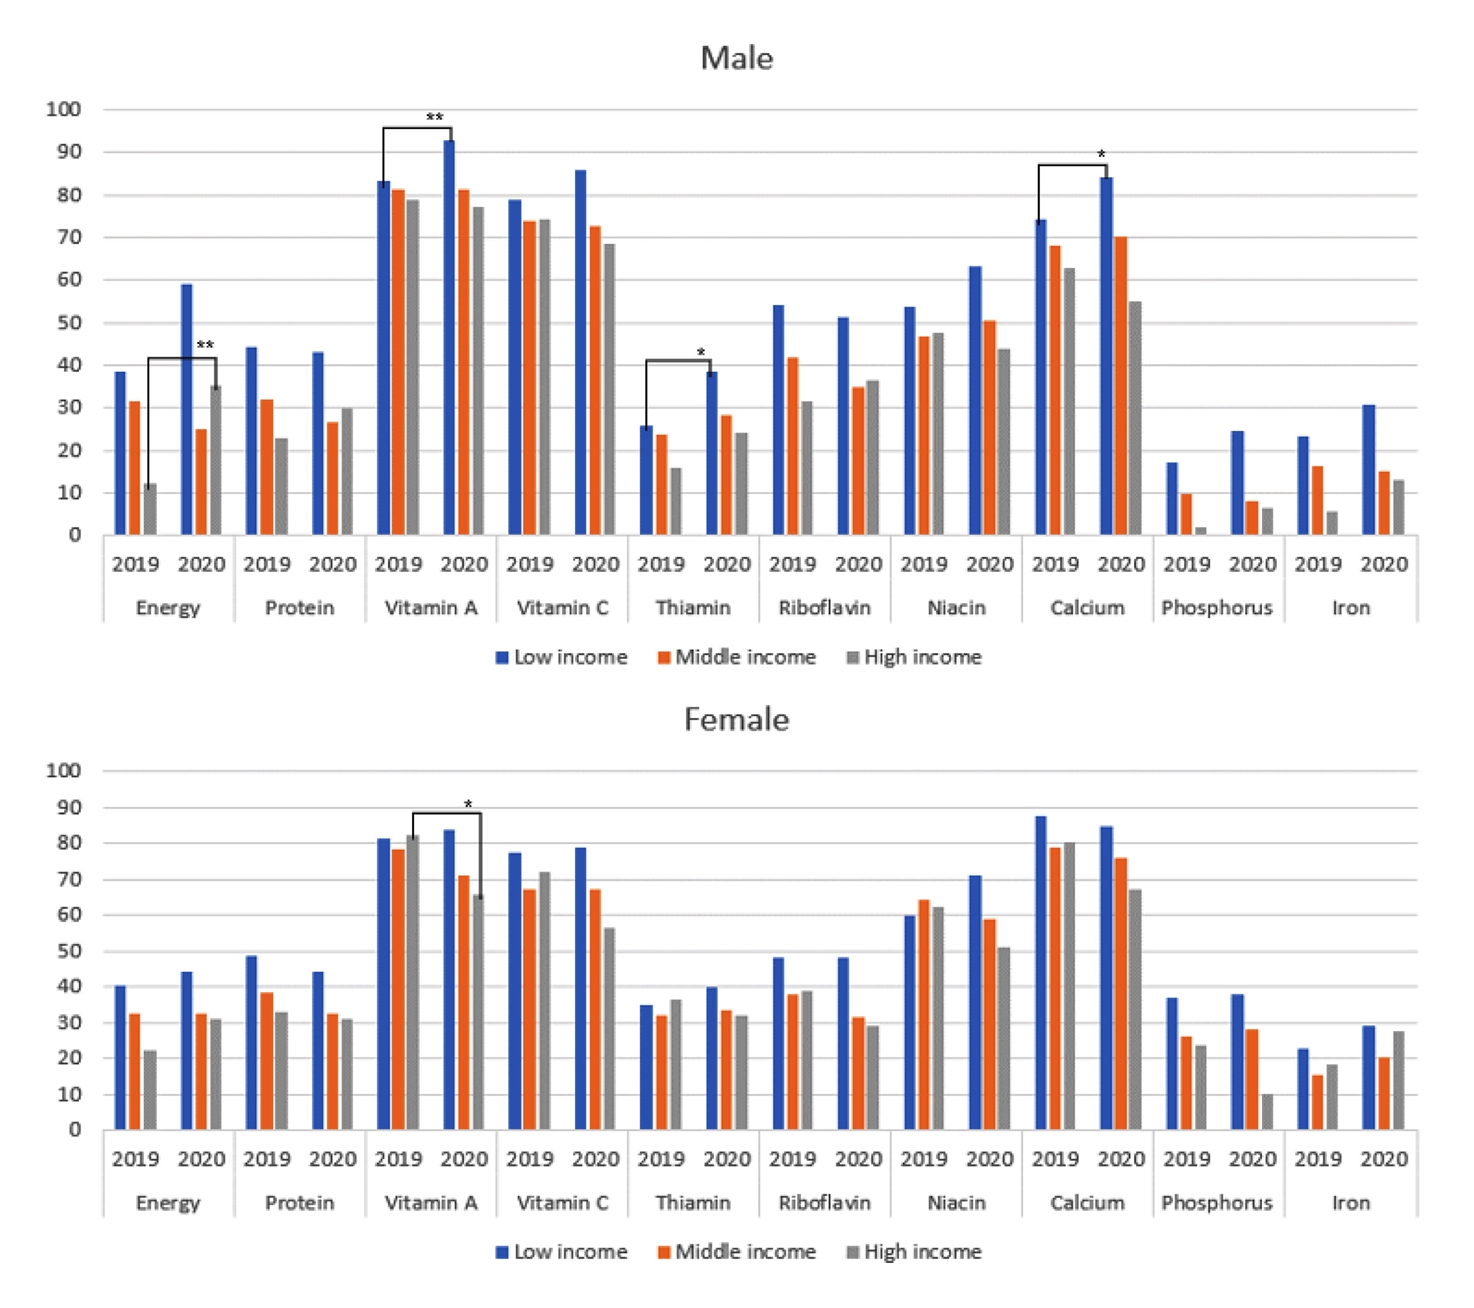
Fig. 1. Changes in the percentages of Korean older adults with nutrient intakes lower than the EAR during COVID-19 pandemic by income level. *P < 0.05, **P < 0.01 by χ2-testEAR: Estimated Average Requirement
Fig. 1.
Changes in nutritional status of Korean older adults during COVID-19 Pandemic by household income and demographic factors -using the Korea National Health and Nutrition Examination Survey(2019-2020): a cross-sectional study
| Characteristics | Male (n = 1,054) |
P-value | Female (n = 1,354) |
P-value | ||
|---|---|---|---|---|---|---|
| 2019 (n = 582) | 2020 (n = 472) | 2019 (n = 775) | 2020 (n = 579) | |||
| Age (years) | ||||||
| 65–74 | 351 (62.8) | 304 (66.3) | 0.303 | 461 (54.0) | 391 (62.1) | 0.010 |
| ≥ 75 | 231 (37.2) | 168 (33.7) | 314 (46.0) | 188 (37.9) | ||
| Household income | ||||||
| Lowest | 239 (38.0) | 165 (32.6) | 0.303 | 397 (50.8) | 262 (43.3) | 0.058 |
| Medium | 189 (50.7) | 247 (53.2) | 323 (42.0) | 262 (46.0) | ||
| Highest | 54 (11.3) | 60 (14.2) | 55 (7.2) | 55 (10.7) | ||
| Education level | ||||||
| ≤ Elementary school | 232 (36.3) | 165 (34.7) | 0.972 | 528 (67.2) | 365 (61.7) | 0.376 |
| Middle school | 108 (18.8) | 93 (18.6) | 111 (14.1) | 102 (18.1) | ||
| High school | 152 (27.8) | 128 (28.7) | 100 (13.5) | 82 (14.7) | ||
| ≥ College | 90 (17.0) | 86 (17.9) | 36 (5.2) | 30 (5.5) | ||
| Family type | ||||||
| Living alone | 80 (12.0) | 73 (13.8) | 0.539 | 244 (27.6) | 173 (26.7) | 0.810 |
| With spouse | 365 (58.3) | 292 (57.9) | 293 (34.3) | 235 (37.7) | ||
| With spouse & children | 70 (16.6) | 49 (13.2) | 46 (7.0) | 36 (7.8) | ||
| Single with children | 8 (1.6) | 5 (1.1) | 51 (8.9) | 37 (8.0) | ||
| Other | 59 (11.4) | 53 (14.0) | 141 (22.2) | 98 (19.9) | ||
| Residential area | ||||||
| Urban | 415 (74.3) | 344 (78.9) | 0.521 | 554 (74.7) | 427 (78.1) | 0.614 |
| Rural | 167 (25.7) | 128 (21.1) | 221 (25.3) | 152 (21.9) | ||
| Employment | ||||||
| Employed | 235 (40.1) | 206 (44.5) | 0.330 | 234 (30.1) | 190 (31.0) | 0.800 |
| Unemployed | 347 (59.4) | 266 (55.5) | 541 (69.9) | 389 (69.0) | ||
| Current smoking | ||||||
| Yes | 107 (19.1) | 86 (19.1) | 0.995 | 22 (3.1) | 18 (3.2) | 0.944 |
| No | 475 (80.9) | 386 (80.9) | 753 (96.9) | 561 (96.8) | ||
| Regular excercise (walking) | ||||||
| Yes | 460 (81.6) | 373 (80.7) | 0.776 | 578 (75.6) | 448 (77.8) | 0.477 |
| No | 122 (18.4) | 99 (19.3) | 197 (24.4) | 131 (22.2) | ||
| Characteristics | Male (n = 1,054) |
|||||||||||||
|---|---|---|---|---|---|---|---|---|---|---|---|---|---|---|
| Low income |
P-value |
Middle income |
P-value | High income |
P-value | Total |
P-value | 2019 |
2020 |
|||||
| 2019 (n = 239) | 2020 (n = 165) | 2019 (n = 289) | 2020 (n = 247) | 2019 (n = 54) | 2020 (n = 60) | 2019 (n = 582) | 2020 (n = 472) | |||||||
| Energy | 86.00 ± 1.9 |
84.40 ± 2.9 |
0.660 | 94.80 ± 2.1 |
95.30 ± 2.5 |
0.998 | 103.00 ± 5.5 |
92.30 ± 4.1 |
0.113 | 92.40 ± 1.5 | 91.30 ± 1.8 | 0.574 | 0.016 | 0.025 |
| Protein | 98.00 ± 3.2 |
90.20 ± 3.1 |
0.091 | 110.40 ± 3.4 |
110.50 ± 3.6 |
0.889 | 125.20 ± 6.9 |
114.80 ± 5.6 |
0.244 | 107.30 ± 2.6 | 104.50 ± 2.4 | 0.333 | 0.029 | < 0.001 |
| Vitamin A | 47.90 ± 4.4 | 35.30 ± 2.5 |
0.016 | 56.50 ± 7.4 | 55.10 ± 3.2 |
0.823 | 51.80 ± 4.7 | 54.90 ± 5.4 |
0.665 | 52.70 ± 4.1 | 48.60 ± 2.0 | 0.338 | 0.720 | < 0.001 |
| Vitamin C | 53.90 ± 4.3 | 48.10 ± 5.2 | 0.420 | 66.60 ± 4.9 | 64.90 ± 5.2 | 0.792 | 62.40 ± 8.3 | 69.80 ± 7.8 | 0.535 | 61.30 ± 3.1 | 60.10 ± 3.5 | 0.762 | 0.213 | 0.076 |
| Thiamin | 113.20 ± 3.6 | 101.00 ± 4.3 | 0.033 | 121.10 ± 4.0 | 109.70 ± 3.5 | 0.022 | 121.90 ± 10.1 | 114.30 ± 6.6 | 0.527 | 118.20 ± 2.9 | 107.50 ± 2.4 | 0.003 | 0.698 | 0.277 |
| Riboflavin | 90.50 ± 4.0 |
90.20 ± 4.4 |
0.969 | 108.50 ± 3.8 |
112.80 ± 4.5 |
0.516 | 123.00 ± 7.5 |
114.70 ± 8.3 |
0.454 | 103.30 ± 3.0 | 105.70 ± 3.2 | 0.653 | 0.005 | < 0.001 |
| Niacin | 79.90 ± 3.1 | 74.10 ± 3.4 | 0.202 | 89.30 ± 2.8 | 86.40 ± 2.7 | 0.396 | 87.20 ± 5.4 | 84.40 ± 4.5 | 0.694 | 85.50 ± 1.9 | 82.10 ± 2.0 | 0.202 | 0.124 | 0.050 |
| Calcium | 71.30 ± 3.7 | 59.20 ± 3.2 |
0.015 | 77.30 ± 3.1 | 74.60 ± 2.7 |
0.447 | 84.50 ± 5.0 | 79.20 ± 4.1 |
0.421 | 75.90 ± 2.5 | 70.20 ± 2.1 | 0.067 | 0.572 | < 0.001 |
| Phosphorus | 132.70 ± 4.3 |
124.00 ± 4.6 |
0.179 | 151.40 ± 3.9 |
149.50 ± 3.9 |
0.627 | 166.20 ± 8.1 |
157.10 ± 6.9 |
0.390 | 146.00 ± 3.1 | 142.30 ± 2.9 | 0.300 | 0.006 | < 0.001 |
| Iron | 126.50 ± 5.3 | 111.00 ± 5.7 |
0.051 | 145.50 ± 5.6 | 135.90 ± 6.5 |
0.202 | 145.30 ± 7.8 | 142.00 ± 8.1 |
0.771 | 138.30 ± 3.6 | 128.60 ± 4.1 | 0.058 | 0.144 | 0.011 |
| MAR | 0.71 ± 0.01 |
0.67 ± 0.01 |
0.123 | 0.76 ± 0.01 |
0.77 ± 0.01 |
0.580 | 0.80 ± 0.01 |
0.79 ± 0.01 |
0.648 | 0.74 ± 0.01 | 0.74 ± 0.01 | 0.716 | 0.002 | < 0.001 |
| Characteristics | Female (n = 1,354) |
|||||||||||||
| Low income |
P-value | Middle income |
P-value | High income |
P-value | Total |
P-value | 2019 P-value | 2020 P-value | |||||
| 2019 (n = 397) | 2020 (n = 262) | 2019 (n = 323) | 2020 (n = 262) | 2019 (n = 55) | 2020 (n = 55) | 2019 (n = 775) | 2020 (n = 579) | |||||||
| Energy | 85.80 ± 1.9 | 82.60 ± 52.3 |
0.261 | 89.30 ± 1.7 | 92.70 ± 2.7 |
0.324 | 91.80 ± 3.8 | 103.10 ± 4.4 |
0.060 | 87.70 ± 1.3 | 89.40 ± 1.7 | 0.546 | 0.442 | 0.002 |
| Protein | 89.00 ± 2.4 | 85.20 ± 3.5 |
0.267 | 95.90 ± 2.5 | 103.90 ± 3.7 |
0.104 | 95.00 ± 5.1 | 117.80 ± 5.5 |
0.003 | 92.30 ± 1.7 | 97.30 ± 2.5 | 0.229 | 0.563 | < 0.001 |
| Vitamin A | 47.60 ± 3.0 | 44.40 ± 4.3 | 0.442 | 53.30 ± 4.3 | 59.10 ± 3.6 | 0.383 | 43.70 ± 4.3 | 60.70 ± 6.0 | 0.024 | 49.70 ± 2.5 | 52.90 ± 2.5 | 0.549 | 0.163 | 0.119 |
| Vitamin C | 52.60 ± 3.1 | 51.60 ± 5.1 | 0.716 | 72.30 ± 6.8 | 70.90 ± 5.6 | 0.768 | 67.30 ± 9.0 | 78.30 ± 8.3 | 0.381 | 61.90 ± 3.6 | 63.30 ± 3.3 | 0.936 | 0.057 | 0.062 |
| Thiamin | 109.70 ± 2.7 | 104.10 ± 4.0 | 0.315 | 107.60 ± 2.6 | 109.70 ± 4.1 | 0.613 | 98.20 ± 4.9 | 120.40 ± 7.0 | 0.007 | 108.00 ± 1.9 | 108.40 ± 2.6 | 0.732 | 0.208 | 0.073 |
| Riboflavin | 92.60 ± 3.5 | 98.40 ± 5.0 |
0.428 | 106.10 ± 3.6 | 119.10 ± 4.3 |
0.036 | 102.00 ± 8.1 | 122.90 ± 7.7 |
0.068 | 98.90 ± 2.8 | 110.50 ± 3.1 | 0.016 | 0.081 | 0.018 |
| Niacin | 64.60 ± 1.9 |
63.70 ± 2.6 |
0.679 | 74.00 ± 2.3 |
72.00 ± 2.7 |
0.474 | 68.40 ± 3.2 |
86.50 ± 5.9 |
0.009 | 68.80 ± 1.4 | 69.90 ± 1.7 | 0.889 | 0.030 | 0.007 |
| Calcium | 47.90 ± 2.0 | 46.50 ± 2.0 |
0.461 | 54.70 ± 1.9 | 58.70 ± 2.4 |
0.002 | 55.20 ± 5.1 | 62.10 ± 4.3 |
0.335 | 51.30 ± 1.5 | 53.70 ± 1.6 | 0.496 | 0.222 | < 0.001 |
| Phosphorus | 103.90 ± 2.9 | 101.90 ± 3.5 |
0.503 | 115.60 ± 2.8 | 123.60 ± 3.9 |
0.143 | 117.60 ± 7.1 | 137.10 ± 6.3 |
0.024 | 109.80 ± 2.1 | 115.70 ± 2.6 | 0.204 | 0.153 | < 0.001 |
| Iron | 117.50 ± 3.5 | 113.00 ± 5.7 |
0.539 | 122.00 ± 3.1 | 133.40 ± 5.1 |
0.062 | 112.40 ± 5.8 | 127.30 ± 8.9 |
0.167 | 119.00 ± 2.2 | 123.90 ± 3.7 | 0.289 | 0.349 | 0.007 |
| MAR | 0.66 ± 0.01 |
0.65 ± 0.01 |
0.385 | 0.72 ± 0.01 |
0.73 ± 0.01 |
0.679 | 0.70 ± 0.02 | 0.76 ± 0.02 |
0.076 | 0.69 ± 0.01 | 0.70 ± 0.01 | 0.778 | 0.012 | < 0.001 |
| Characteristics | Male (n = 1,054) |
|||||||||||||
|---|---|---|---|---|---|---|---|---|---|---|---|---|---|---|
| Low income |
P-value |
Middle income |
P-value | High income |
P-value | Total |
P-value | 2019 |
2020 |
|||||
| 2019 (n = 239) | 2020 (n = 165) | 2019 (n = 289) | 2020 (n = 247) | 2019 (n = 54) | 2020 (n = 60) | 2019 (n = 582) | 2020 (n = 472) | |||||||
| Total energy (kcal/day) | 1,674.80 ± 38.20 |
1,644.00 ± 58.50 |
0.682 | 1,868.30 ± 43.80 |
1,881.40 ± 51.20 |
0.994 | 2,052.80 ± 110.70 |
1,836.50 ± 81.50 |
0.109 | 1,815.60 ± 31.20 | 1,797.70 ± 36.90 | 0.573 | 0.014 | 0.026 |
| Carbohydrate (g/1,000 kcal) | 168.40 ± 2.50 |
172.40 ± 2.40 | 0.275 | 163.80 ± 2.20 |
163.00 ± 2.90 | 0.863 | 152.20 ± 3.90 |
161.30 ± 4.90 | 0.146 | 164.20 ± 1.60 | 165.80 ± 2.00 | 0.475 | 0.017 | 0.043 |
| Fat (g/1,000 kcal) | 15.70 ± 0.60 |
15.60 ± 0.70 |
0.914 | 18.50 ± 0.50 |
19.90 ± 0.90 |
0.231 | 21.30 ± 0.90c | 19.90 ± 1.50 |
0.453 | 17.80 ± 0.40 | 18.50 ± 0.60 | 0.430 | < 0.001 | < 0.001 |
| Protein (g/1,000 kcal) | 34.70 ± 0.70 | 32.90 ± 0.70 |
0.067 | 35.20 ± 0.60 | 35.20 ± 0.90 |
0.980 | 37.10 ± 0.90 | 37.30 ± 1.30 |
0.945 | 35.20 ± 0.40 | 34.70 ± 0.40 | 0.431 | 0.662 | 0.005 |
| Fiber (g/1,000 kcal) | 15.10 ± 0.40 | 14.80 ± 0.50 |
0.668 | 15.20 ± 0.40 | 15.80 ± 0.40 |
0.289 | 14.20 ± 0.70 | 17.00 ± 0.80 |
0.008 | 15.10 ± 0.30 | 15.60 ± 0.30 | 0.193 | 0.559 | 0.021 |
| Vitamin A (μgRAE/1,000 kcal) | 189.40 ± 14.30 | 150.50 ± 8.70 |
0.023 | 198.30 ± 16.50 | 210.60 ± 12.70 |
0.568 | 179.00 ± 14.60 | 223.60 ± 24.60 |
0.125 | 192.70 ± 10.30 | 192.90 ± 7.70 | 0.972 | 0.578 | < 0.001 |
| Vitamin C (mg/1,000 kcal) | 30.60 ± 1.90 | 31.20 ± 4.60 | 0.900 | 37.20 ± 2.70 | 35.50 ± 2.90 | 0.698 | 29.90 ± 3.50 | 41.30 ± 5.00 | 0.071 | 33.90 ± 1.60 | 34.90 ± 2.20 | 0.712 | 0.085 | 0.423 |
| Thiamin (mg/1,000 kcal) | 0.75 ± 0.01 | 0.68 ± 0.01 | 0.007 | 0.73 ± 0.01 | 0.65 ± 0.01 | 0.001 | 0.66 ± 0.03 | 0.69 ± 0.02 | 0.550 | 0.73 ± 0.01 | 0.67 ± 0.01 | < 0.001 | 0.078 | 0.260 |
| Riboflavin (mg/1,000 kcal) | 0.71 ± 0.02 | 0.74 ± 0.03 |
0.357 | 0.79 ± 0.02 | 0.82 ± 0.02 |
0.270 | 0.84 ± 0.04 | 0.87 ± 0.04 |
0.677 | 0.76 ± 0.01 | 0.80 ± 0.01 | 0.127 | 0.058 | 0.037 |
| Niacin (mgNE/1,000 kcal) | 6.40 ± 0.17 | 6.06 ± 0.16 | 0.158 | 6.60 ± 0.17 | 6.39 ± 0.12 | 0.305 | 6.09 ± 0.27 | 6.43 ± 0.25 | 0.370 | 6.47 ± 0.11 | 6.29 ± 0.09 | 0.210 | 0.382 | 0.510 |
| Calcium (mg/1,000 kcal) | 295.80 ± 12.80 | 253.60 ± 10.50 |
0.011 | 295.60 ± 10.20 | 286.20 ± 9.30 |
0.504 | 297.30 ± 20.20 | 316.30 ± 15.90 |
0.465 | 295.90 ± 8.00 | 279.80 ± 7.10 | 0.135 | 0.990 | < 0.001 |
| Phosphorus (mg/1,000 kcal) | 554.20 ± 10.70 | 531.40 ± 11.10 |
0.141 | 571.30 ± 8.80 | 563.30 ± 9.30 |
0.555 | 582.50 ± 25.80 | 604.10 ± 17.60 |
0.480 | 566.00 ± 6.80 | 558.70 ± 6.80 | 0.438 | 0.361 | < 0.001 |
| Sodium (mg/1,000 kcal) | 1,970.20 ± 62.10 | 1,936.10 ± 69.50 | 0.709 | 1,842.90 ± 49.20 | 1,875.90 ± 44.30 | 0.656 | 1,907.00 ± 102.20 | 1,779.10 ± 120.70 | 0.400 | 1,898.50 ± 36.70 | 1,881.80 ± 33.00 | 0.756 | 0.169 | 0.801 |
| Potassium (mg/1,000 kcal) | 1,552.80 ± 44.80 | 1,581.30 ± 43.20 |
0.646 | 1,592.80 ± 34.90 | 1,676.80 ± 31.90 |
0.062 | 1,563.00 ± 68.00 | 1,789.10 ± 52.70 |
0.008 | 1,574.20 ± 27.20 | 1,661.60 ± 24.40 | 0.017 | 0.763 | 0.001 |
| Iron (mg/1,000 kcal) | 6.77 ± 0.19 | 6.09 ± 0.22 |
0.022 | 7.04 ± 0.24 | 6.48 ± 0.20 |
0.064 | 6.58 ± 0.33 | 7.17 ± 0.34 |
0.214 | 6.89 ± 0.14 | 6.45 ± 0.14 | 0.030 | 0.472 | 0.016 |
| % Energy from carbohydrate | 70.30 ± 0.70 |
71.60 ± 0.90 |
0.320 | 67.70 ± 0.60 |
66.80 ± 1.00 |
0.483 | 63.90 ± 1.20c | 66.00 ± 1.70 |
0.341 | 68.30 ± 0.50 | 68.20 ± 0.70 | 0.963 | 0.001 | < 0.001 |
| % Energy from fat | 14.90 ± 0.60 |
14.60 ± 0.70 |
0.797 | 17.40 ± 0.50 |
18.60 ± 0.90 |
0.303 | 20.30 ± 0.90c | 18.40 ± 1.40 |
0.268 | 16.80 ± 0.30 | 17.20 ± 0.60 | 0.607 | < 0.001 | < 0.001 |
| % Energy from protein | 14.70 ± 0.30 | 13.70 ± 0.20 |
0.023 | 14.70 ± 0.20 | 14.50 ± 0.20 |
0.581 | 15.60 ± 0.70 | 15.50 ± 0.60 |
0.888 | 14.80 ± 0.20 | 14.40 ± 0.10 | 0.138 | 0.672 | 0.019 |
| Characteristics | Female (n = 1,354) |
|||||||||||||
| Low income |
P-value | Middle income |
P-value | High income |
P-value | Total |
P-value | 2019 P-value | 2020 P-value | |||||
| 2019 (n = 397) | 2020 (n = 262) | 2019 (n = 323) | 2020 (n = 262) | 2019 (n = 55) | 2020 (n = 55) | 2019 (n = 775) | 2020 (n = 579) | |||||||
| Total energy (kcal/day) | 1,323.60 ± 29.60 | 1,282.50 ± 36.90 |
0.273 | 1,397.50 ± 27.30 | 1,458.80 ± 43.00 |
0.302 | 1,443.40 ± 60.20 | 1,615.10 ± 69.80 |
0.067 | 1,363.20 ± 20.70 | 1,399.20 ± 27.80 | 0.522 | 0.466 | 0.002 |
| Carbohydrate (g/1,000 kcal) | 179.30 ± 1.40 |
177.80 ± 1.80 |
0.651 | 172.50 ± 1.90 |
170.40 ± 1.70 |
0.439 | 173.80 ± 3.70 |
164.20 ± 3.30 |
0.067 | 176.10 ± 1.20 | 173.00 ± 1.30 | 0.001 | 0.024 | 0.004 |
| Fat (g/1,000 kcal) | 15.60 ± 0.50 | 16.60 ± 0.60 |
0.326 | 18.70 ± 0.60 | 19.30 ± 0.60 |
0.489 | 18.80 ± 1.30 | 21.10 ± 1.50 |
0.289 | 17.20 ± 0.40 | 18.30 ± 0.40 | 0.129 | < 0.001 | 0.021 |
| Protein (g/1,000 kcal) | 33.10 ± 0.40 | 32.40 ± 0.60 | 0.316 | 34.30 ± 0.60 | 35.10 ± 0.50 | 0.320 | 32.80 ± 1.00 | 36.00 ± 1.40 | 0.088 | 33.60 ± 0.30 | 34.00 ± 0.40 | 0.536 | 0.426 | 0.002 |
| Fiber (g/1,000 kcal) | 15.20 ± 0.30 |
17.00 ± 0.40 | 0.004 | 17.20 ± 0.40 |
18.30 ± 0.50 | 0.109 | 17.10 ± 0.80 |
17.30 ± 1.00 | 0.872 | 16.20 ± 0.20 | 17.70 ± 0.30 | 0.003 | 0.031 | 0.146 |
| Vitamin A (μgRAE/1,000 kcal) | 210.50 ± 12.90 |
205.80 ± 18.90 | 0.770 | 228.10 ± 16.60 |
247.50 ± 16.50 | 0.477 | 177.10 ± 15.30 |
238.20 ± 26.30 | 0.047 | 215.50 ± 10.30 | 228.50 ± 11.40 | 0.496 | 0.027 | 0.499 |
| Vitamin C (mg/1,000 kcal) | 38.10 ± 1.80 |
39.00 ± 3.90 | 0.890 | 49.90 ± 3.80 |
49.30 ± 4.30 | 0.849 | 45.40 ± 5.20 |
48.70 ± 4.90 | 0.658 | 43.60 ± 2.00 | 44.80 ± 2.50 | 0.891 | 0.023 | 0.337 |
| Thiamin (mg/1,000 kcal) | 0.73 ± 0.01 |
0.73 ± 0.02 | 0.849 | 0.72 ± 0.01 |
0.71 ± 0.01 | 0.656 | 0.64 ± 0.03 |
0.69 ± 0.04 | 0.385 | 0.72 ± 0.01 | 0.71 ± 0.01 | 0.760 | 0.023 | 0.666 |
| Riboflavin (mg/1,000 kcal) | 0.71 ± 0.02 |
0.79 ± 0.02 | 0.049 | 0.80 ± 0.02 |
0.87 ± 0.02 | 0.054 | 0.74 ± 0.04 |
0.83 ± 0.04 | 0.200 | 0.75 ± 0.01 | 0.83 ± 0.01 | 0.002 | 0.022 | 0.241 |
| Niacin (mgNE/1,000 kcal) | 6.03 ± 0.12 |
6.19 ± 0.16 | 0.511 | 6.70 ± 0.19 |
6.26 ± 0.14 | 0.030 | 6.16 ± 0.26 |
6.62 ± 0.36 | 0.310 | 6.35 ± 0.10 | 6.27 ± 0.10 | 0.443 | 0.017 | 0.626 |
| Calcium (mg/1,000 kcal) | 288.30 ± 9.80 | 292.20 ± 10.50 | 0.872 | 318.70 ± 10.80 | 323.90 ± 11.00 | 0.787 | 299.70 ± 20.50 | 317.30 ± 19.90 | 0.572 | 301.90 ± 7.30 | 309.50 ± 7.10 | 0.613 | 0.199 | 0.255 |
| Phosphorus (mg/1,000 kcal) | 545.30 ± 7.90 | 551.70 ± 8.60 |
0.480 | 581.00 ± 9.10 | 588.50 ± 8.00 |
0.578 | 568.40 ± 22.00 | 604.40 ± 18.90 |
0.248 | 562.00 ± 6.00 | 574.30 ± 5.70 | 0.234 | 0.066 | 0.001 |
| Sodium (mg/1,000 kcal) | 1,711.80 ± 49.60 |
1,794.00 ± 59.20 | 0.285 | 1,803.00 ± 62.00 |
1,748.80 ± 47.80 | 0.487 | 1,496.90 ± 85.90 |
1,645.90 ± 113.90 | 0.301 | 1,734.60 ± 40.80 | 1,757.30 ± 35.90 | 0.661 | 0.010 | 0.689 |
| Potassium (mg/1,000 kcal) | 1,595.70 ± 30.50 | 1,722.60 ± 32.20 | 0.008 | 1,745.80 ± 42.20 | 1,849.80 ± 38.30 | 0.097 | 1,687.80 ± 73.80 | 1,775.60 ± 59.40 | 0.361 | 1,665.30 ± 27.50 | 1,786.90 ± 22.70 | 0.002 | 0.103 | 0.051 |
| Iron (mg/1,000 kcal) | 6.58 ± 0.14 | 6.55 ± 0.24 | 0.875 | 6.77 ± 0.15 | 7.11 ± 0.21 | 0.217 | 6.11 ± 0.20 | 6.02 ± 0.42 | 0.864 | 6.63 ± 0.09 | 6.75 ± 0.15 | 0.577 | 0.064 | 0.020 |
| % Energy from carbohydrate | 72.30 ± 0.50 |
71.70 ± 0.70 |
0.622 | 69.20 ± 0.70 |
68.30 ± 0.60 |
0.400 | 69.70 ± 1.50 |
66.30 ± 1.40 |
0.118 | 70.80 ± 0.40 | 69.60 ± 0.50 | 0.156 | 0.003 | 0.003 |
| % Energy from fat | 14.20 ± 0.40 | 15.10 ± 0.60 |
0.311 | 16.90 ± 0.50 | 17.40 ± 0.50 |
0.508 | 17.00 ± 1.20 | 19.10 ± 1.30 |
0.277 | 15.50 ± 0.30 | 16.60 ± 0.40 | 0.128 | < 0.001 | 0.025 |
| % Energy from protein | 13.30 ± 0.10 | 13.10 ± 0.20 | 0.322 | 13.80 ± 0.20 | 14.10 ± 0.20 | 0.357 | 13.20 ± 0.40 | 14.50 ± 0.50 | 0.069 | 13.50 ± 0.10 | 13.70 ± 0.10 | 0.542 | 0.461 | 0.006 |
| Characteristics | Male (n = 1,054) |
|||||||||||||
|---|---|---|---|---|---|---|---|---|---|---|---|---|---|---|
| Low income |
P-value |
Middle income |
P-value | High income |
P-value | Total |
P-value | 2019 |
2020 |
|||||
| 2019 (n = 239) | 2020 (n = 165) | 2019 (n = 289) | 2020 (n = 247) | 2019 (n = 54) | 2020 (n = 60) | 2019 (n = 582) | 2020 (n = 472) | |||||||
| Grains | 3.13 ± 0.08 | 3.20 ± 0.11 | 0.644 | 3.28 ± 0.08 | 3.36 ± 0.11 | 0.619 | 3.48 ± 0.26 | 3.11 ± 0.18 | 0.249 | 3.24 ± 0.05 | 3.27 ± 0.07 | 0.803 | 0.435 | 0.418 |
| Meats, fish, eggs, legumes | 2.88 ± 0.19 |
2.49 ± 0.18 |
0.146 | 3.56 ± 0.18 |
3.57 ± 0.28 |
0.916 | 4.29 ± 0.36 |
3.68 ± 0.31 |
0.207 | 3.38 ± 0.14 | 3.23 ± 0.18 | 0.408 | 0.021 | <0.001 |
| Vegetables | 6.70 ± 0.34 | 7.24 ± 0.54 | 0.386 | 7.08 ± 0.31 | 7.85 ± 0.31 | 0.089 | 7.22 ± 0.80 | 7.51 ± 0.60 | 0.766 | 6.95 ± 0.23 | 7.61 ± 0.25 | 0.071 | 0.961 | 0.657 |
| Fruits | 1.33 ± 0.14 |
1.16 ± 0.15 |
0.412 | 2.02 ± 0.24 |
2.01 ± 0.16 |
0.963 | 1.96 ± 0.39 |
2.55 ± 0.50 |
0.350 | 1.75 ± 0.15 | 1.81 ± 0.14 | 0.809 | 0.027 | <0.001 |
| Milk & dairy products | 0.32 ± 0.05 | 0.27 ± 0.05 |
0.396 | 0.37 ± 0.04 | 0.41 ± 0.06 |
0.607 | 0.55 ± 0.13 | 0.53 ± 0.11 |
0.944 | 0.37 ± 003 | 0.38 ± 0.04 | 0.949 | 0.444 | 0.026 |
| Oils sweets | 1.12 ± 0.13 | 1.12 ± 0.13 | 0.993 | 1.41 ± 0.13 | 1.42 ± 0.11 | 0.983 | 1.47 ± 0.22 | 1.53 ± 0.29 | 0.869 | 1.31 ± 0.10 | 1.34 ± 0.08 | 0.859 | 0.300 | 0.187 |
| Characteristics | Female (n = 1,354) |
|||||||||||||
| Low income |
P-value | Middle income |
P-value | High income |
P-value | Total |
P-value | 2019 P-value | 2020 P-value | |||||
| 2019 (n = 397) | 2020 (n = 262) | 2019 (n = 323) | 2020 (n = 262) | 2019 (n = 55) | 2020 (n = 55) | 2019 (n = 775) | 2020 (n = 579) | |||||||
| Grains | 2.64 ± 0.07 | 2.50 ± 0.08 | 0.175 | 2.57 ± 0.06 | 2.60 ± 0.09 | 0.867 | 2.74 ± 0.13 | 2.85 ± 0.23 | 0.641 | 2.62 ± 0.05 | 2.58 ± 0.06 | 0.597 | 0.350 | 0.385 |
| Meats, fish, eggs, legumes | 2.05 ± 0.10 | 2.11 ± 0.18 | 0.902 | 2.32 ± 0.11 | 2.64 ± 0.15 | 0.102 | 2.29 ± 0.24 | 2.84 ± 0.28 | 0.147 | 2.18 ± 0.08 | 2.43 ± 0.11 | 0.130 | 0.507 | 0.108 |
| Vegetables | 4.91 ± 0.21 | 5.48 ± 0.28 | 0.123 | 5.68 ± 0.37 | 6.19 ± 0.30 | 0.378 | 5.29 ± 0.43 | 6.10 ± 0.56 | 0.259 | 5.26 ± 0.19 | 5.87 ± 0.19 | 0.051 | 0.565 | 0.448 |
| Fruits | 1.52 ± 0.13 |
1.38 ± 0.15 |
0.345 | 2.10 ± 0.16 |
2.27 ± 0.21 |
0.578 | 1.93 ± 0.31 |
2.55 ± 0.45 |
0.260 | 1.79 ± 0.10 | 1.92 ± 0.14 | 0.696 | 0.035 | <0.001 |
| Milk & dairy products | 0.39 ± 0.04 | 0.38 ± 0.05 | 0.880 | 0.44 ± 0.04 | 0.49 ± 0.06 | 0.542 | 0.65 ± 0.12 | 0.71 ± 0.12 | 0.756 | 0.43 ± 0.03 | 0.47 ± 0.04 | 0.607 | 0.146 | 0.073 |
| Oils sweets | 1.00 ± 0.12 | 0.85 ± 0.07 |
0.251 | 1.10 ± 0.08 | 1.25 ± 0.10 |
0.260 | 1.17 ± 0.18 | 1.63 ± 0.21 |
0.111 | 1.06 ± 0.07 | 1.12 ± 0.06 | 0.623 | 0.740 | <0.001 |
| Characteristics | Living alone (n = 570) |
P-value |
With spouse (n = 1185) |
P-value | With spouse & children (n = 201) |
P-value | Single with children (n = 101) |
P-value | Other (n = 351) |
P-value | Total (n = 2408) |
P-value | 2019 |
2020 |
||||||
|---|---|---|---|---|---|---|---|---|---|---|---|---|---|---|---|---|---|---|---|---|
| 2019 (n = 324) | 2020 (n = 246) | 2019 (n = 658) | 2020 (n = 527) | 2019 (n = 116) | 2020 (n = 85) | 2019 (n = 59) | 2020 (n = 42) | 2019 (n = 200) | 2020 (n = 151) | 2019 (n = 1,357) | 2020 (n=1,051) | |||||||||
| Energy | 89.32 ± 2.06 | 82.73 ± 2.13 |
0.015 | 89.88 ± 1.29 | 93.23 ± 1.69 |
0.137 | 97.68 ± 3.78 | 83.31 ± 4.17 |
0.015 | 89.95 ± 4.65 | 87.89 ± 5.80 |
0.652 | 84.75 ± 2.33 | 96.53 ± 3.77 |
0.026 | 89.74 ± 1.02 | 90.33 ± 1.51 | 0.936 | 0.177 | < 0.001 |
| Protein | 95.62 ± 3.11 |
88.31 ± 3.02 |
0.054 | 100.63 ± 2.07 |
107.50 ± 2.54 |
0.047 | 114.59 ± 5.98 |
94.70 ± 6.69 |
0.034 | 90.95 ± 6.44 |
97.15 ± 7.51 |
0.636 | 90.70 ± 2.72 |
101.12 ± 5.46 |
0.293 | 98.84 ± 1.65 | 100.59 ± 2.16 | 0.794 | 0.027 | 0.001 |
| Vitamin A | 44.72 ± 2.64 | 39.35 ± 2.64 |
0.099 | 51.50 ± 2.75 | 56.11 ± 2.77 |
0.241 | 70.44 ± 14.77 | 51.15 ± 7.32 |
0.265 | 55.93 ± 12.68 | 55.38 ± 8.24 |
0.880 | 43.59 ± 3.94 | 49.84 ± 4.92 |
0.505 | 51.06 ± 2.60 | 50.99 ± 1.94 | 0.794 | 0.213 | 0.005 |
| Vitamin C | 53.24 ± 3.54 | 58.90 ± 5.33 | 0.489 | 61.89 ± 3.38 | 65.97 ± 4.05 | 0.470 | 64.61 ± 5.88 | 62.35 ± 9.62 | 0.912 | 78.89 ± 13.18 | 49.05 ± 7.45 | 0.041 | 63.81 ± 8.39 | 57.93 ± 5.57 | 0.333 | 61.70 ± 2.83 | 61.92 ± 2.76 | 0.851 | 0.256 | 0.346 |
| Thiamin | 110.64 ± 3.05 | 100.68 ± 3.30 | 0.031 | 114.41 ± 2.21 | 111.57 ± 2.54 | 0.439 | 118.93 ± 7.73 | 100.16 ± 8.18 | 0.109 | 109.81 ± 7.90 | 96.61 ± 6.65 | 0.199 | 106.24 ± 3.41 | 115.37 ± 5.02 | 0.180 | 112.43 ± 1.68 | 108.06 ± 2.08 | 0.099 | 0.391 | 0.005 |
| Riboflavin | 95.46 ± 3.38 | 94.82 ± 3.53 |
0.759 | 100.96 ± 2.84 | 117.18 ± 3.24 |
<0.001 | 116.54 ± 7.57 | 102.07 ± 7.95 |
0.239 | 97.43 ± 9.75 | 107.27 ± 9.92 |
0.531 | 98.30 ± 5.35 | 105.08 ± 5.88 |
0.727 | 100.88 ± 2.49 | 108.41 ± 2.83 | 0.076 | 0.473 | < 0.001 |
| Niacin | 71.09 ± 2.51 | 67.73 ± 2.54 |
0.229 | 80.20 ± 1.88 | 80.54 ± 2.07 |
0.881 | 81.33 ± 4.46 | 71.77 ± 5.16 |
0.186 | 68.68 ± 3.85 | 59.07 ± 4.13 |
0.055 | 70.61 ± 2.81 | 77.92 ± 4.16 |
0.415 | 76.08 ± 1.35 | 75.48 ± 1.65 | 0.579 | 0.028 | < 0.001 |
| Calcium | 53.49 ± 2.13 |
52.10 ± 2.34 |
0.434 | 66.98 ± 2.14 |
67.50 ± 1.93 |
0.930 | 74.65 ± 4.93 |
59.35 ± 3.93 |
0.018 | 54.30 ± 6.45 |
50.07 ± 4.83 |
0.542 | 53.67 ± 3.26 |
59.62 ± 3.27 |
0.509 | 61.95 ± 1.58 | 61.25 ± 1.60 | 0.483 | < 0.001 | < 0.001 |
| Phosphorus | 113.64 ± 3.27 |
112.46 ± 3.87 |
0.585 | 132.22 ± 2.50 |
139.15 ± 2.93 |
0.093 | 147.36 ± 6.84 |
118.73 ± 6.62 |
0.003 | 114.64 ± 7.91 |
113.22 ± 7.71 |
0.758 | 111.99 ± 3.88 |
124.71 ± 5.52 |
0.259 | 125.47 ± 2.08 | 127.75 ± 2.46 | 0.766 | < 0.001 | < 0.001 |
| Iron | 123.14 ± 4.47 | 110.63 ± 4.19 | 0.030 | 131.37 ± 3.00 | 135.30 ± 4.61 | 0.492 | 140.76 ± 7.28 | 108.39 ± 6.65 | 0.001 | 116.02 ± 7.17 | 104.95 ± 8.38 | 0.234 | 117.52 ± 3.82 | 136.38 ± 9.54 |
0.129 | 127.38 ± 2.05 | 126.11 ± 3.28 | 0.595 | 0.016 | < 0.001 |
| MAR | 0.68 ± 0.01 |
0.66 ± 0.01 |
0.211 | 0.73 ± 0.01 |
0.75 ± 0.01 |
0.175 | 0.76 ± 0.01 |
0.70 ± 0.02 |
0.129 | 0.69 ± 0.03 |
0.67 ± 0.03 |
0.564 | 0.68 ± 0.01 |
0.71 ± 0.01 |
0.460 | 0.71 ± 0.01 | 0.72 ± 0.01 | 0.955 | 0.002 | < 0.001 |
Table 1. Socio-demographic characteristics of study participants by sex and survey year
n (%)
Table 2. Changes in nutrient intake (%RNI1)) of Korean older adults during COVID-19 pandemic by income level
%, Mean ± SE Estimated Energy Requirements (EER) for total energy, Recommended Nutrient Intake (RNI) for protein, vitamin A, vitamin C, thiamin, riboflavin, niacin, calcium, phosphorus and iron. : Values with different superscripts in a row are significantly different from each other at MAR: Mean Adequacy Ratio
Table 3. Changes in energy intake and nutrient density of Korean older adults during COVID-19 pandemic by income level
Mean ± SE : Values with different superscripts in a row are significantly different from each other at
Table 4. Changes in food group1) intake of Korean older adults during COVID-19 pandemic by income level
Number of servings, Mean ± SE One serving is the amount of foods providing 300 kcal for grains, 100 kcal for meat, fish, eggs and legumes, 15 kcal for vegetables, 50 kcal for fruits, 125 kcal for milk and dairy products, and 45 kcal for fats, oils & sweets based on 2020 dietary reference intake for Koreans. Number of servings = total calories from a food group/calories in single serving. : Values with different superscripts in a row are significantly different from each other at
Table 5. Changes in nutrient intake (%RNI1)) and MAR score of Korean older adults during COVID-19 pandemic by household type
%, Mean ± SE Estimated Energy Requirements (EER) for total energy, Recommended Nutrient Intake (RNI) for protein, vitamin A, vitamin C, thiamin, riboflavin, niacin, calcium, phosphorus and iron. : Values with different superscripts in a row are significantly different from each other at MAR: Mean Adequacy Ratio


