
Articles
- Page Path
- HOME > Korean J Community Nutr > Volume 29(3); 2024 > Article
-
Research Article
- Regional differences in protein intake and protein sources of Korean older adults and their association with metabolic syndrome using the 2016–2019 Korea National Health and Nutrition Examination Surveys: a cross-sectional study
-
You-Sin Lee1
 , Yoonna Lee2,†
 -
Korean Journal of Community Nutrition 2024;29(3):173-188.
DOI: https://doi.org/10.5720/kjcn.2024.29.3.173
Published online: June 30, 2024
1Adjunct Professor, Department of Home Economics Education, Dongguk University, Seoul, Korea
2Associate Professor, Department of Food and Nutrition, Shingu College, Seongnam, Korea
- †Corresponding author: Yoonna Lee Department of Food and Nutrition, Shingu College, 377 Gwangmyeong-ro, Jungwon-gu, Seongnam 13174, Korea. Tel: +82-31-740-1528 Fax: +82-31-740-1590 Email: ynlee@shingu.ac.kr
• Received: February 16, 2024 • Revised: April 6, 2024 • Accepted: May 22, 2024
© 2024 The Korean Society of Community Nutrition
This is an Open-Access article distributed under the terms of the Creative Commons Attribution Non-Commercial License (http://creativecommons.org/licenses/by-nc/3.0) which permits unrestricted non-commercial use, distribution, and reproduction in any medium, provided the original work is properly cited.
- 13,281 Views
- 130 Download
- 6 Crossref
Abstract
-
Objectives
- The study aim was to analyze the regional differences in dietary protein intake and protein sources of Korean older adults and their association with metabolic syndrome.
-
Methods
- Study participants were 1,721 older adults aged 65 and over who participated in 2016–2019 Korea National Health and Nutrition Examination Survey. Using 24-hour recall dietary intake data, protein intake and their food sources were examined. The association between protein intake and metabolic syndrome, obesity, and abdominal obesity were analyzed by multiple logistic regression.
-
Results
- Total protein and animal protein intakes were higher in urban area (60.0 g, 24.4 g, respectively) than in rural area (54.6 g, 19.6 g, respectively). With increase of protein intake level, animal to total protein proportion was increased in both areas. Total protein and plant protein intake was negatively associated with the risk of obesity, abdominal obesity in both areas. Animal protein intake was negatively associated with the risk of obesity in both areas, and with abdominal obesity only in urban area. In urban area, plant protein intake was also negatively associated with the risks of metabolic syndrome, elevated triglyceride, and reduced high density lipoprotein-cholesterol. In urban area, the risk of metabolic syndrome was decreased when their protein intake was more than 0.91 g/kg and was lowest when their protein intake was more than 1.5 g/kg (P for trend < 0.001).
-
Conclusions
- Korean older adults showed inadequate protein intake and those in rural area showed lower animal protein intake than in urban area. The risk of obesity and metabolic syndrome was decreased with the increase of protein intake level. These findings may help develop effective nutrition support strategy for older adults to reduce regional health disparity.
INTRODUCTION
METHODS
RESULTS
DISCUSSION
CONCLUSIONS
-
Conflict of Interest
There are no financial or other issues that might lead to conflict of interest.
-
Data Availability
The data that support the findings of this study are openly available in KNHANES at https://knhanes.kdca.go.kr/knhanes/sub03/sub03_02_05.do.
NOTES
Fig. 1.
Percentage of obesity, metabolic syndrome, reduced HDL-C and abdominal obesity according to protein intake per weight of Korean older adults by region. All analyses accounted for the complex sampling design effect and appropriate sampling weights. P-value by χ2 test in complex sample survey data analysis. HDL-C, high density lipoprotein-cholesterol.
**P < 0.01, ***P < 0.001.
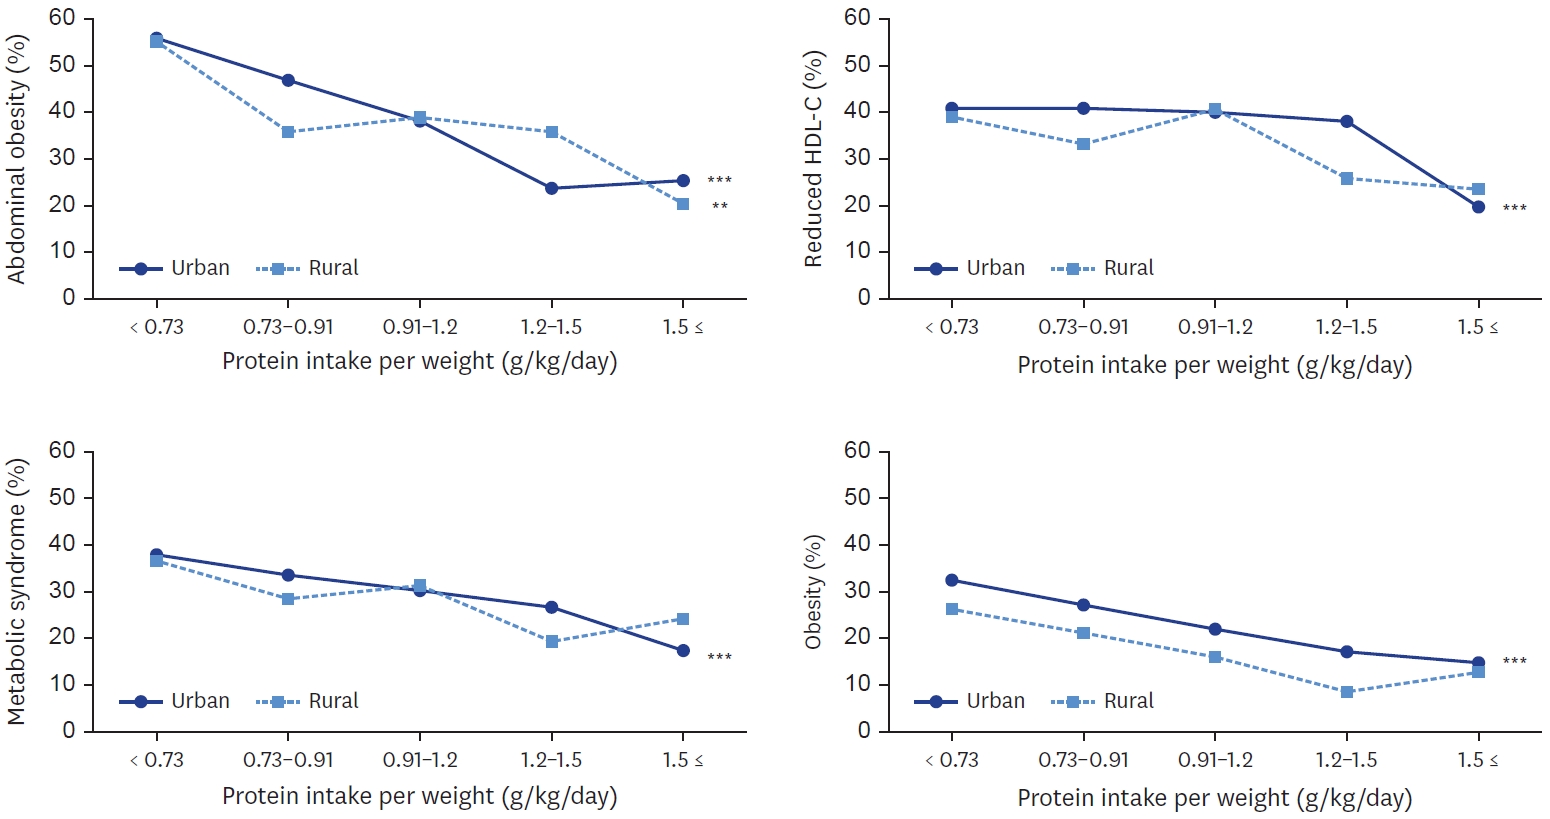
Table 1.Socio-demographic characteristics of study participants by region
Table 2.Energy and macronutrient intake of Korean older adults by region
Mean ± SE.
All analyses accounted for the complex sampling design effect and appropriate sampling weights. P-values were estimated by Student’s t-test in complex sample survey data analysis after adjusting for age, sex and energy intake (for absolute amount of nutrient intake only).
RNI, recommended nutrient intake; EAR, estimated average requirement.
Table 3.Protein intake from major food groups in Korean older adults by region
Table 4.Energy and macronutrient intake, ORs and 95% CIs for obesity and metabolic syndrome parameters according to protein intake per weight of Korean older adults by region
| Variables |
Protein intake per weight (g/kg) |
P for trend | ||||
|---|---|---|---|---|---|---|
| < 0.73 | 0.73–0.91 | 0.91–1.2 | 1.2–1.5 | ≥ 1.5 | ||
| Urban (n = 1,259) | ||||||
| Number (%) | 374 (29.7) | 227 (18.0) | 311 (24.7) | 182 (14.5) | 165 (13.1) | |
| Total energy intake (kcal/day)1) | 1,180.52 ± 20.23 | 1,556.78 ± 24.50 | 1,804.83 ± 32.29 | 2,170.44 ± 39.03 | 2,694.79 ± 53.28 | < 0.001 |
| A/T protein proportion (%) | 24.23 ± 1.10 | 33.58 ± 1.31 | 39.92 ± 1.14 | 42.75 ± 1.48 | 49.73 ± 1.57 | < 0.001 |
| % Energy from carbohydrate (%) | 76.67 ± 0.51 | 70.88 ± 0.70 | 68.37 ± 0.57 | 66.86 ± 0.65 | 62.32 ± 0.86 | < 0.001 |
| % Energy from protein (%) | 11.30 ± 0.15 | 12.92 ± 0.19 | 14.72 ± 0.20 | 15.47 ± 0.28 | 17.66 ± 0.33 | < 0.001 |
| % Energy from fat (%) | 12.01 ± 0.43 | 16.18 ± 0.59 | 16.90 ± 0.48 | 17.65 ± 0.51 | 20.01 ± 0.72 | < 0.001 |
| Abdominal obesity2) | Ref | 0.44 (0.28–0.67) | 0.29 (0.18–0.45) | 0.09 (0.05–0.16) | 0.06 (0.03–0.13) | < 0.001 |
| Elevated TG | Ref | 0.98 (0.64–1.50) | 0.80 (0.52–1.23) | 0.86 (0.51–1.45) | 0.32 (0.16–0.65) | 0.014 |
| Reduced HDL-C | Ref | 0.90 (0.60–1.36) | 0.92 (0.60–1.41) | 0.75 (0.44–1.29) | 0.22 (0.11–0.43) | 0.004 |
| Increased blood pressure | Ref | 1.03 (0.70–1.50) | 0.89 (0.61–1.31) | 0.82 (0.50–1.36) | 1.15 (0.65–2.04) | 0.748 |
| Elevated fasting glucose | Ref | 0.93 (0.64–1.37) | 0.90 (0.60–1.35) | 0.73 (0.44–1.20) | 1.30 (0.74–2.27) | 0.938 |
| Metabolic syndrome | Ref | 0.69 (0.45–1.04) | 0.55 (0.35–0.87) | 0.39 (0.22–0.69) | 0.16 (0.07–0.34) | < 0.001 |
| Obesity | Ref | 0.51 (0.34–0.78) | 0.32 (0.20–0.50) | 0.15 (0.07–0.29) | 0.07 (0.03–0.17) | < 0.001 |
| Rural (n = 462) | ||||||
| Number (%) | 170 (36.8) | 84 (18.2) | 101 (21.9) | 63 (13.6) | 44 (9.5) | |
| Total energy intake (kcal/day) | 1,194.81 ± 31.34 | 1,645.58 ± 69.30 | 1,838.46 ± 58.27 | 2,229.49 ± 84.30 | 2,506.23 ± 110.94 | < 0.001 |
| A/T protein proportion (%) | 17.49 ± 1.68 | 32.71 ± 2.67 | 36.61 ± 1.73 | 36.88 ± 2.20 | 49.00 ± 3.02 | < 0.001 |
| % Energy from carbohydrate (%) | 79.58 ± 0.69 | 73.13 ± 1.40 | 70.78 ± 0.91 | 71.41 ± 0.94 | 63.95 ± 2.23 | < 0.001 |
| % Energy from protein (%) | 10.94 ± 0.24 | 12.67 ± 0.32 | 13.74 ± 0.33 | 14.47 ± 0.40 | 18.64 ± 1.09 | < 0.001 |
| % Energy from fat (%) | 9.47 ± 0.55 | 14.19 ± 1.19 | 15.47 ± 0.78 | 14.11 ± 0.85 | 17.39 ± 1.61 | < 0.001 |
| Abdominal obesity | Ref | 0.33 (0.15–0.75) | 0.23 (0.10–0.52) | 0.20 (0.08–0.48) | 0.07 (0.02–0.24) | < 0.001 |
| Elevated TG | Ref | 0.87 (0.41–1.86) | 0.93 (0.45–1.91) | 0.30 (0.11–0.84) | 0.61 (0.22–1.65) | 0.077 |
| Reduced HDL-C | Ref | 0.73 (0.35–1.53) | 0.88 (0.42–1.82) | 0.41 (0.12–1.34) | 0.35 (0.10–1.17) | 0.121 |
| Increased blood pressure | Ref | 1.27 (0.62–2.59) | 0.91 (0.47–1.77) | 0.88 (0.38–2.04) | 1.55 (0.56–4.25) | 0.778 |
| Elevated fasting glucose | Ref | 1.12 (0.57–2.21) | 1.28 (0.56–2.91) | 0.96 (0.41–2.25) | 1.71 (0.60–4.87) | 0.436 |
| Metabolic syndrome | Ref | 0.76 (0.34–1.70) | 0.78 (0.34–1.78) | 0.43 (0.16–1.21) | 0.54 (0.18–1.64) | 0.154 |
| Obesity | Ref | 0.40 (0.18–0.89) | 0.21 (0.06–0.70) | 0.06 (0.02–0.25) | 0.09 (0.01–0.58) | 0.006 |
n (%) or mean ± SE.
All analyses accounted for the complex sampling design effect and appropriate sampling weights.
OR, odds ratio; CI, confidence interval; A/T protein proportion, animal/total protein proportion; TG, triglyceride; HDL-C: high density lipoprotein-cholesterol; Obesity, body mass index ≥ 25.0 kg/m2.
1)P-values were estimated by a multivariate regression model in complex sample survey data analysis after adjusting for age, sex and energy intake.
2)All values (ORs and 95% CIs) were derived from a multivariate logistic regression model after adjusting for age, sex household income, education level, smoking alcohol, drinking, physical activity, and energy intake.
Table 5.ORs and 95% CIs for obesity and metabolic syndrome parameters according to quartiles of daily plant and animal protein intake per weight of Korean older adults by region
Mean ± SE.
All analyses accounted for the complex sampling design effect and appropriate sampling weights.
All values (ORs and 95% CIs) were derived from a multivariate logistic regression model after adjusting for age, sex, household income, education level, smoking, alcohol drinking, physical activity, and energy intake.
OR, odds ratio; CI, confidence interval; TG, triglyceride; HDL-C, high density lipoprotein-cholesterol, Obesity, body mass index ≥ 25.0 kg/m2.
- 1. Ministry of Health and Welfare, The Korean Nutrition Society. Dietary reference intakes for Koreans 2020. Sejong: Ministry of Health and Welfare; 2020.
- 2. Ministry of Health and Welfare. 2021 National health statistics. Sejong: Ministry of Health and Welfare; 2022.
- 3. Ham H, Ha K. Trends in dietary protein intake and its adequacy among Korean adults: data from the 2010-2019 Korea National Health and Nutrition Examination Survey (KNHANES). Korean J Community Nutr 2022; 27(1): 47-60.ArticleLink
- 4. Tagawa R, Watanabe D, Ito K, Ueda K, Nakayama K, Sanbongi C, et al. Dose-response relationship between protein intake and muscle mass increase: a systematic review and meta-analysis of randomized controlled trials. Nutr Rev 2020; 79(1): 66-75.ArticlePubMedPMC
- 5. Campos-Nonato I, Hernandez L, Barquera S. Effect of a high-protein diet versus standard-protein diet on weight loss and biomarkers of metabolic syndrome: a randomized clinical trial. Obes Facts 2017; 10(3): 238-251.ArticlePubMedPMCLink
- 6. Gulati S, Misra A, Tiwari R, Sharma M, Pandey RM, Yadav CP. Effect of high-protein meal replacement on weight and cardiometabolic profile in overweight/obese Asian Indians in North India. Br J Nutr 2017; 117(11): 1531-1540.ArticlePubMed
- 7. Malik VS, Li Y, Tobias DK, Pan A, Hu FB. Dietary protein intake and risk of type 2 diabetes in US men and women. Am J Epidemiol 2016; 183(8): 715-728.ArticlePubMedPMC
- 8. Farvid MS, Cho E, Chen WY, Eliassen AH, Willett WC. Dietary protein sources in early adulthood and breast cancer incidence: prospective cohort study. BMJ 2014; 348: g3437.ArticlePubMedPMC
- 9. Levine ME, Suarez JA, Brandhorst S, Balasubramanian P, Cheng CW, Madia F, et al. Low protein intake is associated with a major reduction in IGF-1, cancer, and overall mortality in the 65 and younger but not older population. Cell Metab 2014; 19(3): 407-417.ArticlePubMedPMC
- 10. Chung S, Chung MY, Choi HK, Park JH, Hwang JT, Joung H. Animal protein intake is positively associated with metabolic syndrome risk factors in middle-aged Korean men. Nutrients 2020; 12(11): 3415.ArticlePubMedPMC
- 11. Liu R, Dang S, Yan H, Wang D, Zhao Y, Li Q, et al. Association between dietary protein intake and the risk of hypertension: a cross-sectional study from rural western China. Hypertens Res 2013; 36(11): 972-979.ArticlePubMedPDF
- 12. Huang J, Liao LM, Weinstein SJ, Sinha R, Graubard BI, Albanes D. Association between plant and animal protein intake and overall and cause-specific mortality. JAMA Intern Med 2020; 180(9): 1173-1184.ArticlePubMedPMC
- 13. Song M, Fung TT, Hu FB, Willett WC, Longo VD, Chan AT, et al. Association of animal and plant protein intake with all-cause and cause-specific mortality. JAMA Intern Med 2016; 176(10): 1453-1463.ArticlePubMedPMC
- 14. Jung HW, Kim SW, Kim IY, Lim JY, Park HS, Song W, et al. Protein intake recommendation for Korean older adults to prevent sarcopenia: expert consensus by the Korean Geriatric Society and the Korean Nutrition Society. Ann Geriatr Med Res 2018; 22(4): 167-175.ArticlePubMedPMC
- 15. Park Y, Choi JE, Hwang HS. Protein supplementation improves muscle mass and physical performance in undernourished prefrail and frail elderly subjects: a randomized, double-blind, placebo-controlled trial. Am J Clin Nutr 2018; 108(5): 1026-1033.ArticlePubMed
- 16. Kim Y, Seo S, Kwon O, Cho MS. Comparisons of dietary behavior, food intake, and satisfaction with food-related life between the elderly living in urban and rural areas. Korean J Nutr 2012; 45(3): 252-263.Article
- 17. Lim YJ, Choi YS. Dietary behaviors and seasonal diversity of food intakes of elderly women living alone as compared to those living with family in Gyeongbuk rural area. Korean J Community Nutr 2008; 13(5): 620-629.
- 18. Jang W, Ryu HK. Socio-economic factors are associated with the risk of inadequate protein intake among Korean elderly: based on the seventh Korea National Health and Nutrition Examination Survey (KNHANES VII), 2016-2018. Korean J Community Living Sci 2020; 31(2): 215-228.
- 19. Kim HJ, Kim K. Effect of geographic area on dietary quality across different age groups in Korea. Korean J Community Nutr 2019; 24(6): 453-464.ArticleLink
- 20. Park S, Kim HJ, Kim K. Do where the elderly live matter? Factors associated with diet quality among Korean elderly population living in urban versus rural areas. Nutrients 2020; 12(5): 1314.ArticlePubMedPMC
- 21. Lee Y, Choi Y, Park HR, Song KH, Lee KE, Yoo CH, et al. Comparative analysis of dietary behavior and nutrient intake of elderly in urban and rural areas for development of “Village Lunch Table” program: Based on 2014 Korea National Health and Nutrition Examination Survey data. J Nutr Health 2017; 50(2): 171.ArticleLink
- 22. Song S, Shim JE. Regional differences in dietary total fat and saturated fatty acid intake and their associations with metabolic diseases among Korean adults: Using the 2016-2019 Korea National Health and Nutrition Examination Surveys. Korean J Community Nutr 2021; 26(6): 495.ArticleLink
- 23. Kim JM, Bae YJ. Regional differences in metabolic risk in the elderly in Korea. Int J Environ Res Public Health 2022; 19(18): 11675.ArticlePubMedPMC
- 24. Opoku S, Gan Y, Fu W, Chen D, Addo-Yobo E, Trofimovitch D, et al. Prevalence and risk factors for dyslipidemia among adults in rural and urban China: findings from the China National Stroke Screening and Prevention Project (CNSSPP). BMC Public Health 2019; 19(1): 1500.ArticlePubMedPMCPDF
- 25. Khil JM. Comparison of the health and nutritional status of Korean elderly considering the household income level, using the 2018 Korea National Health and Nutrition Examination Survey. J Nutr Health 2021; 54(1): 39-53.ArticleLink
- 26. Grundy SM, Cleeman JI, Daniels SR, Donato KA, Eckel RH, Franklin BA, et al. Diagnosis and management of the metabolic syndrome: an American Heart Association/National Heart, Lung, and Blood Institute scientific statement. Curr Opin Cardiol 2006; 21(1): 1-6.PubMed
- 27. Lee SY, Park HS, Kim DJ, Han JH, Kim SM, Cho GJ, et al. Appropriate waist circumference cutoff points for central obesity in Korean adults. Diabetes Res Clin Pract 2007; 75(1): 72-80.ArticlePubMed
- 28. Ha K, Song Y, Kim HK. Regional disparities in the associations of cardiometabolic risk factors and healthy dietary factors in Korean adults. Nutr Res Pract 2020; 14(5): 519-531.ArticlePubMedPMCLink
- 29. Hernández Morante JJ, Gómez Martínez C, Morillas-Ruiz JM. Dietary factors associated with frailty in old adults: a review of nutritional interventions to prevent frailty development. Nutrients 2019; 11(1): 102.ArticlePubMedPMC
- 30. Ganapathy A, Nieves JW. Nutrition and sarcopenia - what do we know? Nutrients 2020; 12(6): 1755.ArticlePubMedPMC
- 31. Park HA. Adequacy of protein intake among Korean elderly: an analysis of the 2013-2014 Korea National Health and Nutrition Examination Survey data. Korean J Fam Med 2018; 39(2): 130-134.ArticlePubMedPMCLink
- 32. Lee S, Shin Y, Kim Y. Risk of metabolic syndrome among middle-aged Koreans from rural and urban areas. Nutrients 2018; 10(7): 859.ArticlePubMedPMC
- 33. Sundarakumar JS, Stezin A, Menesgere AL, Ravindranath V; SANSCOG and TLSA Collaborators. Ruralurban and gender differences in metabolic syndrome in the aging population from southern India: two parallel, prospective cohort studies. EClinicalMedicine 2022; 47: 101395.ArticlePubMedPMC
- 34. Singh GK, Siahpush M. Widening rural-urban disparities in all-cause mortality and mortality from major causes of death in the USA, 1969-2009. J Urban Health 2014; 91(2): 272-292.ArticlePubMedPMCPDF
- 35. Fiscal Reform Institute. There are 398 senior welfare centers nationwide, and 38 local governments do not have them. Seoul: Fiscal Reform Institute; 2021.
- 36. Song Y, Joung H. A traditional Korean dietary pattern and metabolic syndrome abnormalities. Nutr Metab Cardiovasc Dis 2012; 22(5): 456-462.ArticlePubMed
- 37. Park KB, Park HA, Kang JH, Kim K, Cho YG, Jang J. Animal and plant protein intake and body mass index and waist circumference in a Korean elderly population. Nutrients 2018; 10(5): 577.ArticlePubMedPMC
- 38. Lin Y, Bolca S, Vandevijvere S, De Vriese S, Mouratidou T, De Neve M, et al. Plant and animal protein intake and its association with overweight and obesity among the Belgian population. Br J Nutr 2011; 105(7): 1106-1116.ArticlePubMed
- 39. Deibert P, König D, Schmidt-Trucksaess A, Zaenker KS, Frey I, Landmann U, et al. Weight loss without losing muscle mass in pre-obese and obese subjects induced by a high-soy-protein diet. Int J Obes 2004; 28(10): 1349-1352.ArticlePDF
- 40. Berryman CE, Agarwal S, Lieberman HR, Fulgoni VL 3rd, Pasiakos SM. Diets higher in animal and plant protein are associated with lower adiposity and do not impair kidney function in US adults. Am J Clin Nutr 2016; 104(3): 743-749.ArticlePubMed
- 41. Bujnowski D, Xun P, Daviglus ML, Van Horn L, He K, Stamler J. Longitudinal association between animal and vegetable protein intake and obesity among men in the United States: the Chicago Western Electric Study. J Am Diet Assoc 2011 111(8): 1150-1155.e1.Article
- 42. Alkerwi A, Sauvageot N, Gilson G, Stranges S. Prevalence and correlates of vitamin D deficiency and insufficiency in Luxembourg Adults: evidence from the observation of cardiovascular risk factors (ORISCAV-LUX) study. Nutrients 2015; 7(8): 6780-6796.ArticlePubMedPMC
- 43. Kim D, Kim J. Dairy consumption is associated with a lower incidence of the metabolic syndrome in middle-aged and older Korean adults: the Korean Genome and Epidemiology Study (KoGES). Br J Nutr 2017; 117(1): 148-160.ArticlePubMed
- 44. Oh C, No JK. Appropriate protein intake is one strategy in the management of metabolic syndrome in Korean elderly to mitigate changes in body composition. Nutr Res 2018; 51: 21-28.ArticlePubMed
- 45. Hruby A, Jacques PF. Dietary protein and changes in markers of cardiometabolic health across 20 years of follow-up in middle-aged Americans. Public Health Nutr 2018; 21(16): 2998-3010.ArticlePubMedPMC
- 46. Beasley JM, Katz R, Shlipak M, Rifkin DE, Siscovick D, Kaplan R. Dietary protein intake and change in estimated GFR in the cardiovascular health study. Nutrition 2014; 30(7-8): 794-799.ArticlePubMedPMC
REFERENCES
Figure & Data
REFERENCES
Citations
Citations to this article as recorded by 
- Assessing Nutritional Factors for Metabolic Dysfunction-Associated Steatotic Liver Disease via Diverse Statistical Tools
Yea-Chan Lee, Hye Sun Lee, Soyoung Jeon, Yae-Ji Lee, Yu-Jin Kwon, Ji-Won Lee
Diabetes & Metabolism Journal.2026; 50(1): 178. CrossRef - Longitudinal Deterioration in Nutritional Status Associated With Increased Risk of Sarcopenia in Community‐Dwelling Aged Adults: A Prospective Cohort Study
Ho Jun Lim, Seung Shin Park, Mi Ji Kim, Hak Chul Jang, Sung Hye Kong, Chang Won Won
Journal of Cachexia, Sarcopenia and Muscle.2026;[Epub] CrossRef - Nutritional and environmental implications of incorporating cultivated meat into the Korean diets: a preliminary analysis
Daniel Ryu, Hae Jin Park, Yujin Ahn, Jieun Oh, Yooheon Park
Food Science and Biotechnology.2026; 35(6): 1495. CrossRef - Association between nutrient intake and frailty status in Korean older adults: a cross-sectional study using the 9th (2022–2023) Korea National Health and Nutrition Examination Survey
Hyejin Yu, Sang-Jin Chung
Korean Journal of Community Nutrition.2026; 31(2): 153. CrossRef - The association between dietary protein intake and metabolic syndrome: a GRADE-assessed systematic review and meta-analysis of observational studies
Dorsa Ghazvineh, Ali Hosseinpour, Vahid Basirat, Elnaz Daneshzad
Diabetology & Metabolic Syndrome.2025;[Epub] CrossRef - The association between total, animal-based, and plant-based protein intake and cognitive decline in older adults
Maud Peperkamp, Margreet R. Olthof, Marjolein Visser, Hanneke A. H. Wijnhoven
European Journal of Nutrition.2025;[Epub] CrossRef
 Cite
Cite- Figure
-
- We recommend
- Related articles
-
- Changing patterns and related factors of kimchi consumption among Korean adults: a nationwide cross-sectional analysis of the Korea National Health and Nutrition Examination Survey, 2010–2024
- Differences in lunch nutrient intake and nutritional adequacy among Korean older adults by meal site: a cross-sectional analysis of the 2018–2021 Korea National Health and Nutrition Examination Survey data
- Association between nutrient intake and frailty status in Korean older adults: a cross-sectional study using the 9th (2022–2023) Korea National Health and Nutrition Examination Survey
- Comparison of dietary behaviors and nutrient intake by gender and household type among older Koreans: a cross-sectional study using data from the 8th Korea National Health and Nutrition Examination Survey
- Prevalence of coronary artery disease according to lifestyle characteristics, nutrient intake level, and comorbidities among Koreans aged 40 years and older: a cross-sectional study using data from the 7th (2016–2018) Korea National Health and Nutrition Examination Survey
Regional differences in protein intake and protein sources of Korean older adults and their association with metabolic syndrome using the 2016–2019 Korea National Health and Nutrition Examination Surveys: a cross-sectional study

Fig. 1. Percentage of obesity, metabolic syndrome, reduced HDL-C and abdominal obesity according to protein intake per weight of Korean older adults by region. All analyses accounted for the complex sampling design effect and appropriate sampling weights. P-value by χ2 test in complex sample survey data analysis. HDL-C, high density lipoprotein-cholesterol.
**P < 0.01, ***P < 0.001.
Fig. 1.
Regional differences in protein intake and protein sources of Korean older adults and their association with metabolic syndrome using the 2016–2019 Korea National Health and Nutrition Examination Surveys: a cross-sectional study
| Characteristics | Total (n = 1,721) | Urban (n = 1,259) | Rural (n = 462) | P-value |
|---|---|---|---|---|
| Sex | 0.196 | |||
| Male | 849 (48.4) | 628 (49.3) | 221 (45.5) | |
| Female | 872 (51.6) | 631 (50.7) | 241 (54.5) | |
| Age (years) | < 0.001 | |||
| 65–74 | 1,143 (65.6) | 879 (68.6) | 264 (55.6) | |
| ≥ 75 | 578 (34.4) | 380 (31.4) | 198 (44.4) | |
| Household income | < 0.001 | |||
| Lowest | 410 (23.9) | 252 (20.5) | 158 (35.3) | |
| Medium-low | 410 (23.4) | 283 (21.5) | 127 (29.7) | |
| Medium-high | 440 (25.2) | 324 (25.4) | 116 (24.6) | |
| Highest | 461 (27.4) | 400 (32.6) | 61 (10.4) | |
| Education | < 0.001 | |||
| Elementary school or less | 911 (51.0) | 582 (44.7) | 329 (71.8) | |
| Middle school | 257 (15.5) | 197 (16.2) | 60 (13.1) | |
| High school | 324 (19.4) | 265 (21.4) | 59 (12.6) | |
| College or more | 229 (14.1) | 215 (17.7) | 14 (2.5) | |
| Current smoking | 0.030 | |||
| Yes | 170 (10.2) | 116 (9.4) | 54 (13.1) | |
| No | 1,551 (89.8) | 1,143 (90.6) | 408 (86.9) | |
| Current alcohol drinking | 0.147 | |||
| Yes | 652 (38.7) | 496 (39.7) | 156 (35.3) | |
| No | 1,069 (61.3) | 763 (60.3) | 306 (64.7) | |
| Walking (days/week) | < 0.001 | |||
| < 2 | 500 (27.3) | 276 (20.5) | 224 (49.7) | |
| 2–4 | 456 (27.2) | 361 (29.9) | 95 (18.2) | |
| ≥ 5 | 765 (45.5) | 622 (49.6) | 143 (32.1) |
| Energy and nutrient | Total (n = 1,721) | Urban (n = 1,259) | Rural (n = 462) | P-value |
|---|---|---|---|---|
| Total energy intake (kcal/day) | 1,740.3 ± 18.6 | 1,748.3 ± 21.2 | 1,710.0 ± 37.2 | 0.890 |
| Carbohydrate (g/day) | 296.8 ± 3.3 | 296.1 ± 3.6 | 299.4 ± 7.5 | 0.057 |
| Protein (g/day) | 58.9 ± 0.8 | 60.0 ± 0.9 | 54.6 ± 1.5 | 0.002 |
| Fat (g/day) | 29.8 ± 0.6 | 31.1 ± 0.7 | 25.0 ± 1.3 | < 0.001 |
| % Energy from | ||||
| Carbohydrate (%E) | 70.9 ± 0.3 | 70.2 ± 0.3 | 73.6 ± 0.7 | < 0.001 |
| Protein (%E) | 13.7 ± 0.1 | 13.9 ± 0.1 | 13.2 ± 0.2 | 0.008 |
| Plant protein (%E) | 8.3 ± 0.1 | 8.2 ± 0.1 | 8.5 ± 0.1 | 0.085 |
| Animal protein (%E) | 5.3 ± 0.1 | 5.5 ± 0.1 | 4.6 ± 0.2 | 0.001 |
| Fat (%E) | 15.3 ± 0.2 | 15.9 ± 0.2 | 13.2 ± 0.5 | < 0.001 |
| RNI protein (%) | 106.4 ± 1.4 | 108.4 ± 1.6 | 98.8 ± 2.5 | 0.001 |
| < EAR protein (%) | 34.5 | 33.1 | 40.2 | 0.011 |
| Food source | Total (n = 1,721) | Urban (n = 1,259) | Rural (n = 462) | P-value |
|---|---|---|---|---|
| Total plant protein (%) | 64.73 ± 0.59 | 63.60 ± 0.67 | 69.00 ± 1.18 | < 0.001 |
| Total plant protein (g/day) | 34.81 ± 0.44 | 34.93 ± 0.50 | 34.39 ± 0.89 | 0.944 |
| Grains | 18.70 ± 0.27 | 18.38 ± 0.29 | 19.33 ± 0.52 | 0.003 |
| Potato and starches | 0.72 ± 0.06 | 0.75 ± 0.07 | 0.47 ± 0.08 | 0.018 |
| Sugars | 0.04 ± 0.01 | 0.05 ± 0.01 | 0.02 ± 0.01 | 0.238 |
| Legume | 4.88 ± 0.19 | 4.92 ± 0.20 | 4.43 ± 0.42 | 0.561 |
| Nuts and Seeds | 1.13 ± 0.08 | 1.25 ± 0.11 | 0.73 ± 0.13 | 0.003 |
| Vegetables | 5.12 ± 0.10 | 5.10 ± 0.11 | 5.10 ± 0.25 | 0.544 |
| Mushrooms | 0.16 ± 0.02 | 0.19 ± 0.03 | 0.08 ± 0.01 | 0.002 |
| Fruits | 1.14 ± 0.06 | 1.23 ± 0.07 | 0.92 ± 0.13 | 0.058 |
| Seaweeds | 0.60 ± 0.04 | 0.62 ± 0.04 | 0.50 ± 0.06 | 0.059 |
| Seasoning | 2.30 ± 0.08 | 2.28 ± 0.08 | 2.29 ± 0.18 | 0.741 |
| Total animal protein (%) | 35.27 ± 0.59 | 36.40 ± 0.66 | 31.99 ± 1.18 | < 0.001 |
| Total animal protein (g/day) | 23.37 ± 0.59 | 24.36 ± 0.69 | 19.65 ± 1.03 | 0.001 |
| Meats | 10.05 ± 0.44 | 10.40 ± 0.48 | 7.95 ± 0.86 | 0.065 |
| Eggs | 3.06 ± 0.16 | 3.31 ± 0.18 | 2.15 ± 0.30 | 0.001 |
| Fish and shellfishes | 8.00 ± 0.36 | 8.07 ± 0.44 | 8.00 ± 0.62 | 0.623 |
| Milk and dairy products | 2.26 ± 0.14 | 2.51 ± 0.16 | 1.16 ± 0.19 | < 0.001 |
| Variables | Protein intake per weight (g/kg) |
P for trend | ||||
|---|---|---|---|---|---|---|
| < 0.73 | 0.73–0.91 | 0.91–1.2 | 1.2–1.5 | ≥ 1.5 | ||
| Urban (n = 1,259) | ||||||
| Number (%) | 374 (29.7) | 227 (18.0) | 311 (24.7) | 182 (14.5) | 165 (13.1) | |
| Total energy intake (kcal/day) |
1,180.52 ± 20.23 | 1,556.78 ± 24.50 | 1,804.83 ± 32.29 | 2,170.44 ± 39.03 | 2,694.79 ± 53.28 | < 0.001 |
| A/T protein proportion (%) | 24.23 ± 1.10 | 33.58 ± 1.31 | 39.92 ± 1.14 | 42.75 ± 1.48 | 49.73 ± 1.57 | < 0.001 |
| % Energy from carbohydrate (%) | 76.67 ± 0.51 | 70.88 ± 0.70 | 68.37 ± 0.57 | 66.86 ± 0.65 | 62.32 ± 0.86 | < 0.001 |
| % Energy from protein (%) | 11.30 ± 0.15 | 12.92 ± 0.19 | 14.72 ± 0.20 | 15.47 ± 0.28 | 17.66 ± 0.33 | < 0.001 |
| % Energy from fat (%) | 12.01 ± 0.43 | 16.18 ± 0.59 | 16.90 ± 0.48 | 17.65 ± 0.51 | 20.01 ± 0.72 | < 0.001 |
| Abdominal obesity |
Ref | 0.44 (0.28–0.67) | 0.29 (0.18–0.45) | 0.09 (0.05–0.16) | 0.06 (0.03–0.13) | < 0.001 |
| Elevated TG | Ref | 0.98 (0.64–1.50) | 0.80 (0.52–1.23) | 0.86 (0.51–1.45) | 0.32 (0.16–0.65) | 0.014 |
| Reduced HDL-C | Ref | 0.90 (0.60–1.36) | 0.92 (0.60–1.41) | 0.75 (0.44–1.29) | 0.22 (0.11–0.43) | 0.004 |
| Increased blood pressure | Ref | 1.03 (0.70–1.50) | 0.89 (0.61–1.31) | 0.82 (0.50–1.36) | 1.15 (0.65–2.04) | 0.748 |
| Elevated fasting glucose | Ref | 0.93 (0.64–1.37) | 0.90 (0.60–1.35) | 0.73 (0.44–1.20) | 1.30 (0.74–2.27) | 0.938 |
| Metabolic syndrome | Ref | 0.69 (0.45–1.04) | 0.55 (0.35–0.87) | 0.39 (0.22–0.69) | 0.16 (0.07–0.34) | < 0.001 |
| Obesity | Ref | 0.51 (0.34–0.78) | 0.32 (0.20–0.50) | 0.15 (0.07–0.29) | 0.07 (0.03–0.17) | < 0.001 |
| Rural (n = 462) | ||||||
| Number (%) | 170 (36.8) | 84 (18.2) | 101 (21.9) | 63 (13.6) | 44 (9.5) | |
| Total energy intake (kcal/day) | 1,194.81 ± 31.34 | 1,645.58 ± 69.30 | 1,838.46 ± 58.27 | 2,229.49 ± 84.30 | 2,506.23 ± 110.94 | < 0.001 |
| A/T protein proportion (%) | 17.49 ± 1.68 | 32.71 ± 2.67 | 36.61 ± 1.73 | 36.88 ± 2.20 | 49.00 ± 3.02 | < 0.001 |
| % Energy from carbohydrate (%) | 79.58 ± 0.69 | 73.13 ± 1.40 | 70.78 ± 0.91 | 71.41 ± 0.94 | 63.95 ± 2.23 | < 0.001 |
| % Energy from protein (%) | 10.94 ± 0.24 | 12.67 ± 0.32 | 13.74 ± 0.33 | 14.47 ± 0.40 | 18.64 ± 1.09 | < 0.001 |
| % Energy from fat (%) | 9.47 ± 0.55 | 14.19 ± 1.19 | 15.47 ± 0.78 | 14.11 ± 0.85 | 17.39 ± 1.61 | < 0.001 |
| Abdominal obesity | Ref | 0.33 (0.15–0.75) | 0.23 (0.10–0.52) | 0.20 (0.08–0.48) | 0.07 (0.02–0.24) | < 0.001 |
| Elevated TG | Ref | 0.87 (0.41–1.86) | 0.93 (0.45–1.91) | 0.30 (0.11–0.84) | 0.61 (0.22–1.65) | 0.077 |
| Reduced HDL-C | Ref | 0.73 (0.35–1.53) | 0.88 (0.42–1.82) | 0.41 (0.12–1.34) | 0.35 (0.10–1.17) | 0.121 |
| Increased blood pressure | Ref | 1.27 (0.62–2.59) | 0.91 (0.47–1.77) | 0.88 (0.38–2.04) | 1.55 (0.56–4.25) | 0.778 |
| Elevated fasting glucose | Ref | 1.12 (0.57–2.21) | 1.28 (0.56–2.91) | 0.96 (0.41–2.25) | 1.71 (0.60–4.87) | 0.436 |
| Metabolic syndrome | Ref | 0.76 (0.34–1.70) | 0.78 (0.34–1.78) | 0.43 (0.16–1.21) | 0.54 (0.18–1.64) | 0.154 |
| Obesity | Ref | 0.40 (0.18–0.89) | 0.21 (0.06–0.70) | 0.06 (0.02–0.25) | 0.09 (0.01–0.58) | 0.006 |
| Variables | Q1 | Q2 | Q3 | Q4 | P for trend |
|---|---|---|---|---|---|
| Urban | |||||
| Plant protein intake (n = 1,259) | 314 | 315 | 315 | 315 | |
| Mean intake (g/kg/day) | 0.32 ± 0.01 | 0.48 ± 0.00 | 0.64 ± 0.00 | 0.97 ± 0.02 | |
| Abdominal obesity | Ref | 0.42 (0.28–0.63) | 0.23 (0.15–0.36) | 0.08 (0.04–0.14) | < 0.001 |
| Elevated TG | Ref | 0.81 (0.54–1.22) | 0.83 (0.54–1.28) | 0.52 (0.30–0.88) | 0.022 |
| Reduced HDL-C | Ref | 0.83 (0.55–1.24) | 0.68 (0.43–1.07) | 0.39 (0.24–0.64) | 0.001 |
| Increased blood pressure | Ref | 0.88 (0.60–1.29) | 0.79 (0.52–1.20) | 0.92 (0.58–1.44) | 0.494 |
| Elevated fasting glucose | Ref | 0.88 (0.60–1.30) | 0.67 (0.46–0.99) | 0.76 (0.46–1.25) | 0.118 |
| Metabolic syndrome | Ref | 0.63 (0.42–0.95) | 0.50 (0.32–0.78) | 0.23 (0.13–0.39) | < 0.001 |
| Obesity | Ref | 0.51 (0.35–0.75) | 0.29 (0.18–0.45) | 0.11 (0.06–0.20) | < 0.001 |
| Animal protein intake (n = 1,259) | 314 | 315 | 315 | 315 | |
| Mean intake (g/kg/day) | 0.07 ± 0.00 | 0.24 ± 0.00 | 0.43 ± 0.00 | 0.87 ± 0.02 | |
| Abdominal obesity | Ref | 0.75 (0.52–1.07) | 0.69 (0.47–1.02) | 0.54 (0.34–0.85) | 0.014 |
| Elevated TG | Ref | 0.95 (0.64–1.43) | 1.04 (0.70–1.55) | 0.92 (0.56–1.52) | 0.859 |
| Reduced HDL-C | Ref | 1.12 (0.76–1.66) | 1.17 (0.81–1.69) | 0.93 (0.58–1.48) | 0.765 |
| Increased blood pressure | Ref | 0.75 (0.53–1.06) | 0.75 (0.52–1.10) | 1.05 (0.70–1.59) | 0.854 |
| Elevated fasting glucose | Ref | 1.01 (0.70–1.47) | 0.79 (0.53–1.16) | 1.05 (0.69–1.60) | 0.841 |
| Metabolic syndrome | Ref | 1.00 (0.69–1.45) | 0.84 (0.57–1.25) | 0.86 (0.53–1.37) | 0.413 |
| Obesity | Ref | 0.71 (0.47–1.05) | 0.64 (0.42–0.97) | 0.48 (0.29–0.78) | 0.005 |
| Rural | |||||
| Plant protein intake (n = 462) | 116 | 115 | 115 | 116 | |
| Mean intake (g/kg/day) | 0.33 ± 0.00 | 0.49 ± 0.00 | 0.64 ± 0.01 | 0.97 ± 0.03 | |
| Abdominal obesity | Ref | 0.51 (0.26–0.98) | 0.23 (0.10–0.51) | 0.06 (0.02–0.14) | < 0.001 |
| Elevated TG | Ref | 1.29 (0.59–2.80) | 0.80 (0.32–2.03) | 1.10 (0.39–3.10) | 0.897 |
| Reduced HDL-C | Ref | 2.06 (0.91–4.67) | 1.62 (0.74–3.57) | 2.08 (0.76–5.68) | 0.247 |
| Increased blood pressure | Ref | 1.26 (0.68–2.34) | 1.70 (0.85–3.41) | 1.18 (0.48–2.88) | 0.592 |
| Elevated fasting glucose | Ref | 0.45 (0.22–0.92) | 1.24 (0.70–2.20) | 0.83 (0.36–1.89) | 0.717 |
| Metabolic syndrome | Ref | 1.06 (0.46–2.40) | 0.79 (0.36–1.73) | 0.59 (0.23–1.48) | 0.200 |
| Obesity | Ref | 0.48 (0.21–1.11) | 0.20 (0.08–0.53) | 0.09 (0.03–0.32) | < 0.001 |
| Animal protein intake (n = 462) | 115 | 116 | 116 | 115 | |
| Mean intake (g/kg/day) | 0.03 ± 0.00 | 0.18 ± 0.01 | 0.35 ± 0.01 | 0.75 ± 0.04 | |
| Abdominal obesity | Ref | 1.21 (0.65–2.25) | 1.76 (0.89–3.50) | 0.80 (0.42–1.53) | 0.892 |
| Elevated TG | Ref | 0.79 (0.34–1.62) | 0.98 (0.48–2.03) | 0.61 (0.27–1.35) | 0.232 |
| Reduced HDL-C | Ref | 0.64 (0.29–1.44) | 0.58 (0.30–1.13) | 0.41 (0.18–0.95) | 0.055 |
| Increased blood pressure | Ref | 1.52 (0.82–2.82) | 1.15 (0.65–2.02) | 0.97 (0.54–1.76) | 0.904 |
| Elevated fasting glucose | Ref | 1.21 (0.69–2.10) | 0.99 (0.55–1.76) | 0.97 (0.54–1.75) | 0.799 |
| Metabolic syndrome | Ref | 0.73 (0.33–1.61) | 0.82 (0.44–1.55) | 0.57 (0.26–1.23) | 0.172 |
| Obesity | Ref | 1.01 (0.50–2.03) | 0.77 (0.40–1.49) | 0.37 (0.18–0.74) | 0.008 |
Table 1. Socio-demographic characteristics of study participants by region
n (%). All analyses accounted for the complex sampling design effect and appropriate sampling weights.
Table 2. Energy and macronutrient intake of Korean older adults by region
Mean ± SE. All analyses accounted for the complex sampling design effect and appropriate sampling weights. RNI, recommended nutrient intake; EAR, estimated average requirement.
Table 3. Protein intake from major food groups in Korean older adults by region
Mean ± SE. All analyses accounted for the complex sampling design effect and appropriate sampling weights.
Table 4. Energy and macronutrient intake, ORs and 95% CIs for obesity and metabolic syndrome parameters according to protein intake per weight of Korean older adults by region
n (%) or mean ± SE. All analyses accounted for the complex sampling design effect and appropriate sampling weights. OR, odds ratio; CI, confidence interval; A/T protein proportion, animal/total protein proportion; TG, triglyceride; HDL-C: high density lipoprotein-cholesterol; Obesity, body mass index ≥ 25.0 kg/m2. All values (ORs and 95% CIs) were derived from a multivariate logistic regression model after adjusting for age, sex household income, education level, smoking alcohol, drinking, physical activity, and energy intake.
Table 5. ORs and 95% CIs for obesity and metabolic syndrome parameters according to quartiles of daily plant and animal protein intake per weight of Korean older adults by region
Mean ± SE. All analyses accounted for the complex sampling design effect and appropriate sampling weights. All values (ORs and 95% CIs) were derived from a multivariate logistic regression model after adjusting for age, sex, household income, education level, smoking, alcohol drinking, physical activity, and energy intake. OR, odds ratio; CI, confidence interval; TG, triglyceride; HDL-C, high density lipoprotein-cholesterol, Obesity, body mass index ≥ 25.0 kg/m2.


