
Articles
- Page Path
- HOME > Korean J Community Nutr > Volume 29(3); 2024 > Article
-
Research Article
- Relationship of sodium index with the obesity indicators of university students in Daegu, South Korea: a cross-sectional study
-
Young-Won Jang1
 , Jian Ma1, Yeon-Kyung Lee2,†
 -
Korean Journal of Community Nutrition 2024;29(3):189-198.
DOI: https://doi.org/10.5720/kjcn.2024.29.3.189
Published online: June 30, 2024
1Student, Department of Food Science and Nutrition, Kyungpook National University, Daegu, Korea
2Professor, Department of Food Science and Nutrition, Kyungpook National University, Daegu, Korea
- †Corresponding author: Yeon-Kyung Lee Department of Food Science and Nutrition, Kyungpook National University, 80 Daehak-ro, Buk-gu, Daegu 41566, Korea. Tel: +82-53-950-6234 Fax: +82-53-650-6229 Email: yklee@knu.ac.kr
• Received: February 16, 2024 • Revised: April 14, 2024 • Accepted: April 22, 2024
© 2024 The Korean Society of Community Nutrition
This is an Open-Access article distributed under the terms of the Creative Commons Attribution Non-Commercial License (http://creativecommons.org/licenses/by-nc/3.0) which permits unrestricted non-commercial use, distribution, and reproduction in any medium, provided the original work is properly cited.
- 6,847 Views
- 50 Download
- 1 Crossref
Abstract
-
Objectives
- The sodium index is an index that converts the estimated sodium intake calculated using a verified and reliable sodium estimation formula. This study aimed to determine the relationship between the sodium index and obesity indicators and the potential impact of excessive sodium consumption on obesity.
-
Methods
- Obesity indicators, such as body mass index (BMI), body fat percentage, waist-to-hip ratio (WHR), and visceral fat levels, were analyzed in 120 university students (60 men and 60 women). The sodium index was calculated by indexing the estimated sodium intake according to age, sex, BMI, salt-eating habits, and salt-eating behaviors. The relationship between sodium index and obesity indicators was analyzed using multiple logistic regression.
-
Results
- The estimated sodium intake was 3,907.1 mg, with 76.7% of the participants categorized under the “careful” level of sodium index and 10.8% under the “moderate” level. As the sodium index increased, the BMI, body fat percentage, WHR, and visceral fat levels significantly increased. All obesity indicators significantly increased in patients with a “severe” sodium index than in those with a “moderate” sodium index. In addition, a strong positive correlation was identified between obesity indicators and sodium index. When the “severe” sodium index was compared with the “moderate” sodium index, the risk of obesity based on body fat percentage increased by 2.181 times (95% confidence interval [CI], 1.526–3.118), while the risk of obesity based on visceral fat level increased by 4.073 times (95% CI, 2.097–7.911).
-
Conclusions
- Our findings suggest a correlation between excessive sodium intake and obesity. Moreover, the sodium index can be used to determine sodium intake.
INTRODUCTION
METHODS
RESULTS
DISCUSSION
CONCLUSIONS
-
Conflict of Interest
There are no financial or other issues that might lead to conflict of interest.
-
Data Availability
The participants of this study did not give written consent for their data to be shared publicly, so due to the sensitive nature of the research supporting data is not available.
NOTES
Fig. 1.Comparison of obesity index according to sodium index. (A) Body mass index; (B) Body fat percentage; (C) Waist-to-hip ratio; (D) Visceral fat. Bars indicate the mean ± standard error. Means with different lower case letters in the same column are significantly different by Duncan’s multiple range test with a P-value of < 0.05.
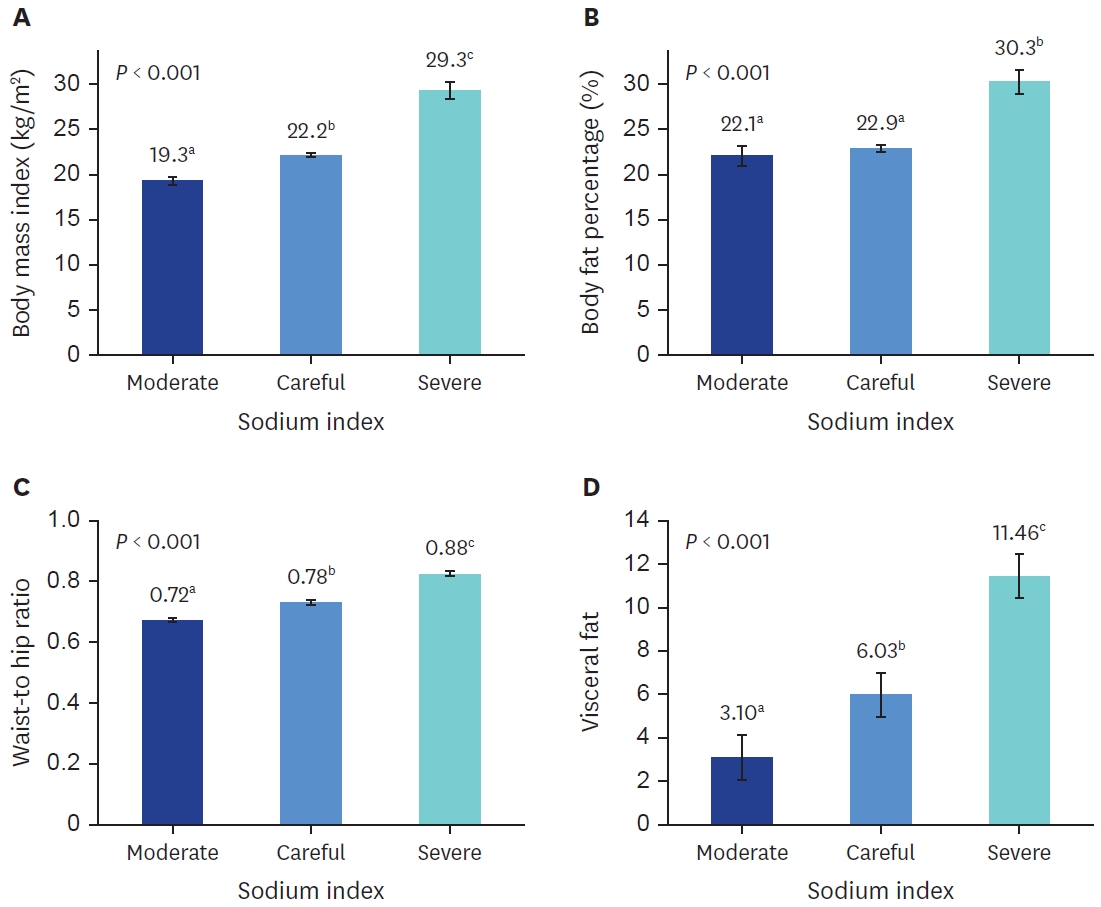
Table 1.Obesity indicators and sodium index of participants
Table 2.Dietary habits and dietary behavior of participants
| Variables | Total (n = 120) | Men (n = 60) | Women (n = 60) | P-value |
|---|---|---|---|---|
| Dietary habits1) | ||||
| Do you usually eat salty? | 32.0 ± 9.6 | 32.5 ± 9.3 | 31.5 ± 10.1 | 0.573 |
| Dietary behaviors | ||||
| I eat all of the noodle soup liquid.2) | 5.63 ± 2.6 | 5.7 ± 2.6 | 5.57 ± 2.6 | 0.783 |
| I habitually add salt or sauce to food.2) | 6.65 ± 2.5 | 6.43 ± 2.6 | 6.87 ± 2.3 | 0.348 |
| I add a lot of soy sauce or red pepper paste to sliced rat fish, Korean pancakes (Jeon), or fried food.2) | 6.23 ± 2.5 | 6.00 ± 2.6 | 6.47 ± 2.5 | 0.322 |
| I check the sodium content when I buy processed foods.2)4) | 8.27 ± 2.5 | 8.53 ± 2.3 | 8.00 ± 2.7 | 0.254 |
| I ask them to cook blandly when I eat out.2)4) | 8.95 ± 1.7 | 8.83 ± 1.9 | 9.07 ± 1.6 | 0.479 |
| How often do you eat Korean soup or stew?3) | 5.80 ± 2.1 | 5.83 ± 1.9 | 5.77 ± 2.2 | 0.864 |
| How often do you eat kimchi?3) | 6.22 ± 2.3 | 6.17 ± 2.3 | 6.27 ± 2.4 | 0.819 |
| How often do you eat salted dry fish as a side dish?3) | 2.58 ± 1.0 | 2.67 ± 1.2 | 2.50 ± 0.8 | 0.401 |
| How often do you eat nuts for a snack?3)4) | 9.03 ± 1.6 | 9.00 ± 1.6 | 9.07 ± 1.7 | 0.829 |
| How often do you eat fruits?3)4) | 7.52 ± 2.2 | 7.83 ± 1.9 | 7.20 ± 2.3 | 0.118 |
| Total | 66.88 ± 9.4 | 67.0 ± 8.5 | 66.8 ± 10.2 | 0.893 |
Mean ± SD.
Using t-test.
1)Unsalty: 10, slightly unsalty: 20, neither unsalty nor salty: 30, slightly salty: 40, and salty: 50.
2)Not at all: 2, slightly: 4, moderately: 6, very: 8, and extremely: 10.
3)< 3 times/month: 2, 1–2 times/week: 4, 3–6 times/week: 8, once/day: 8, and 2–3 times/day: 10.
4)Reverse-calculated.
Table 3.Comparison of obesity indicators according to sodium index quartile
Table 4.Comparison of sodium index according to the obesity indicators
| Variables | Total (n = 120) | Men (n = 60) | Women (n = 60) |
|---|---|---|---|
| Body mass index1) | |||
| Underweight | 145.6 ± 21.9a | 160.6 ± 0.0 | 144.3 ± 22.4a |
| Normal | 179.5 ± 28.1b | 204.2 ± 15.8a | 164.2 ± 22.5ab |
| Overweight | 205.0 ± 25.3c | 217.4 ± 17.7b | 178.5 ± 17.7b |
| Obesity | 246.5 ± 28.6d | 252.0 ± 25.1c | 223.4 ± 33.9c |
| P-value | < 0.001 | < 0.001 | < 0.001 |
| Body fat percentage2) | |||
| Moderate | 158.3 ± 26.1a | 190.5 ± 17.4a | 151.9 ± 22.6a |
| Overfat | 197.1 ± 26.7b | 211.8 ± 18.2b | 172.5 ± 19.7b |
| Obesity | 239.5 ± 35.2c | 255.5 ± 22.4c | 205.5 ± 33.7c |
| P-value | < 0.001 | < 0.001 | < 0.001 |
Mean ± SD.
Means with different lowercase letters in the same column are significantly different according to Duncan’s multiple range test with a P-value of < 0.05.
1)Body mass index: < 18.5 kg/m2 underweight, 18.5–22.9 kg/m2 normal, 23–24.9 kg/m2 overweight, ≥ 25 kg/m2 obesity.
2)Body fat percentage: < 8% underweight, 8% to < 15% moderate, 15% to < 25% overfat, ≥ 25% obesity for males; < 15% underweight, 15% to < 25% moderate, 25% to < 30% overfat, ≥ 30% obesity for females.
Table 5.Pearson’s correlation coefficient between sodium index and obesity indicators
| Variables | Total (n = 120) | Men (n = 60) | Women (n = 60) |
|---|---|---|---|
| Body mass index | 0.821*** | 0.838*** | 0.781*** |
| Body fat percentage | 0.307** | 0.800*** | 0.711*** |
| Waist-to-hip ratio | 0.823*** | 0.738*** | 0.696*** |
| Visceral fat level | 0.823*** | 0.767*** | 0.725*** |
Table 6.OR for obesity according to sodium index by multiple logistic regression
| Variables |
Sodium index, OR (95% CI) |
||
|---|---|---|---|
| Moderate | Careful | Severe | |
| Obesity based on body fat percentage | |||
| Unadjusted model | 1.000 | 1.030 (0.924–1.149) | 1.307 (1.109–1.541)** |
| Adjusted model1) | 1.000 | 1.253 (1.055–1.487) | 2.181 (1.526–3.118)*** |
| Obesity based on visceral fat level | |||
| Unadjusted model | 1.000 | 1.797 (1.281–2.521)** | 3.819 (2.330–6.262)*** |
| Adjusted model1) | 1.000 | 1.468 (1.012–2.128)* | 4.073 (2.097–7.911)*** |
- 1. World Health Organization (WHO). Obesity and overweight [Internet]. WHO; 2024 Mar 1 [updated 2024 Mar 1; cited 2024 Mar 1]. Available from: https://www.who.int/news-room/fact-sheets/detail/obesity-andoverweight
- 2. Formica V, Morelli C, Riondino S, Renzi N, Nitti D, Di Daniele N, et al. Obesity and common pathways of cancer and cardiovascular disease. Endocr Metab Sci 2020; 1(3-4): 100065.Article
- 3. Kim MH, Kim MK, Choi BY, Shin YJ. Prevalence of the metabolic syndrome and its association with cardiovascular diseases in Korea. J Korean Med Sci 2004; 19(2): 195-201.ArticlePubMedPMC
- 4. Korac B, Kalezic A, Pekovic-Vaughan V, Korac A, Jankovic A. Redox changes in obesity, metabolic syndrome, and diabetes. Redox Biol 2021; 42: 101887.ArticlePubMedPMC
- 5. Kopelman PG. Obesity as a medical problem. Nature 2000; 404(6778): 635-643.ArticlePubMedPDF
- 6. Chen Q, Wang J, Yang J, Jin Z, Shi W, Qin Y, et al. Association between adult weight gain and colorectal cancer: a dose-response meta-analysis of observational studies. Int J Cancer 2015; 136(12): 2880-2889.ArticlePubMed
- 7. Kim YJ, Yeom HE. Evaluating the predictive efficiency of obesity-related factors for type 2 diabetes: a panel study using KoGES data. J Health Inform Stat 2024; 49(1): 54-61.ArticlePDF
- 8. Korean Disease Control and Prevention Agency (KDCA). Korea health statistics 2022: Korea National Health and Nutrition Examination Survey (KNHANES IX-1) [Internet]. KDCA; 2022 Dec 31 [updated 2022 Dec 31; cited 2024 Mar 1]. Available from: https://knhanes.kdca.go.kr/knhanes/sub04/sub04_03.do?classType=7
- 9. Chong MY, Han I. Distribution of the metabolic syndrome by obesity and health behavior based on the 8 KNHANES at 2019. J Korean Soc Food Sci Nutr 2022; 51(11): 1136-1147.
- 10. Balkau B, Deanfield JE, Després JP, Bassand JP, Fox KA, Smith SC Jr, et al. International Day for the Evaluation of Abdominal Obesity (IDEA): a study of waist circumference, cardiovascular disease, and diabetes mellitus in 168,000 primary care patients in 63 countries. Circulation 2007; 116(17): 1942-1951.ArticlePubMedPMC
- 11. WHO Expert Consultation. Appropriate body-mass index for Asian populations and its implications for policy and intervention strategies. Lancet 2004; 363(9403): 157-163.ArticlePubMed
- 12. Escobedo-de la Peña J, Ramírez-Hernández JA, Fernández-Ramos MT, González-Figueroa E, Champagne B. Body fat percentage rather than body mass index related to the high occurrence of type 2 diabetes. Arch Med Res 2020; 51(6): 564-571.ArticlePubMed
- 13. Ministry of Health and Welfare (KR), The Korean Nutrition Society. Dietary reference intakes for Koreans 2020. Sejong: Ministry of Health and Welfare; 2020.
- 14. Okayama A, Okuda N, Miura K, Okamura T, Hayakawa T, Akasaka H, et al. Dietary sodium-to-potassium ratio as a risk factor for stroke, cardiovascular disease and all-cause mortality in Japan: the NIPPON DATA80 cohort study. BMJ Open 2016; 6(7): e011632.ArticlePubMedPMC
- 15. Mente A, O’Donnell M, Rangarajan S, McQueen M, Dagenais G, Wielgosz A, et al. Urinary sodium excretion, blood pressure, cardiovascular disease, and mortality: a community-level prospective epidemiological cohort study. Lancet 2018; 392(10146): 496-506.ArticlePubMed
- 16. Li Y, Huang Z, Jin C, Xing A, Liu Y, Huangfu C, et al. Longitudinal change of perceived salt intake and stroke risk in a Chinese population. Stroke 2018; 49(6): 1332-1339.ArticlePubMedPMC
- 17. Umesawa M, Iso H, Fujino Y, Kikuchi S, Tamakoshi A; JACC Study Group. Salty food preference and intake and risk of gastric cancer: the JACC study. J Epidemiol 2016; 26(2): 92-97.ArticlePubMedPMC
- 18. Larsen SC, Ängquist L, Sørensen TI, Heitmann BL. 24h urinary sodium excretion and subsequent change in weight, waist circumference and body composition. PLoS One 2013; 8(7): e69689.ArticlePubMedPMC
- 19. Song HJ, Cho YG, Lee HJ. Dietary sodium intake and prevalence of overweight in adults. Metabolism 2013; 62(5): 703-708.ArticlePubMed
- 20. Oh HW, Kim HJ, Jun DW, Lee SM. Associations between 24-hour urine sodium excretion level and obesity-related metabolic risk factors. Korean J Community Nutr 2015; 20(6): 460-467.Article
- 21. Ma Y, He FJ, MacGregor GA. High salt intake: independent risk factor for obesity? Hypertension 2015; 66(4): 843-849.ArticlePubMed
- 22. Navia B, Aparicio A, Perea JM, Pérez-Farinós N, Villar-Villalba C, Labrado E, et al. Sodium intake may promote weight gain; results of the FANPE study in a representative sample of the adult Spanish population. Nutr Hosp 2014; 29(6): 1283-1289.PubMed
- 23. Zhang X, Wang J, Li J, Yu Y, Song Y. A positive association between dietary sodium intake and obesity and central obesity: results from the National Health and Nutrition Examination Survey 1999-2006. Nutr Res 2018; 55: 33-44.ArticlePubMed
- 24. Yoon YS, Oh SW. Sodium density and obesity; the Korea National Health and Nutrition Examination Survey 2007-2010. Eur J Clin Nutr 2013; 67(2): 141-146.ArticlePubMedPDF
- 25. Nam GE, Kim SM, Choi MK, Heo YR, Hyun TS, Lyu ES, et al. Association between 24-h urinary sodium excretion and obesity in Korean adults: a multicenter study. Nutrition 2017; 41: 113-119.ArticlePubMed
- 26. Lee YK, Hyun T, Ro H, Heo YR, Choi MK. Development and application of the sodium index to estimate and assess sodium intake for Korean adults. Nutr Res Pract 2022; 16(3): 366-378.ArticlePubMedPMCLink
- 27. World Health Organization Western Pacific Region, International Association for the Study of Obesity, International Obesity Task Force. The Asia-Pacific perspective: reducing obesity and its treatment. Sydney: Health Communications Australia Pty Limited; 2000
- 28. Lee RD, Nieman DC. Nutritional assessment. 4th ed. New York, NY: McGraw-Hill Higher Education; 2007. p. 201-202.
- 29. Korean Society for Health Promotion and Disease Prevention (KSHPDP). Assessment of obesity [Internet]. KSHPDP; 2002 [cited 2024 Mar 1]. Available from: https://www.healthpro.or.kr/health/viewC.php?cat=11&number=102
- 30. Oh SW, Han KH, Han SY, Koo HS, Kim S, Chin HJ. Association of sodium excretion with metabolic syndrome, insulin resistance, and body fat. Medicine (Baltimore) 2015; 94(39): e1650.ArticlePubMedPMC
- 31. Oh HY, Kim MK, Lee M, Kim YO. Macronutrient composition and sodium intake of diet are associated with risk of metabolic syndrome and hypertension in Korean women. PLoS One 2013; 8(10): e78088.ArticlePubMedPMC
- 32. Cheon SY, Wang HW, Lee HJ, Hwang KM, Yoon HS, Kang YJ. Relationship of sodium consumption with obesity in Korean adults based on Korea National Health and Nutrition Examination Survey 2010~2014. J Nutr Health 2017; 50(1): 64-73.ArticleLink
- 33. Lee MJ, Park MY, Kim JH, Sung SY, Lee MS. Impacts of high sodium intake on obesity-related gene expression. J East Asian Soc Diet Life 2018; 28(5): 364-374.Article
- 34. Seo MH, Kim YH, Han K, Jung JH, Park YG, Lee SS, et al. Prevalence of obesity and incidence of obesityrelated comorbidities in Koreans based on National Health Insurance Service Health Checkup Data 2006-2015. J Obes Metab Syndr 2018; 27(1): 46-52.PubMedPMC
- 35. Faraco G, Hochrainer K, Segarra SG, Schaeffer S, Santisteban MM, Menon A, et al. Dietary salt promotes cognitive impairment through tau phosphorylation. Nature 2019; 574(7780): 686-690.ArticlePubMedPMCPDF
REFERENCES
Figure & Data
REFERENCES
Citations
Citations to this article as recorded by 
- The association between sodium index and the risk of obesity in Korean and Chinese university students: a cross-sectional study
Linan Wang, Jin-Ah Seok, Yeon-Kyung Lee
Korean Journal of Community Nutrition.2025; 30(6): 419. CrossRef
 Cite
Cite- Figure
-
- We recommend
- Related articles
-
- Awareness, importance and performance of sustainable diets among university students in Daegu and Gyeongbuk, Korea: a cross-sectional study
- The association between sodium index and the risk of obesity in Korean and Chinese university students: a cross-sectional study
- Analysis of the relationship between foodservice staffing and foodservice quality in elderly care facilities in Korea: a cross-sectional study
- Comparison of clinical characteristics and dietary intakes according to phenotypes of type 2 diabetes mellitus in South Korea: a cross-sectional study
- Relationship between self-care and health-related behaviors among Korean adults: a cross-sectional study
Relationship of sodium index with the obesity indicators of university students in Daegu, South Korea: a cross-sectional study

Fig. 1. Comparison of obesity index according to sodium index. (A) Body mass index; (B) Body fat percentage; (C) Waist-to-hip ratio; (D) Visceral fat. Bars indicate the mean ± standard error. Means with different lower case letters in the same column are significantly different by Duncan’s multiple range test with a P-value of < 0.05.
Fig. 1.
Relationship of sodium index with the obesity indicators of university students in Daegu, South Korea: a cross-sectional study
| Variables | Total (n = 120) | Men (n = 60) | Women (n = 60) | P-value |
|---|---|---|---|---|
| Age (years) | 23.6 ± 2.2 | 24.1 ± 2.1 | 23.2 ± 2.2 | 0.026 |
| Body mass index (kg/m2) | 22.6 ± 3.3 | 24.1 ± 3.3 | 21.1 ± 3.3 | < 0.001 |
| Obesity (%) | 26 (21.7) | 21 (35.0) | 5 (8.3) | < 0.001 |
| Body fat percentage (%) | 23.6 ± 5.8 | 21.8 ± 5.8 | 25.4 ± 5.3 | 0.001 |
| Obesity (%) | 28 (23.3) | 19 (31.7) | 9 (15.0) | < 0.001 |
| Waist-to-hip ratio | 0.79 ± 0.06 | 0.82 ± 0.05 | 0.75 ± 0.05 | < 0.001 |
| Visceral fat level | 6.25 ± 3.24 | 7.98 ± 2.49 | 4.52 ± 2.97 | < 0.001 |
| Estimated sodium intake (mg/d) | 3,907.1 ± 821.3 | 4,470.8 ± 597.8 | 3,343.4 ± 597.3 | < 0.001 |
| Sodium index | 195.3 ± 41.0 | 223.5 ± 29.8 | 167.1 ± 29.8 | < 0.001 |
| Very moderate | 1 (0.8) | 0 (0.0) | 1 (1.7) | < 0.001 |
| Moderate | 13 (10.8) | 0 (0.0) | 13 (21.7) | |
| Careful | 92 (76.7) | 47 (78.3) | 45 (75.9) | |
| Severe | 14 (11.7) | 13 (21.7) | 1 (1.7) |
| Variables | Total (n = 120) | Men (n = 60) | Women (n = 60) | P-value |
|---|---|---|---|---|
| Dietary habits |
||||
| Do you usually eat salty? | 32.0 ± 9.6 | 32.5 ± 9.3 | 31.5 ± 10.1 | 0.573 |
| Dietary behaviors | ||||
| I eat all of the noodle soup liquid. |
5.63 ± 2.6 | 5.7 ± 2.6 | 5.57 ± 2.6 | 0.783 |
| I habitually add salt or sauce to food.2) | 6.65 ± 2.5 | 6.43 ± 2.6 | 6.87 ± 2.3 | 0.348 |
| I add a lot of soy sauce or red pepper paste to sliced rat fish, Korean pancakes (Jeon), or fried food. |
6.23 ± 2.5 | 6.00 ± 2.6 | 6.47 ± 2.5 | 0.322 |
| I check the sodium content when I buy processed foods. |
8.27 ± 2.5 | 8.53 ± 2.3 | 8.00 ± 2.7 | 0.254 |
| I ask them to cook blandly when I eat out. |
8.95 ± 1.7 | 8.83 ± 1.9 | 9.07 ± 1.6 | 0.479 |
| How often do you eat Korean soup or stew? |
5.80 ± 2.1 | 5.83 ± 1.9 | 5.77 ± 2.2 | 0.864 |
| How often do you eat kimchi? |
6.22 ± 2.3 | 6.17 ± 2.3 | 6.27 ± 2.4 | 0.819 |
| How often do you eat salted dry fish as a side dish? |
2.58 ± 1.0 | 2.67 ± 1.2 | 2.50 ± 0.8 | 0.401 |
| How often do you eat nuts for a snack? |
9.03 ± 1.6 | 9.00 ± 1.6 | 9.07 ± 1.7 | 0.829 |
| How often do you eat fruits? |
7.52 ± 2.2 | 7.83 ± 1.9 | 7.20 ± 2.3 | 0.118 |
| Total | 66.88 ± 9.4 | 67.0 ± 8.5 | 66.8 ± 10.2 | 0.893 |
| Variables | Q1 (n = 30) | Q2 (n = 30) | Q3 (n = 30) | Q4 (n = 30) | P-value |
|---|---|---|---|---|---|
| Body mass index (kg/m2) | 19.59 ± 1.73a | 21.14 ± 1.54b | 22.92 ± 1.87c | 26.99 ± 3.75d | < 0.001 |
| Body fat percentage (%) | 22.36 ± 4.48a | 23.84 ± 4.87a | 21.47 ± 6.01a | 26.92 ± 6.52b | 0.001 |
| Waist-to-hip ratio | 0.72 ± 0.03a | 0.76 ± 0.04b | 0.80 ± 0.04c | 0.85 ± 0.05d | < 0.001 |
| Visceral fat level | 3.13 ± 1.69a | 5.00 ± 2.00b | 7.00 ± 1.69c | 9.97 ± 2.70d | < 0.001 |
| Variables | Total (n = 120) | Men (n = 60) | Women (n = 60) |
|---|---|---|---|
| Body mass index |
|||
| Underweight | 145.6 ± 21.9a | 160.6 ± 0.0 | 144.3 ± 22.4a |
| Normal | 179.5 ± 28.1b | 204.2 ± 15.8a | 164.2 ± 22.5ab |
| Overweight | 205.0 ± 25.3c | 217.4 ± 17.7b | 178.5 ± 17.7b |
| Obesity | 246.5 ± 28.6d | 252.0 ± 25.1c | 223.4 ± 33.9c |
| P-value | < 0.001 | < 0.001 | < 0.001 |
| Body fat percentage |
|||
| Moderate | 158.3 ± 26.1a | 190.5 ± 17.4a | 151.9 ± 22.6a |
| Overfat | 197.1 ± 26.7b | 211.8 ± 18.2b | 172.5 ± 19.7b |
| Obesity | 239.5 ± 35.2c | 255.5 ± 22.4c | 205.5 ± 33.7c |
| P-value | < 0.001 | < 0.001 | < 0.001 |
| Variables | Total (n = 120) | Men (n = 60) | Women (n = 60) |
|---|---|---|---|
| Body mass index | 0.821 |
0.838 |
0.781 |
| Body fat percentage | 0.307 |
0.800 |
0.711 |
| Waist-to-hip ratio | 0.823 |
0.738 |
0.696 |
| Visceral fat level | 0.823 |
0.767 |
0.725 |
| Variables | Sodium index, OR (95% CI) |
||
|---|---|---|---|
| Moderate | Careful | Severe | |
| Obesity based on body fat percentage | |||
| Unadjusted model | 1.000 | 1.030 (0.924–1.149) | 1.307 (1.109–1.541) |
| Adjusted model |
1.000 | 1.253 (1.055–1.487) | 2.181 (1.526–3.118) |
| Obesity based on visceral fat level | |||
| Unadjusted model | 1.000 | 1.797 (1.281–2.521) |
3.819 (2.330–6.262) |
| Adjusted model |
1.000 | 1.468 (1.012–2.128) |
4.073 (2.097–7.911) |
Table 1. Obesity indicators and sodium index of participants
n (%) or Mean ± SD. Using t-test, χ2 test.
Table 2. Dietary habits and dietary behavior of participants
Mean ± SD. Using t-test. Unsalty: 10, slightly unsalty: 20, neither unsalty nor salty: 30, slightly salty: 40, and salty: 50. Not at all: 2, slightly: 4, moderately: 6, very: 8, and extremely: 10. < 3 times/month: 2, 1–2 times/week: 4, 3–6 times/week: 8, once/day: 8, and 2–3 times/day: 10. Reverse-calculated.
Table 3. Comparison of obesity indicators according to sodium index quartile
Mean ± SD. Means with different lowercase letters in the same row are significantly different according to Duncan’s multiple range test with a
Table 4. Comparison of sodium index according to the obesity indicators
Mean ± SD. Means with different lowercase letters in the same column are significantly different according to Duncan’s multiple range test with a Body mass index: < 18.5 kg/m2 underweight, 18.5–22.9 kg/m2 normal, 23–24.9 kg/m2 overweight, ≥ 25 kg/m2 obesity. Body fat percentage: < 8% underweight, 8% to < 15% moderate, 15% to < 25% overfat, ≥ 25% obesity for males; < 15% underweight, 15% to < 25% moderate, 25% to < 30% overfat, ≥ 30% obesity for females.
Table 5. Pearson’s correlation coefficient between sodium index and obesity indicators
Table 6. OR for obesity according to sodium index by multiple logistic regression
OR, odds ratio; CI, confidence interval. Multiple logistic regression for obesity with sodium index adjusted for age and sex.


