
Articles
- Page Path
- HOME > Korean J Community Nutr > Volume 30(1); 2025 > Article
-
Research Article
소비자 라이프스타일에 따른 돼지고기 소비 속성 요인 분석: 단면조사 연구 -
이정희1)
 , 이주현2), 김우경3),†
 - Analysis of pork consumption attribute factors by consumer lifestyle in Korea: a cross-sectional study
-
Jounghee Lee1), Juhyun Lee2), Wookyoung Kim3),†
-
Korean Journal of Community Nutrition 2025;30(1):75-88.
DOI: https://doi.org/10.5720/kjcn.2024.00332
Published online: February 28, 2025
1)국립군산대학교 식품영양학과 부교수
2)대한영양사협회 사업국장
3)단국대학교 식품영양학과 교수
1)Associate Professor, Department of Food Science and Nutrition, Kunsan National University, Gunsan, Korea
2)Director, Department of Marketing, The Korean Dietetic Association, Seoul, Korea
3)Professor, Department of Food Science and Nutrition, Dankook University, Cheonan, Korea
- †Corresponding author: Wookyoung Kim Department of Food Science and Nutrition, Dankook University, 119 Dandae-ro, Dongnam-gu, Cheonan 31116, Korea Tel: +82-41-550-3471 Fax: +82-41-559-7955 Email: wkkim@dankook.ac.kr
• Received: December 16, 2024 • Revised: February 7, 2025 • Accepted: February 10, 2025
© 2025 The Korean Society of Community Nutrition
This is an Open-Access article distributed under the terms of the Creative Commons Attribution Non-Commercial License (http://creativecommons.org/licenses/by-nc/4.0) which permits unrestricted non-commercial use, distribution, and reproduction in any medium, provided the original work is properly cited.
- 2,470 Views
- 47 Download
Abstract
-
Objectives
- This study aims to identify and analyze how different South Korean lifestyles impact attitudes towards pork consumption.
-
Methods
- We implemented a cross-sectional survey targeting 705 adult consumers in South Korea using hierarchical and K-means cluster analyses. Respondents were classified into three relevant lifestyles: (1) domestic preference, (2) price-sensitive, and (3) quality-experience-oriented. The importance-performance analysis was employed to evaluate discrepancies between how they rated pork consumption using factors of “importance” and “satisfaction”. We employed Borich’s needs assessment and the Locus for Focus models.
-
Results
- The research findings highlight that unpleasant odor (Q7) and hygiene (Q1) were common key areas for management across all consumer groups, emphasizing their importance in enhancing pork consumption satisfaction. Among the groups, the domestic preference group showed high importance-performance discrepancies in attributes like expiry date (D2), suggesting a need for strengthened trust in domestic pork distribution and information transparency. The price-sensitive group prioritized economic factors, with fat thickness (Q8) identified as an essential management area. The quality-experience-oriented group emphasized sensory qualities such as juiciness (Q6) and meat color (Q5), with off-flavors (Q7) displaying the largest discrepancy. These results show the significant role of sensory attributes in consumer satisfaction.
-
Conclusion
- This study demonstrated the multidimensional nature of pork consumption behavior, emphasizing the need for tailored strategies across consumer groups. Managing hygiene (Q1) and reducing unpleasant odor (Q7) are critical for all segments, while group-specific strategies include managing sensory quality for the quality-experience-oriented group, providing product information (D2) to increase trust for the domestic preference group, and emphasizing value for money for the price-sensitive group.
INTRODUCTION
METHODS
1) 설문지 구성
2) 측정도구의 타당도 및 신뢰도 검증
3) 소비자 유형분류 및 군집분석
RESULTS
1) 국내산 선호형 소비자 그룹
2) 가격 민감형 소비자 그룹
3) 품질•경험 중시형 소비자 그룹
4) 소비자 집단 별 돼지고기 속성 요인 평가 비교
DISCUSSION
-
CONFLICT OF INTEREST
There are no financial or other issues that might lead to conflict of interest.
-
FUNDING
This research was supported by a grant from the Korea Pork Checkoff Board (2022).
-
DATA AVAILABILITY
Research data is available upon request to the corresponding author.
NOTES
Fig. 1.
The Locus for Focus model prioritizing pork-related attributes by the consumer groups. Quadrants represent the prioritization of attributes: high importance-high discrepancy (top-right), low importance-high discrepancy (top-left), high importance-low discrepancy (bottom-right), low importance-low discrepancy (bottom-left).
P1, additive-free/preservative-free; P2, antibiotic-free; P3, animal welfare certification; P4, breed; Q1, hygiene; Q2, tenderness; Q3, pork cuts; Q4, texture; Q5, meat color; Q6, juiciness; Q7, off-flavors; Q8, fat thickness; Q9, marbling; Q10, grading system information; D1, storage condition (refrigerated/frozen); D2, expiration date; D3, product packaging; D4, package size; D5, quality certification mark; D6, brand; D7, grading system display, consumption and cooking attributes; C1, purchase convenience; C2, cooking convenience; C3, cooking versatility.

Table 1.Factor analysis and reliability test results for pork consumption-related lifestyles (n = 705)
| No. | Variable | Factor loadings1) | Eigenvalue (variance explained) | Cronbach’s α | ||||
|---|---|---|---|---|---|---|---|---|
| Factor1 | Factor2 | Factor3 | Factor4 | Factor 5 | ||||
| 1 | I look for and purchase high-quality pork. | 0.839 | 2.752 (16.189%) | 0.764 | ||||
| 2 | I actively seek out delicious pork to purchase. | 0.828 | ||||||
| 3 | I have a good understanding of which type of pork tastes better, even within the same cut. | 0.722 | ||||||
| 4 | I make an effort to purchase branded pork whenever possible. | 0.517 | ||||||
| 5 | I enjoy eating pork when dining out. | 0.808 | 2.624 (15.436%) | |||||
| 6 | I often decide on pork dishes for dinner impulsively. | 0.771 | ||||||
| 7 | I enjoy trying new pork dishes. | 0.722 | ||||||
| 8 | I am willing to invest significant time in cooking to create delicious pork dishes. | 0.627 | ||||||
| 9 | Consuming pork is a multisensory experience and an engaging activity. | 0.526 | ||||||
| 10 | I consume less domestically produced pork due to its high price. | 0.824 | 1.967 (11.569%) | |||||
| 11 | Even if I have a preferred cut of pork, I often choose a different cut due to price considerations. | 0.805 | ||||||
| 12 | I consume pork more for nutritional supplementation than for its taste. | 0.575 | ||||||
| 13 | I place a high value on convenience when selecting pork dishes. | 0.455 | ||||||
| 14 | I feel uneasy about consuming imported pork for some reason. | 0.825 | 1.710 (10.056%) | |||||
| 15 | Domestically produced pork is definitely tastier than imported pork. | 0.704 | ||||||
| 16 | When consuming pork at home, I prefer ready-to-cook meals or meal kits that can be prepared or heated quickly. | 0.877 | 1.685 (9.913%) | |||||
| 17 | I tend to enjoy consuming processed pork products. | 0.865 | ||||||
Table 2.Comparison of pork consumption factors across consumer groups
| Factor1), 2) | Domestic preference consumer group (n = 275) | Price-sensitive consumer group (n = 175) | Quality- and experience-oriented consumer group (n = 255) | P-value |
|---|---|---|---|---|
| Quality and taste-oriented | 3.76 ± 0.45b | 2.88 ± 0.50a | 4.21 ±0.54c | < 0.001 |
| Explorative gourmet-oriented | 3.39 ± 0.46b | 3.01 ± 0.61a | 4.32 ± 0.43c | < 0.001 |
| Economy and practicality-oriented | 2.60 ± 0.69a | 2.90 ± 0.65b | 3.09 ±0.87c | < 0.001 |
| Trust in domestic pork | 4.11 ± 0.75c | 3.01 ± 0.90a | 3.91 ±0.95b | < 0.001 |
| Preference for processed foods and meal kits | 2.24 ± 0.94a | 2.53 ± 0.93b | 2.60 ± 1.18b | < 0.001 |
Table 3.General characteristics of the participants
| Variable1) | Domestic preference consumer group (n = 275) | Price-sensitive consumer group (n = 175) | Quality- and experience-oriented consumer group (n = 255) | χ2/F-value (P-value) |
|---|---|---|---|---|
| Gender | 5.393 (0.067) | |||
| Male | 48 (17.5) | 46 (26.3) | 59 (23.1) | |
| Female | 227 (82.5) | 129 (73.7) | 196 (76.9) | |
| Mean age (year) | 44.01 ± 10.24b | 41.95 ± 12.83ab | 41.49 ± 11.45a | 3.615 (0.027) |
| Occupation distribution | 27.594 (0.006) | |||
| Manager/professional | 75 (27.3) | 34 (19.4) | 65 (25.5) | |
| Office worker | 79 (28.7) | 56 (32.0) | 64 (25.1) | |
| Service/sales worker | 26 (9.5) | 11 (6.3) | 27 (10.6) | |
| Simple labor worker | 9 (3.3) | 15 (8.6) | 7 (2.7) | |
| Housewife | 63 (22.9) | 31 (17.7) | 63 (24.7) | |
| Student | 2 (0.7) | 5 (2.9) | 9 (3.5) | |
| Unemployed/other | 21 (7.6) | 23 (13.1) | 20 (7.8) | |
| Marital status | 9.998 (0.041) | |||
| Married | 223 (81.1) | 127 (72.6) | 179 (70.2) | |
| Single | 51 (18.5) | 48 (27.4) | 75 (29.4) | |
| No response | 1 (0.4) | 0 (0.0) | 1 (0.4) | |
| Housing type | 11.985 (0.062) | |||
| Single-family house | 18 (6.5) | 12 (6.9) | 27 (10.6) | |
| Apartment | 223 (81.1) | 131 (74.9) | 185 (72.5) | |
| Multi-unit housing | 31 (11.3) | 30 (17.1) | 34 (13.3) | |
| Other | 3 (1.1) | 2 (1.1) | 9 (3.5) | |
| Household size | 3.31 ± 1.07 | 3.06 ± 1.26 | 3.16 ± 1.24 | 3.918 (0.141) |
| Monthly household income (million KRW)2) | 18.630 (0.017) | |||
| ≤ 3.99 | 51 (18.5) | 56 (32.0) | 74 (29.0) | |
| 4.00–5.99 | 89 (32.4) | 50 (28.6) | 61 (23.9) | |
| 6.00–7.99 | 66 (24.0) | 34 (19.4) | 54 (21.2) | |
| ≥ 8.00 | 59 (21.5) | 28 (16.0) | 61 (23.9) | |
| No response | 10 (3.6) | 7 (4.0) | 5 (2.0) | |
| Residential area | 2.314 (0.678) | |||
| Metropolitan area | 140 (50.9) | 99 (56.6) | 137 (53.7) | |
| Medium/small cities | 100 (36.4) | 60 (34.3) | 86 (33.7) | |
| Rural towns/villages | 35 (12.7) | 16 (9.1) | 32 (12.5) | |
| Education level | 5.719 (0.269) | |||
| High school or less | 42 (15.3) | 40 (22.9) | 44 (17.3) | |
| College graduate | 197 (71.6) | 118 (67.4) | 184 (72.2) | |
| Graduate degree or more | 36 (13.1) | 17 (9.7) | 27 (10.6) |
Table 4.Importance-performance analysis for the domestic preference consumer group (n = 275)
| Domain | Content | Importance1) | Satisfaction1) | Gap2) | t | Borich needs assessment3) | Ranks for each content | Total rank | |
|---|---|---|---|---|---|---|---|---|---|
| Production | P1 | Additive-free/preservative-free | 4.10 ± 0.85 | 3.97 ± 0.71 | 0.131 | 2.508* | 0.54 | 2 | 12 |
| P2 | Antibiotic-free | 4.19 ± 0.81 | 3.96 ± 0.78 | 0.229 | 4.234*** | 0.96 | 1 | 6 | |
| P3 | Animal welfare certification | 3.58 ± 0.96 | 3.47 ± 0.95 | 0.116 | 1.779 | 0.42 | 3 | 17 | |
| P4 | Breed (e.g., black pork, Iberico) | 3.34 ± 0.88 | 3.57 ± 0.83 | –0.233 | –4.114*** | -0.78 | 4 | 24 | |
| Quality | Q1 | Hygiene | 4.64 ± 0.57 | 4.25 ± 0.69 | 0.385 | 8.606*** | 1.79 | 2 | 2 |
| Q2 | Tenderness | 4.16 ± 0.76 | 4.03 ± 0.67 | 0.124 | 2.702** | 0.52 | 6 | 13 | |
| Q3 | Pork cuts | 4.20 ± 0.67 | 4.09 ± 0.68 | 0.113 | 2.719** | 0.48 | 7 | 14 | |
| Q4 | Texture | 4.12 ± 0.77 | 4.04 ± 0.70 | 0.076 | 1.574 | 0.31 | 10 | 19 | |
| Q5 | Meat color | 4.23 ± 0.72 | 4.08 ± 0.71 | 0.149 | 3.473** | 0.63 | 5 | 9 | |
| Q6 | Juiciness | 4.25 ± 0.71 | 4.08 ±0.65 | 0.164 | 3.945*** | 0.70 | 4 | 7 | |
| Q7 | Off-flavors | 4.78 ±0.49 | 4.24 ± 0.76 | 0.542 | 11.202*** | 2.59 | 1 | 1 | |
| Q8 | Fat thickness | 4.21 ± 0.78 | 3.93 ± 0.79 | 0.280 | 5.212*** | 1.18 | 3 | 4 | |
| Q9 | Marbling | 3.93 ± 0.87 | 3.82 ± 0.76 | 0.113 | 2.531* | 0.44 | 8 | 16 | |
| Q10 | Grading system information | 4.11 ± 0.80 | 4.01 ± 0.73 | 0.095 | 2.094* | 0.39 | 9 | 18 | |
| Distribution and labeling | D1 | Storage condition (refrigerated/frozen) | 4.46 ± 0.68 | 4.31 ± 0.70 | 0.156 | 3.525*** | 0.70 | 3 | 8 |
| D2 | Expiration date | 4.65 ± 0.56 | 4.35 ± 0.65 | 0.302 | 7.442*** | 1.40 | 1 | 3 | |
| D3 | Product packaging | 4.17 ± 0.85 | 4.03 ± 0.78 | 0.149 | 2.873** | 0.62 | 4 | 10 | |
| D4 | Package size | 4.01 ± 0.86 | 3.90 ± 0.77 | 0.113 | 2.191* | 0.45 | 6 | 15 | |
| D5 | Quality certification mark | 4.38 ± 0.71 | 4.12 ± 0.72 | 0.262 | 5.661*** | 1.15 | 2 | 5 | |
| D6 | Brand | 3.67 ± 0.94 | 3.75 ± 0.82 | –0.076 | –1.484 | -0.28 | 7 | 22 | |
| D7 | Grading system display | 4.12 ±0.76 | 3.98 ± 0.78 | 0.138 | 3.049** | 0.57 | 5 | 11 | |
| Consumption and cooking | C1 | Purchase convenience | 4.20 ± 0.70 | 4.13 ± 0.70 | 0.069 | 1.550 | 0.29 | 1 | 20 |
| C2 | Cooking convenience | 4.02 ± 0.76 | 3.98 ± 0.74 | 0.040 | 0.822 | 0.16 | 2 | 21 | |
| C3 | Cooking versatility | 3.77 ± 0.83 | 3.86 ± 0.77 | –0.091 | –1.779 | -0.34 | 3 | 23 | |
Mean ± SD.
Paired t-tests for the significance of the gap (*P < 0.05, **P < 0.01, ***P < 0.001).
1)Likert scale score from 1 (not important/satisfied at all) to 5 (very important/satisfied).
2)Gap representing the difference between importance and satisfaction scores.
3)Borich needs assessment calculated as ‘mean gap × mean importance’.
Table 5.Importance-performance analysis for the price-sensitive consumer group (n = 175)
| Domain | Content | Importance1) | Satisfaction1) | Gap2) | t | Borich needs assessment3) | Ranks for each content | Total rank | |
|---|---|---|---|---|---|---|---|---|---|
| Production | P1 | Additive-free/preservative-free | 3.55 ± 1.02 | 3.63 ± 0.79 | –0.074 | 0.971 | –0.26 | 1 | 18 |
| P2 | Antibiotic-free | 3.53 ± 1.01 | 3.66 ± 0.81 | –0.131 | 0.947 | –0.46 | 3 | 21 | |
| P3 | Animal welfare certification | 3.27 ± 1.03 | 3.41 ± 0.87 | –0.131 | 0.935 | –0.43 | 2 | 20 | |
| P4 | Breed (e.g., black pork, Iberico) | 3.07 ± 1.03 | 3.47 ± 0.80 | –0.406 | 0.971*** | –1.25 | 4 | 24 | |
| Quality | Q1 | Hygiene | 4.24 ± 0.84 | 3.91 ± 0.80 | 0.331 | 0.847*** | 1.40 | 3 | 3 |
| Q2 | Tenderness | 3.80 ± 0.90 | 3.71 ± 0.80 | 0.086 | 0.857 | 0.33 | 5 | 10 | |
| Q3 | Pork cuts | 3.79 ± 0.80 | 3.83 ± 0.74 | –0.040 | 0.812 | –0.15 | 9 | 16 | |
| Q4 | Texture | 3.66 ± 0.86 | 3.79 ± 0.80 | –0.137 | 0.893* | –0.50 | 10 | 22 | |
| Q5 | Meat color | 3.86 ± 0.81 | 3.79 ± 0.77 | 0.074 | 0.802 | 0.29 | 6 | 11 | |
| Q6 | Juiciness | 3.78 ± 0.86 | 3.75 ± 0.78 | 0.029 | 0.791 | 0.11 | 7 | 13 | |
| Q7 | Off-flavors | 4.34 ± 0.87 | 3.99 ± 0.84 | 0.354 | 0.977*** | 1.54 | 1 | 1 | |
| Q8 | Fat thickness | 4.06 ± 0.86 | 3.70 ± 0.83 | 0.360 | 0.923*** | 1.46 | 2 | 2 | |
| Q9 | Marbling | 3.70 ± 0.93 | 3.59 ± 0.77 | 0.109 | 0.798 | 0.40 | 4 | 7 | |
| Q10 | Grading system information | 3.64 ± 0.92 | 3.66 ± 0.81 | –0.017 | 0.847 | –0.06 | 8 | 15 | |
| Distribution and Labeling | D1 | Storage condition (refrigerated/frozen) | 4.05 ± 0.88 | 3.95 ± 0.80 | 0.097 | 0.807 | 0.39 | 5 | 9 |
| D2 | Expiration date | 4.31 ± 0.84 | 4.02 ± 0.78 | 0.291 | 0.728*** | 1.25 | 1 | 4 | |
| D3 | Product packaging | 4.01 ± 0.93 | 3.85 ± 0.83 | 0.160 | 0.849* | 0.64 | 3 | 6 | |
| D4 | Package size | 3.88 ± 0.93 | 3.71 ± 0.86 | 0.166 | 0.872* | 0.64 | 2 | 5 | |
| D5 | Quality certification mark | 3.87 ± 0.98 | 3.77 ± 0.90 | 0.103 | 0.774 | 0.40 | 4 | 8 | |
| D6 | Brand | 3.25 ± 1.02 | 3.51 ± 0.88 | –0.257 | 0.828*** | –0.84 | 7 | 23 | |
| D7 | Grading system display | 3.59 ± 1.04 | 3.64 ± 0.85 | –0.046 | 0.822 | –0.17 | 6 | 17 | |
| Consumption and Cooking | C1 | Purchase convenience | 3.92 ± 0.86 | 3.85 ± 0.79 | 0.069 | 0.755 | 0.27 | 1 | 12 |
| C2 | Cooking convenience | 3.83 ± 0.85 | 3.82 ± 0.79 | 0.011 | 0.773 | 0.04 | 2 | 14 | |
| C3 | Cooking versatility | 3.59 ± 0.92 | 3.67 ± 0.86 | –0.074 | 0.802 | –0.27 | 3 | 19 | |
Mean ± SD.
Paired t-tests for the significance of the gap (*P < 0.05, ***P < 0.001).
1)Likert scale score from 1 (not important/satisfied at all) to 5 (very important/satisfied).
2)Gap representing the difference between importance and satisfaction scores.
3)Borich needs assessment calculated as ‘mean gap × mean importance’.
Table 6.Importance-performance analysis for the quality- and experience-oriented consumer group (n = 255)
| Domain | Content | Importance1) | Satisfaction1) | Gap2) | t | Borich needs assessment3) | Ranks for each content | Total rank | |
|---|---|---|---|---|---|---|---|---|---|
| Production | P1 | Additive-free/preservative-free | 4.21 ± 0.90 | 4.13 ± 0.84 | 0.082 | 1.492 | 0.35 | 1 | 15 |
| P2 | Antibiotic-free | 4.19 ± 0.92 | 4.15 ± 0.84 | 0.043 | 0.787 | 0.18 | 2 | 18 | |
| P3 | Animal welfare certification | 3.83 ± 1.00 | 3.85 ± 0.94 | –0.020 | –0.284 | –0.08 | 3 | 22 | |
| P4 | Breed (e.g., black pork, Iberico) | 3.75 ± 0.91 | 3.86 ± 0.92 | –0.106 | –1.677 | –0.40 | 4 | 24 | |
| Quality | Q1 | Hygiene | 4.73 ± 0.53 | 4.40 ± 0.74 | 0.329 | 7.128*** | 1.56 | 2 | 2 |
| Q2 | Tenderness | 4.39 ± 0.72 | 4.31 ± 0.70 | 0.082 | 1.661 | 0.36 | 8 | 14 | |
| Q3 | Pork cuts | 4.41 ± 0.65 | 4.42 ± 0.69 | –0.004 | –0.083 | –0.02 | 10 | 21 | |
| Q4 | Texture | 4.36 ± 0.72 | 4.27 ± 0.68 | 0.090 | 1.821 | 0.39 | 7 | 11 | |
| Q5 | Meat color | 4.47 ± 0.67 | 4.24 ± 0.73 | 0.231 | 4.694*** | 1.03 | 4 | 4 | |
| Q6 | Juiciness | 4.46 ± 0.66 | 4.26 ± 0.75 | 0.196 | 4.072*** | 0.87 | 5 | 6 | |
| Q7 | Off-flavors | 4.77 ± 0.51 | 4.31 ± 0.81 | 0.463 | 9.102*** | 2.21 | 1 | 1 | |
| Q8 | Fat thickness | 4.37 ± 0.77 | 4.09 ± 0.89 | 0.278 | 4.680*** | 1.22 | 3 | 3 | |
| Q9 | Marbling | 4.19 ± 0.86 | 4.06 ± 0.84 | 0.129 | 2.423* | 0.54 | 6 | 8 | |
| Q10 | Grading system information | 4.30 ± 0.79 | 4.24 ± 0.81 | 0.059 | 1.169 | 0.25 | 9 | 16 | |
| Distribution and Labeling | D1 | Storage condition (refrigerated/frozen) | 4.57 ± 0.65 | 4.45 ± 0.68 | 0.114 | 2.431* | 0.52 | 3 | 9 |
| D2 | Expiration date | 4.67 ± 0.56 | 4.47 ± 0.66 | 0.196 | 4.442*** | 0.92 | 1 | 5 | |
| D3 | Product packaging | 4.38 ± 0.83 | 4.24 ± 0.76 | 0.137 | 2.398* | 0.60 | 2 | 7 | |
| D4 | Package size | 4.17 ± 0.95 | 4.11 ± 0.79 | 0.055 | 0.900 | 0.23 | 5 | 17 | |
| D5 | Quality certification mark | 4.44 ± 0.80 | 4.34 ± 0.75 | 0.102 | 2.247* | 0.45 | 4 | 10 | |
| D6 | Brand | 3.97 ± 0.95 | 4.00 ± 0.87 | –0.027 | –0.514 | –0.11 | 7 | 23 | |
| D7 | Grading system display | 4.24 ± 0.85 | 4.20 ± 0.78 | 0.039 | 0.811 | 0.17 | 6 | 19 | |
| Consumption and Cooking | C1 | Purchase convenience | 4.34 ± 0.71 | 4.25 ± 0.77 | 0.086 | 1.746 | 0.37 | 2 | 13 |
| C2 | Cooking convenience | 4.22 ± 0.84 | 4.13 ± 0.80 | 0.090 | 1.653 | 0.38 | 1 | 12 | |
| C3 | Cooking versatility | 4.14 ± 0.86 | 4.12 ± 0.79 | 0.016 | 0.278 | 0.07 | 3 | 20 | |
Mean ± SD.
Paired t-tests for the significance of the gap (*P < 0.05, ***P < 0.001).
1)Likert scale score from 1 (not important/satisfied at all) to 5 (very important/satisfied).
2)Gap representing the difference between importance and satisfaction scores.
3)Borich needs assessment calculated as ‘mean gap × mean importance’.
- 1. Huh K. Consumers’ preference for and satisfaction with retailing stores by life style. Korean J Hum Ecol 2006; 15(3): 385-395.
- 2. An D, Kim JY, Jung JH, Wang Y. A study on sustainable consumption behavior by value-based lifestyle segmentation approach. Korean J Consum Advert Psychol 2023; 24(3): 219-244.
- 3. Vermeir I, Verbeke W. Sustainable food consumption: exploring the consumer “attitude - behavioral intention” gap. J Agric Environ Ethics 2006; 19: 169-194. ArticlePDF
- 4. Grunert KG, Brunsø K, Bisp S. Food-related life style: development of a cross-culturally valid instrument for market surveillance. MAPP Working Paper No. 12; 1993. p. 1-41.
- 5. Brunsø K, Grunert KG. Development and testing of a cross-culturally valid instrument: food-related life style. Adv Consum Res 1995; 22: 475-480.
- 6. Scholderer J, Brunsø K, Bredahl L, Grunert KG. Cross-cultural validity of the food-related lifestyles instrument (FRL) within Western Europe. Appetite 2004; 42(2): 197-211. ArticlePubMed
- 7. Ji I, Jeong M, Kim H, Song W. An outlook and a long-term strategy for domestic pork (Han-don) by forecasting of consumption trend and social environment changes caused foot-and-mouth disease. Korea Rural Economic Insitute; 2011. Report No. C2011-34.
- 8. Lee J. A study on Post-COVID-19 pork consumption. [master’s thesis]. Konkuk University; 2021.
- 9. Kim GW, Kim SE. Analysis of the domestic consumer’s preference and consumption behaviors on pork. J Anim Sci Technol 2009; 51: 81-90. Article
- 10. Grunert KG, Wills JM. A review of European research on consumer response to nutrition information on food labels. J Public Health 2007; 15: 385-399. ArticlePDF
- 11. Verbeke W. Consumer acceptance of functional foods: socio-demographic, cognitive and attitudinal determinants. Food Qual Prefer 2005; 16(1): 45-57. Article
- 12. Scholderer J, Grunert KG. Consumers, food and convenience: the long way from resource constraints to actual consumption patterns. J Econ Psychol 2005; 26(1): 105-128. Article
- 13. Grunert KG. How changes in consumer behaviour and retailing affect competence requirements for food producers and processors. Agric Resour Econ 2006; 6(11): 3-22.
- 14. Grunert KG, Bredahl L, Brunsø K. Consumer perception of meat quality and implications for product development in the meat sector-a review. Meat Sci 2004; 66(2): 259-272. ArticlePubMed
- 15. Verbeke W, Vackier I. Profile and effects of consumer involvement in fresh meat. Meat Sci 2004; 67(1): 159-168. ArticlePubMed
- 16. Grunert KG. Food quality and safety: consumer perception and demand. Eur Rev Agric Econ 2005; 32(3): 369-391. Article
- 17. Verbeke W, Ward RW. Consumer interest in information cues denoting quality, traceability and origin: an application of ordered probit models to beef labels. Food Qual Prefer 2006; 17(6): 453-467. Article
- 18. Olynk NJ, Tonsor GT, Wolf CA. Consumer willingness to pay for livestock credence attribute claim verification. J Agric Resour Econ 2010; 35(2): 261-280.
- 19. Aaslyng MD, Oksama M, Olsen EV, Bejerholm C, Baltzer M, Andersen G, et al. The impact of sensory quality of pork on consumer preference. Meat Sci 2007; 76(1): 61-73. ArticlePubMed
- 20. Fearne A, Hughes D. Success factors in the fresh produce supply chain: insights from the UK. Supply Chain Manag 1999; 4(3): 120-131. Article
- 21. Aday MS, Yener U. Understanding the buying behaviour of young consumers regarding packaging attributes and labels. Int J Consum Stud 2014; 38: 385-393. Article
- 22. Tonsor GT, Shupp RS. Cheap talk scripts and online choice experiments: “looking beyond the mean”. Amer J Ag Econ 2011; 93(4): 1015-1031. ArticleLink
- 23. Tabachnick BG, Fidell LS. Using multivariate statistics. 7th ed. Pearson; 2019.
- 24. Hair JF, Black WC, Babin BJ, Anderson RE. Multivariate data analysis. 8th ed. Cengage; 2019.
- 25. Steinley D. K-means clustering: a half-century synthesis. Br J Math Stat Psychol 2006; 59(Pt 1): 1-34. ArticlePubMed
- 26. Aldenderfer MS, Blashfield RK. Cluster analysis. SAGE Publications; 1984.
- 27. Slack N. The importance‐performance matrix as a determinant of improvement priority. Int J Oper Prod Manag 1994; 14(5): 59-75. Article
- 28. Borich GD. A needs assessment model for conducting follow-up studies. J Teach Educ 1980; 31(3): 39-42. ArticleLink
- 29. Yang E, Yoon B. An educational needs analysis of sustainable dietary education for nutrition teachers: an application of the IPA, Borich needs assessment and the locus for focus model. Korean J Community Nutr 2024; 29(5): 372-381. ArticlePubMedPMCPDF
- 30. Handon Future Research Institute. Final results of research on improvement measures for distribution and consumer-friendly quality for establishing a strategy for high-quality Korean pork. Handon Future Research Institute; 2023 Apr.
- 31. National Institute of Animal Science. 2019 Korean pork consumption trends. Rural Development Administration; 2020 Jan. Report No. 11-1390906-000404-01.
- 32. Verbeke W, Pieniak Z, Guerrero L, Hersleth M. Consumers’ awareness and attitudinal determinants of European Union quality label use on traditional foods. Bio-Based Appl Econ 2012; 1(2): 213-229.ArticleLink
- 33. Zeithaml VA. Consumer perceptions of price, quality, and value: a means-end model and synthesis of evidence. J Mark 1988; 52(3): 2-22. ArticleLink
- 34. Grunert KG. Sustainability in the food sector: a consumer behaviour perspective. Int J Food Syst Dyn 2011; 2(3): 207-218.Article
- 35. Cardello AV. Food quality: relativity, context and consumer expectations. Food Qual Prefer 1995; 6(3): 163-170. Article
- 36. Kim SS. A study on consumer’s attitude for food safety and purchase of environment friendly agricultural products. J Fam Better Life 2007; 25(6): 15-32.
- 37. Park MS, Ahn BI. Impacts of food consumption lifestyle on the expenditure for the processed food: using cluster analysis and matching method. J Rural Dev 2014; 37(3): 25-58.
- 38. Couper M. Web surveys: a review of issues and approaches. Public Opin Q 2000; 64(4): 464-494. PubMed
- 39. Bethlehem J. Selection bias in web surveys. Int Stat Rev 2010; 78(2): 161-188. Article
REFERENCES
Figure & Data
REFERENCES
Citations
Citations to this article as recorded by 
 Cite
Cite- Figure
-
- We recommend
- Related articles
-
- Nutrition Quotient and nutrient intake among older adults in a rural Korean community: a cross-sectional study
- Analysis of the relationship between foodservice staffing and foodservice quality in elderly care facilities in Korea: a cross-sectional study
- Eating habits and dietary supplement utilization according to food-related lifestyle among Korean adults: a cross-sectional study
Analysis of pork consumption attribute factors by consumer lifestyle in Korea: a cross-sectional study
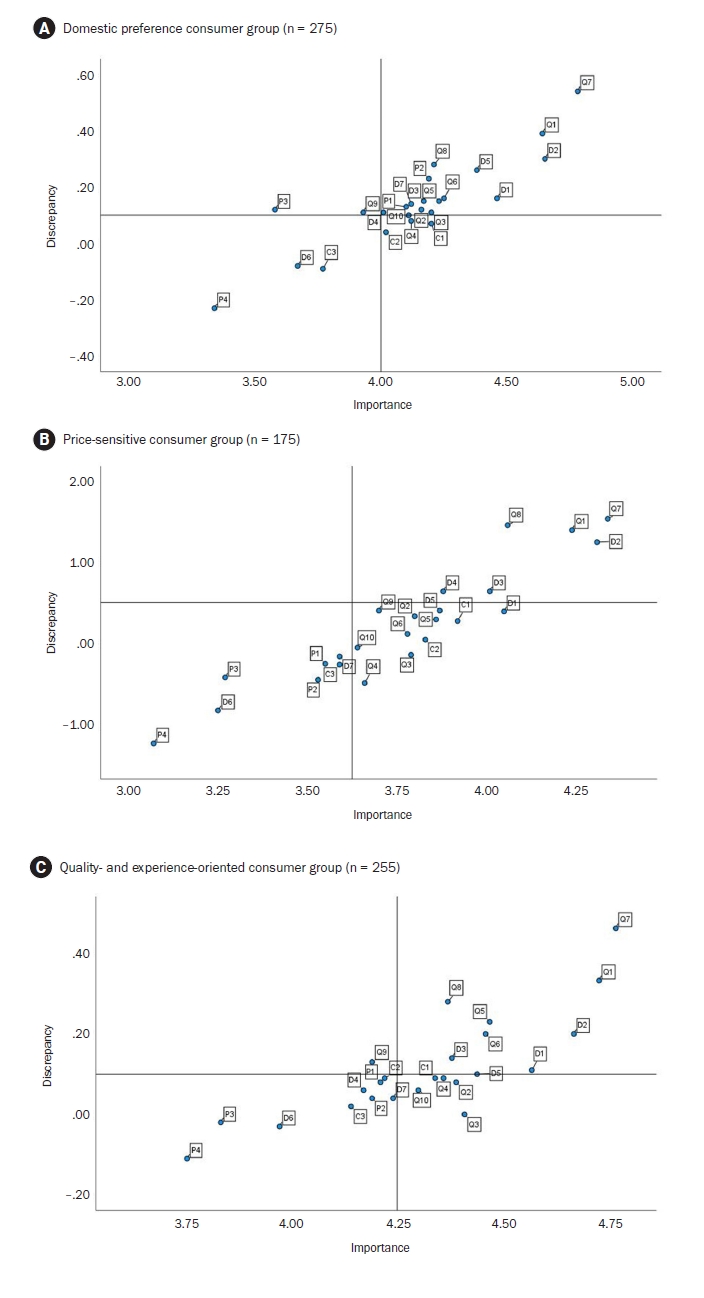
Fig. 1. The Locus for Focus model prioritizing pork-related attributes by the consumer groups. Quadrants represent the prioritization of attributes: high importance-high discrepancy (top-right), low importance-high discrepancy (top-left), high importance-low discrepancy (bottom-right), low importance-low discrepancy (bottom-left).P1, additive-free/preservative-free; P2, antibiotic-free; P3, animal welfare certification; P4, breed; Q1, hygiene; Q2, tenderness; Q3, pork cuts; Q4, texture; Q5, meat color; Q6, juiciness; Q7, off-flavors; Q8, fat thickness; Q9, marbling; Q10, grading system information; D1, storage condition (refrigerated/frozen); D2, expiration date; D3, product packaging; D4, package size; D5, quality certification mark; D6, brand; D7, grading system display, consumption and cooking attributes; C1, purchase convenience; C2, cooking convenience; C3, cooking versatility.
Fig. 1.
Analysis of pork consumption attribute factors by consumer lifestyle in Korea: a cross-sectional study
| No. | Variable | Factor loadings |
Eigenvalue (variance explained) | Cronbach’s α | ||||
|---|---|---|---|---|---|---|---|---|
| Factor1 | Factor2 | Factor3 | Factor4 | Factor 5 | ||||
| 1 | I look for and purchase high-quality pork. | 0.839 | 2.752 (16.189%) | 0.764 | ||||
| 2 | I actively seek out delicious pork to purchase. | 0.828 | ||||||
| 3 | I have a good understanding of which type of pork tastes better, even within the same cut. | 0.722 | ||||||
| 4 | I make an effort to purchase branded pork whenever possible. | 0.517 | ||||||
| 5 | I enjoy eating pork when dining out. | 0.808 | 2.624 (15.436%) | |||||
| 6 | I often decide on pork dishes for dinner impulsively. | 0.771 | ||||||
| 7 | I enjoy trying new pork dishes. | 0.722 | ||||||
| 8 | I am willing to invest significant time in cooking to create delicious pork dishes. | 0.627 | ||||||
| 9 | Consuming pork is a multisensory experience and an engaging activity. | 0.526 | ||||||
| 10 | I consume less domestically produced pork due to its high price. | 0.824 | 1.967 (11.569%) | |||||
| 11 | Even if I have a preferred cut of pork, I often choose a different cut due to price considerations. | 0.805 | ||||||
| 12 | I consume pork more for nutritional supplementation than for its taste. | 0.575 | ||||||
| 13 | I place a high value on convenience when selecting pork dishes. | 0.455 | ||||||
| 14 | I feel uneasy about consuming imported pork for some reason. | 0.825 | 1.710 (10.056%) | |||||
| 15 | Domestically produced pork is definitely tastier than imported pork. | 0.704 | ||||||
| 16 | When consuming pork at home, I prefer ready-to-cook meals or meal kits that can be prepared or heated quickly. | 0.877 | 1.685 (9.913%) | |||||
| 17 | I tend to enjoy consuming processed pork products. | 0.865 | ||||||
| Factor |
Domestic preference consumer group (n = 275) | Price-sensitive consumer group (n = 175) | Quality- and experience-oriented consumer group (n = 255) | P-value |
|---|---|---|---|---|
| Quality and taste-oriented | 3.76 ± 0.45b | 2.88 ± 0.50a | 4.21 ±0.54c | < 0.001 |
| Explorative gourmet-oriented | 3.39 ± 0.46b | 3.01 ± 0.61a | 4.32 ± 0.43c | < 0.001 |
| Economy and practicality-oriented | 2.60 ± 0.69a | 2.90 ± 0.65b | 3.09 ±0.87c | < 0.001 |
| Trust in domestic pork | 4.11 ± 0.75c | 3.01 ± 0.90a | 3.91 ±0.95b | < 0.001 |
| Preference for processed foods and meal kits | 2.24 ± 0.94a | 2.53 ± 0.93b | 2.60 ± 1.18b | < 0.001 |
| Variable |
Domestic preference consumer group (n = 275) | Price-sensitive consumer group (n = 175) | Quality- and experience-oriented consumer group (n = 255) | χ2/F-value (P-value) |
|---|---|---|---|---|
| Gender | 5.393 (0.067) | |||
| Male | 48 (17.5) | 46 (26.3) | 59 (23.1) | |
| Female | 227 (82.5) | 129 (73.7) | 196 (76.9) | |
| Mean age (year) | 44.01 ± 10.24b | 41.95 ± 12.83ab | 41.49 ± 11.45a | 3.615 (0.027) |
| Occupation distribution | 27.594 (0.006) | |||
| Manager/professional | 75 (27.3) | 34 (19.4) | 65 (25.5) | |
| Office worker | 79 (28.7) | 56 (32.0) | 64 (25.1) | |
| Service/sales worker | 26 (9.5) | 11 (6.3) | 27 (10.6) | |
| Simple labor worker | 9 (3.3) | 15 (8.6) | 7 (2.7) | |
| Housewife | 63 (22.9) | 31 (17.7) | 63 (24.7) | |
| Student | 2 (0.7) | 5 (2.9) | 9 (3.5) | |
| Unemployed/other | 21 (7.6) | 23 (13.1) | 20 (7.8) | |
| Marital status | 9.998 (0.041) | |||
| Married | 223 (81.1) | 127 (72.6) | 179 (70.2) | |
| Single | 51 (18.5) | 48 (27.4) | 75 (29.4) | |
| No response | 1 (0.4) | 0 (0.0) | 1 (0.4) | |
| Housing type | 11.985 (0.062) | |||
| Single-family house | 18 (6.5) | 12 (6.9) | 27 (10.6) | |
| Apartment | 223 (81.1) | 131 (74.9) | 185 (72.5) | |
| Multi-unit housing | 31 (11.3) | 30 (17.1) | 34 (13.3) | |
| Other | 3 (1.1) | 2 (1.1) | 9 (3.5) | |
| Household size | 3.31 ± 1.07 | 3.06 ± 1.26 | 3.16 ± 1.24 | 3.918 (0.141) |
| Monthly household income (million KRW) |
18.630 (0.017) | |||
| ≤ 3.99 | 51 (18.5) | 56 (32.0) | 74 (29.0) | |
| 4.00–5.99 | 89 (32.4) | 50 (28.6) | 61 (23.9) | |
| 6.00–7.99 | 66 (24.0) | 34 (19.4) | 54 (21.2) | |
| ≥ 8.00 | 59 (21.5) | 28 (16.0) | 61 (23.9) | |
| No response | 10 (3.6) | 7 (4.0) | 5 (2.0) | |
| Residential area | 2.314 (0.678) | |||
| Metropolitan area | 140 (50.9) | 99 (56.6) | 137 (53.7) | |
| Medium/small cities | 100 (36.4) | 60 (34.3) | 86 (33.7) | |
| Rural towns/villages | 35 (12.7) | 16 (9.1) | 32 (12.5) | |
| Education level | 5.719 (0.269) | |||
| High school or less | 42 (15.3) | 40 (22.9) | 44 (17.3) | |
| College graduate | 197 (71.6) | 118 (67.4) | 184 (72.2) | |
| Graduate degree or more | 36 (13.1) | 17 (9.7) | 27 (10.6) |
| Domain | Content | Importance |
Satisfaction |
Gap |
t | Borich needs assessment |
Ranks for each content | Total rank | |
|---|---|---|---|---|---|---|---|---|---|
| Production | P1 | Additive-free/preservative-free | 4.10 ± 0.85 | 3.97 ± 0.71 | 0.131 | 2.508* | 0.54 | 2 | 12 |
| P2 | Antibiotic-free | 4.19 ± 0.81 | 3.96 ± 0.78 | 0.229 | 4.234*** | 0.96 | 1 | 6 | |
| P3 | Animal welfare certification | 3.58 ± 0.96 | 3.47 ± 0.95 | 0.116 | 1.779 | 0.42 | 3 | 17 | |
| P4 | Breed (e.g., black pork, Iberico) | 3.34 ± 0.88 | 3.57 ± 0.83 | –0.233 | –4.114*** | -0.78 | 4 | 24 | |
| Quality | Q1 | Hygiene | 4.64 ± 0.57 | 4.25 ± 0.69 | 0.385 | 8.606*** | 1.79 | 2 | 2 |
| Q2 | Tenderness | 4.16 ± 0.76 | 4.03 ± 0.67 | 0.124 | 2.702** | 0.52 | 6 | 13 | |
| Q3 | Pork cuts | 4.20 ± 0.67 | 4.09 ± 0.68 | 0.113 | 2.719** | 0.48 | 7 | 14 | |
| Q4 | Texture | 4.12 ± 0.77 | 4.04 ± 0.70 | 0.076 | 1.574 | 0.31 | 10 | 19 | |
| Q5 | Meat color | 4.23 ± 0.72 | 4.08 ± 0.71 | 0.149 | 3.473** | 0.63 | 5 | 9 | |
| Q6 | Juiciness | 4.25 ± 0.71 | 4.08 ±0.65 | 0.164 | 3.945*** | 0.70 | 4 | 7 | |
| Q7 | Off-flavors | 4.78 ±0.49 | 4.24 ± 0.76 | 0.542 | 11.202*** | 2.59 | 1 | 1 | |
| Q8 | Fat thickness | 4.21 ± 0.78 | 3.93 ± 0.79 | 0.280 | 5.212*** | 1.18 | 3 | 4 | |
| Q9 | Marbling | 3.93 ± 0.87 | 3.82 ± 0.76 | 0.113 | 2.531* | 0.44 | 8 | 16 | |
| Q10 | Grading system information | 4.11 ± 0.80 | 4.01 ± 0.73 | 0.095 | 2.094* | 0.39 | 9 | 18 | |
| Distribution and labeling | D1 | Storage condition (refrigerated/frozen) | 4.46 ± 0.68 | 4.31 ± 0.70 | 0.156 | 3.525*** | 0.70 | 3 | 8 |
| D2 | Expiration date | 4.65 ± 0.56 | 4.35 ± 0.65 | 0.302 | 7.442*** | 1.40 | 1 | 3 | |
| D3 | Product packaging | 4.17 ± 0.85 | 4.03 ± 0.78 | 0.149 | 2.873** | 0.62 | 4 | 10 | |
| D4 | Package size | 4.01 ± 0.86 | 3.90 ± 0.77 | 0.113 | 2.191* | 0.45 | 6 | 15 | |
| D5 | Quality certification mark | 4.38 ± 0.71 | 4.12 ± 0.72 | 0.262 | 5.661*** | 1.15 | 2 | 5 | |
| D6 | Brand | 3.67 ± 0.94 | 3.75 ± 0.82 | –0.076 | –1.484 | -0.28 | 7 | 22 | |
| D7 | Grading system display | 4.12 ±0.76 | 3.98 ± 0.78 | 0.138 | 3.049** | 0.57 | 5 | 11 | |
| Consumption and cooking | C1 | Purchase convenience | 4.20 ± 0.70 | 4.13 ± 0.70 | 0.069 | 1.550 | 0.29 | 1 | 20 |
| C2 | Cooking convenience | 4.02 ± 0.76 | 3.98 ± 0.74 | 0.040 | 0.822 | 0.16 | 2 | 21 | |
| C3 | Cooking versatility | 3.77 ± 0.83 | 3.86 ± 0.77 | –0.091 | –1.779 | -0.34 | 3 | 23 | |
| Domain | Content | Importance |
Satisfaction |
Gap |
t | Borich needs assessment |
Ranks for each content | Total rank | |
|---|---|---|---|---|---|---|---|---|---|
| Production | P1 | Additive-free/preservative-free | 3.55 ± 1.02 | 3.63 ± 0.79 | –0.074 | 0.971 | –0.26 | 1 | 18 |
| P2 | Antibiotic-free | 3.53 ± 1.01 | 3.66 ± 0.81 | –0.131 | 0.947 | –0.46 | 3 | 21 | |
| P3 | Animal welfare certification | 3.27 ± 1.03 | 3.41 ± 0.87 | –0.131 | 0.935 | –0.43 | 2 | 20 | |
| P4 | Breed (e.g., black pork, Iberico) | 3.07 ± 1.03 | 3.47 ± 0.80 | –0.406 | 0.971*** | –1.25 | 4 | 24 | |
| Quality | Q1 | Hygiene | 4.24 ± 0.84 | 3.91 ± 0.80 | 0.331 | 0.847*** | 1.40 | 3 | 3 |
| Q2 | Tenderness | 3.80 ± 0.90 | 3.71 ± 0.80 | 0.086 | 0.857 | 0.33 | 5 | 10 | |
| Q3 | Pork cuts | 3.79 ± 0.80 | 3.83 ± 0.74 | –0.040 | 0.812 | –0.15 | 9 | 16 | |
| Q4 | Texture | 3.66 ± 0.86 | 3.79 ± 0.80 | –0.137 | 0.893* | –0.50 | 10 | 22 | |
| Q5 | Meat color | 3.86 ± 0.81 | 3.79 ± 0.77 | 0.074 | 0.802 | 0.29 | 6 | 11 | |
| Q6 | Juiciness | 3.78 ± 0.86 | 3.75 ± 0.78 | 0.029 | 0.791 | 0.11 | 7 | 13 | |
| Q7 | Off-flavors | 4.34 ± 0.87 | 3.99 ± 0.84 | 0.354 | 0.977*** | 1.54 | 1 | 1 | |
| Q8 | Fat thickness | 4.06 ± 0.86 | 3.70 ± 0.83 | 0.360 | 0.923*** | 1.46 | 2 | 2 | |
| Q9 | Marbling | 3.70 ± 0.93 | 3.59 ± 0.77 | 0.109 | 0.798 | 0.40 | 4 | 7 | |
| Q10 | Grading system information | 3.64 ± 0.92 | 3.66 ± 0.81 | –0.017 | 0.847 | –0.06 | 8 | 15 | |
| Distribution and Labeling | D1 | Storage condition (refrigerated/frozen) | 4.05 ± 0.88 | 3.95 ± 0.80 | 0.097 | 0.807 | 0.39 | 5 | 9 |
| D2 | Expiration date | 4.31 ± 0.84 | 4.02 ± 0.78 | 0.291 | 0.728*** | 1.25 | 1 | 4 | |
| D3 | Product packaging | 4.01 ± 0.93 | 3.85 ± 0.83 | 0.160 | 0.849* | 0.64 | 3 | 6 | |
| D4 | Package size | 3.88 ± 0.93 | 3.71 ± 0.86 | 0.166 | 0.872* | 0.64 | 2 | 5 | |
| D5 | Quality certification mark | 3.87 ± 0.98 | 3.77 ± 0.90 | 0.103 | 0.774 | 0.40 | 4 | 8 | |
| D6 | Brand | 3.25 ± 1.02 | 3.51 ± 0.88 | –0.257 | 0.828*** | –0.84 | 7 | 23 | |
| D7 | Grading system display | 3.59 ± 1.04 | 3.64 ± 0.85 | –0.046 | 0.822 | –0.17 | 6 | 17 | |
| Consumption and Cooking | C1 | Purchase convenience | 3.92 ± 0.86 | 3.85 ± 0.79 | 0.069 | 0.755 | 0.27 | 1 | 12 |
| C2 | Cooking convenience | 3.83 ± 0.85 | 3.82 ± 0.79 | 0.011 | 0.773 | 0.04 | 2 | 14 | |
| C3 | Cooking versatility | 3.59 ± 0.92 | 3.67 ± 0.86 | –0.074 | 0.802 | –0.27 | 3 | 19 | |
| Domain | Content | Importance |
Satisfaction |
Gap |
t | Borich needs assessment |
Ranks for each content | Total rank | |
|---|---|---|---|---|---|---|---|---|---|
| Production | P1 | Additive-free/preservative-free | 4.21 ± 0.90 | 4.13 ± 0.84 | 0.082 | 1.492 | 0.35 | 1 | 15 |
| P2 | Antibiotic-free | 4.19 ± 0.92 | 4.15 ± 0.84 | 0.043 | 0.787 | 0.18 | 2 | 18 | |
| P3 | Animal welfare certification | 3.83 ± 1.00 | 3.85 ± 0.94 | –0.020 | –0.284 | –0.08 | 3 | 22 | |
| P4 | Breed (e.g., black pork, Iberico) | 3.75 ± 0.91 | 3.86 ± 0.92 | –0.106 | –1.677 | –0.40 | 4 | 24 | |
| Quality | Q1 | Hygiene | 4.73 ± 0.53 | 4.40 ± 0.74 | 0.329 | 7.128*** | 1.56 | 2 | 2 |
| Q2 | Tenderness | 4.39 ± 0.72 | 4.31 ± 0.70 | 0.082 | 1.661 | 0.36 | 8 | 14 | |
| Q3 | Pork cuts | 4.41 ± 0.65 | 4.42 ± 0.69 | –0.004 | –0.083 | –0.02 | 10 | 21 | |
| Q4 | Texture | 4.36 ± 0.72 | 4.27 ± 0.68 | 0.090 | 1.821 | 0.39 | 7 | 11 | |
| Q5 | Meat color | 4.47 ± 0.67 | 4.24 ± 0.73 | 0.231 | 4.694*** | 1.03 | 4 | 4 | |
| Q6 | Juiciness | 4.46 ± 0.66 | 4.26 ± 0.75 | 0.196 | 4.072*** | 0.87 | 5 | 6 | |
| Q7 | Off-flavors | 4.77 ± 0.51 | 4.31 ± 0.81 | 0.463 | 9.102*** | 2.21 | 1 | 1 | |
| Q8 | Fat thickness | 4.37 ± 0.77 | 4.09 ± 0.89 | 0.278 | 4.680*** | 1.22 | 3 | 3 | |
| Q9 | Marbling | 4.19 ± 0.86 | 4.06 ± 0.84 | 0.129 | 2.423* | 0.54 | 6 | 8 | |
| Q10 | Grading system information | 4.30 ± 0.79 | 4.24 ± 0.81 | 0.059 | 1.169 | 0.25 | 9 | 16 | |
| Distribution and Labeling | D1 | Storage condition (refrigerated/frozen) | 4.57 ± 0.65 | 4.45 ± 0.68 | 0.114 | 2.431* | 0.52 | 3 | 9 |
| D2 | Expiration date | 4.67 ± 0.56 | 4.47 ± 0.66 | 0.196 | 4.442*** | 0.92 | 1 | 5 | |
| D3 | Product packaging | 4.38 ± 0.83 | 4.24 ± 0.76 | 0.137 | 2.398* | 0.60 | 2 | 7 | |
| D4 | Package size | 4.17 ± 0.95 | 4.11 ± 0.79 | 0.055 | 0.900 | 0.23 | 5 | 17 | |
| D5 | Quality certification mark | 4.44 ± 0.80 | 4.34 ± 0.75 | 0.102 | 2.247* | 0.45 | 4 | 10 | |
| D6 | Brand | 3.97 ± 0.95 | 4.00 ± 0.87 | –0.027 | –0.514 | –0.11 | 7 | 23 | |
| D7 | Grading system display | 4.24 ± 0.85 | 4.20 ± 0.78 | 0.039 | 0.811 | 0.17 | 6 | 19 | |
| Consumption and Cooking | C1 | Purchase convenience | 4.34 ± 0.71 | 4.25 ± 0.77 | 0.086 | 1.746 | 0.37 | 2 | 13 |
| C2 | Cooking convenience | 4.22 ± 0.84 | 4.13 ± 0.80 | 0.090 | 1.653 | 0.38 | 1 | 12 | |
| C3 | Cooking versatility | 4.14 ± 0.86 | 4.12 ± 0.79 | 0.016 | 0.278 | 0.07 | 3 | 20 | |
Table 1. Factor analysis and reliability test results for pork consumption-related lifestyles (n = 705)
Principal component analysis with varimax rotation. Factor loading threshold: 0.4.
Table 2. Comparison of pork consumption factors across consumer groups
Mean ± SD. Tukey HSD test for post-hoc analysis. Likert scale score from 1 (not important at all) to 5 (very important). Superscripts (a, b, c) denote statistically significant differences between consumer groups.
Table 3. General characteristics of the participants
Mean ± SD or n (%). Chi-square ( Superscripts (a, b, c) denote significantly differences between consumer groups ( KRW: Korean won.
Table 4. Importance-performance analysis for the domestic preference consumer group (n = 275)
Mean ± SD. Paired t-tests for the significance of the gap (* Likert scale score from 1 (not important/satisfied at all) to 5 (very important/satisfied). Gap representing the difference between importance and satisfaction scores. Borich needs assessment calculated as ‘mean gap × mean importance’.
Table 5. Importance-performance analysis for the price-sensitive consumer group (n = 175)
Mean ± SD. Paired t-tests for the significance of the gap (* Likert scale score from 1 (not important/satisfied at all) to 5 (very important/satisfied). Gap representing the difference between importance and satisfaction scores. Borich needs assessment calculated as ‘mean gap × mean importance’.
Table 6. Importance-performance analysis for the quality- and experience-oriented consumer group (n = 255)
Mean ± SD. Paired t-tests for the significance of the gap (* Likert scale score from 1 (not important/satisfied at all) to 5 (very important/satisfied). Gap representing the difference between importance and satisfaction scores. Borich needs assessment calculated as ‘mean gap × mean importance’.


