
Articles
- Page Path
- HOME > Korean J Community Nutr > Volume 18(3); 2013 > Article
-
Original Article
- Association between Preferences of Salty Food and Acuity and Preferences of Taste of the Elderly People Living in Rural Area
- Mee Sook Lee
-
Korean Journal of Community Nutrition 2013;18(3):223-232.
DOI: https://doi.org/10.5720/kjcn.2013.18.3.223
Published online: June 30, 2013
Department of Food and Nutrition, Hannam University, Daejeon, Korea.
- Corresponding author: Mee Sook Lee, Department of Food and Nutrition, Hannam University, #461-6 Jeonmin-dong, Yuseong-gu, Daejeon 305-811, Korea. Tel: (042) 629-8794, Fax: (042) 629-8789, meesook@hnu.kr
• Received: March 28, 2013 • Revised: May 14, 2013 • Accepted: May 14, 2013
Copyright © 2013 The Korean Society of Community Nutrition
This is an Open-Access article distributed under the terms of the Creative Commons Attribution Non-Commercial License (http://creativecommons.org/licenses/by-nc/3.0/) which permits unrestricted non-commercial use, distribution, and reproduction in any medium, provided the original work is properly cited.
- 2,041 Views
- 3 Download
- 5 Crossref

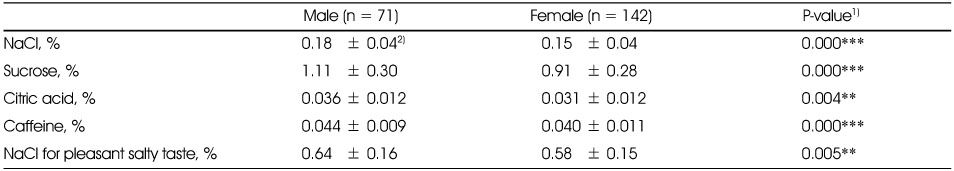

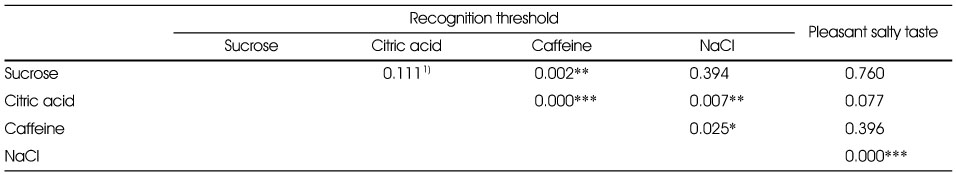


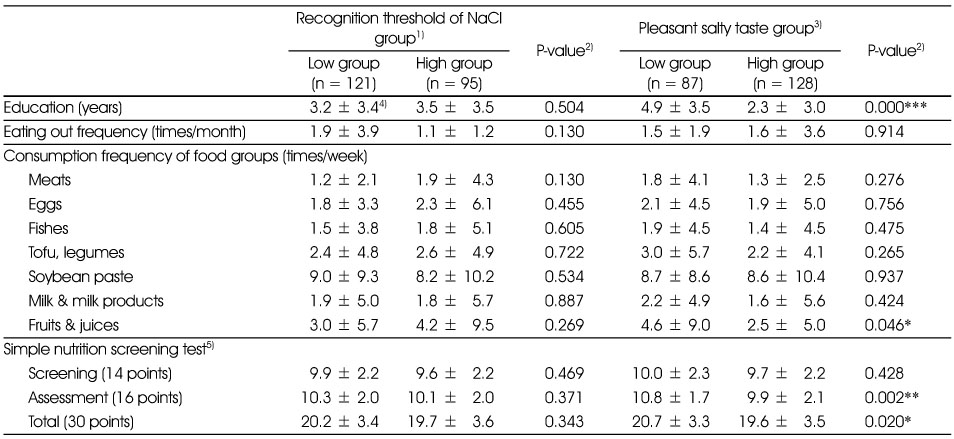
Figure & Data
REFERENCES
Citations
Citations to this article as recorded by 
- Nutrition and food intake status among adults in Jeju according to sociodemographic characteristics and obesity
Hyunji Ham, Hanbin Ko, Sumin Kim, Youjeong Jang, Jong-Seok Byun, Yoonsuk Jekal, Insuk Chai, Kyungho Ha
Journal of Nutrition and Health.2024; 57(6): 667. CrossRef - Comparison of Taste Preferences, Eating Behaviors, and Dietary Habits according to Age of the Elderly in Chungcheong-do
Eun-Sun Park, Mi-Kyeong Choi
Journal of the East Asian Society of Dietary Life.2019; 29(2): 139. CrossRef - Association between Sodium Excretion and Obesity of Adults in Gwangju
Mijin Jo, Young-Ran Heo
Korean Journal of Community Nutrition.2018; 23(1): 38. CrossRef - Demand for Elderly Food Development: Relation to Oral and Overall Health -Focused on the Elderly Who Are Using Senior Welfare Centers in Seoul-
Geum-Yong Lee, Jung-Ah Han
Journal of the Korean Society of Food Science and Nutrition.2015; 44(3): 370. CrossRef - The Relationship between Dietary Behaviors/health Risk Factors and Preference for Salty Taste among Korean Elderly People Living in Rural Areas
Mee Sook Lee
Korean Journal of Community Nutrition.2014; 19(5): 448. CrossRef
 Cite
CiteAssociation between Preferences of Salty Food and Acuity and Preferences of Taste of the Elderly People Living in Rural Area
Association between Preferences of Salty Food and Acuity and Preferences of Taste of the Elderly People Living in Rural Area
General characteristics of the subjects
1) p-value of the χ2-test
2) Mean ± SD
3) N (%)
***: p < 0.001
Concentrations of recognition threshold of 4 basic taste qualities and pleasant salty taste by gender
1) p-value of the t-test, 2) Mean ± SD
**: p < 0.01, ***: p < 0.001
Concentration of recognition thresholds of 4 basic taste qualities and pleasant salty taste by age groups
1) p-value of the t-test, 2) Mean ± SD
*: p < 0.05, **: p < 0.01, ***: p < 0.001
Correlation coefficient among recognition threshold of tastes and pleasant salty taste adjusted by age and gender
1) Pearson's correlation coefficient
*: p < 0.05, **: p < 0.01, ***: p < 0.001
Preferences of taste of food by gender
1) p-value of the χ2-test, 2) % of subjects
*: p < 0.05, **: p < 0.01
Preferences of salty food by recognition threshold of salty taste group, pleasant salty taste group and gender
1) p-value of the χ2-test
2) Recognition threshold of NaCl group: low group: below mean value of recognition threshold, high group: above mean value of recognition threshold
3) % of subjects
4) Pleasant salty taste group: low group: below mean value of concentration of pleasant salty taste, high group: above mean value of concentration of pleasant salty taste
***: p < 0.001
Education and food behaviors of subjects by recognition threshold of salty taste group and pleasant salty taste group
1) Recognition threshold of NaCl group: low group: below mean value of recognition threshold, high group: above mean value of recognition threshold
2) p-value of the t-test
3) Pleasant salty taste group: low group: below mean value of concentration of pleasant salty taste, high group: above mean value of concentration of pleasant salty taste
4) Mean ± SD
5) Brown (2008)
*: p < 0.05, **: p < 0.01, ***: p < 0.001
Table 1
General characteristics of the subjects
1) p-value of the χ2-test 2) Mean ± SD 3) N (%) ***: p < 0.001
Table 2
Concentrations of recognition threshold of 4 basic taste qualities and pleasant salty taste by gender
1) p-value of the t-test, 2) Mean ± SD **: p < 0.01, ***: p < 0.001
Table 3
Concentration of recognition thresholds of 4 basic taste qualities and pleasant salty taste by age groups
1) p-value of the t-test, 2) Mean ± SD *: p < 0.05, **: p < 0.01, ***: p < 0.001
Table 4
Correlation coefficient among recognition threshold of tastes and pleasant salty taste adjusted by age and gender
1) Pearson's correlation coefficient *: p < 0.05, **: p < 0.01, ***: p < 0.001
Table 5
Preferences of taste of food by gender
1) p-value of the χ2-test, 2) % of subjects *: p < 0.05, **: p < 0.01
Table 6
Preferences of salty food by recognition threshold of salty taste group, pleasant salty taste group and gender
1) p-value of the χ2-test 2) Recognition threshold of NaCl group: low group: below mean value of recognition threshold, high group: above mean value of recognition threshold 3) % of subjects 4) Pleasant salty taste group: low group: below mean value of concentration of pleasant salty taste, high group: above mean value of concentration of pleasant salty taste ***: p < 0.001
Table 7
Education and food behaviors of subjects by recognition threshold of salty taste group and pleasant salty taste group
1) Recognition threshold of NaCl group: low group: below mean value of recognition threshold, high group: above mean value of recognition threshold 2) p-value of the t-test 3) Pleasant salty taste group: low group: below mean value of concentration of pleasant salty taste, high group: above mean value of concentration of pleasant salty taste 4) Mean ± SD 5) Brown (2008) *: p < 0.05, **: p < 0.01, ***: p < 0.001


