Articles
- Page Path
- HOME > Korean J Community Nutr > Volume 24(5); 2019 > Article
-
Research Article
- Sleep Quality and Its Association with the Dietary Behavior and Lifestyle of University Students in Cheongju
-
Sewhan Jin
 , Munkyong Pae
-
Korean Journal of Community Nutrition 2019;24(5):395-407.
DOI: https://doi.org/10.5720/kjcn.2019.24.5.395
Published online: October 30, 2019
1Department of Food and Nutrition, Chungbuk National University, Cheongju, Korea, Student.
2Department of Food and Nutrition, Chungbuk National University, Cheongju, Korea, Professor.
- Corresponding author: Munkyong Pae. Department of Food and Nutrition, Chungbuk National University, 1 Chungdae-ro, Seowon-gu, Cheongju 28644, Korea. Tel: (043) 261-2745, Fax: (043) 267-2742, mpae@chungbuk.ac.kr
Copyright © 2019 The Korean Society of Community Nutrition
This is an Open-Access article distributed under the terms of the Creative Commons Attribution Non-Commercial License (http://creativecommons.org/licenses/by-nc/3.0/) which permits unrestricted non-commercial use, distribution, and reproduction in any medium, provided the original work is properly cited.
- 2,150 Views
- 21 Download
- 2 Crossref
Figure & Data
REFERENCES
Citations

- Relationship of sleep quality, BMI, Dietary, and socioeconomic attributes among young adults: A systematic review
Seohyun Ahn, Wan Safwani Binti Wan Kamarul Zaman, Sim-Kuan Goh, Chow-Khuen Chan
Journal of Health Psychology.2025;[Epub] CrossRef - Health Behaviors and Dietary Habits according to Sleep Duration in Korean Adults Based on the 2013–2015 Korea National Health and Nutrition Examination Survey
Jin-A Kim, Sim-Yeol Lee
Korean Journal of Health Promotion.2019; 19(4): 237. CrossRef
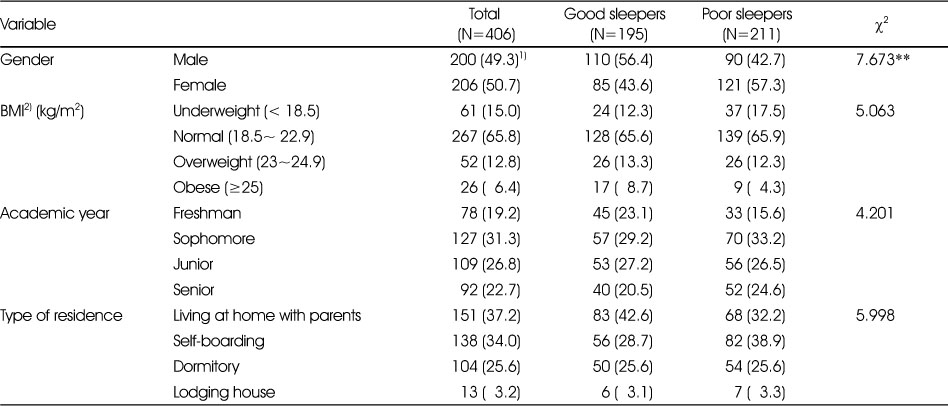
General characteristics of subjects
1) N (%)
2) Body mass index
**: p<0.01 by chi-square test
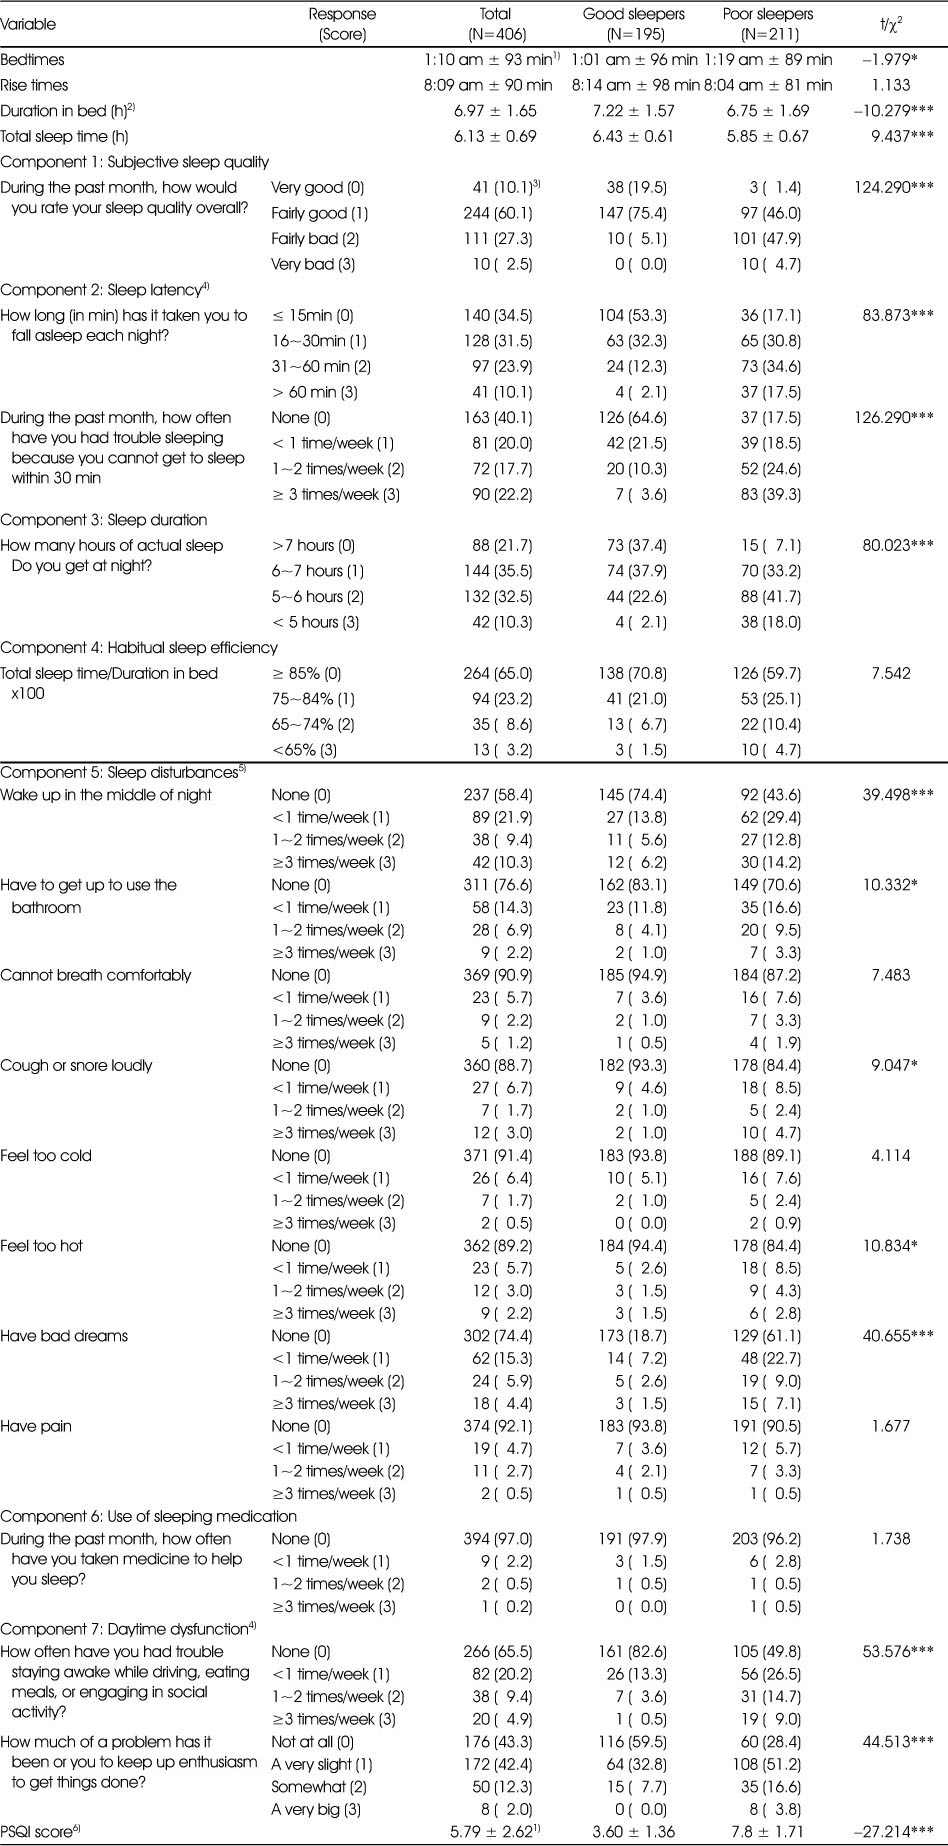
PSQI sleep quality
1) Mean ± SD
2) Duration in bed (h)=Rise times - Bedtimes
3) N(%)
4) If sum is equal 0=0; 1~2=1; 3~4=2; 5~6=3
5) If sum is equal 0=0; 1~9=1; 10~18=2; 19~27=3
6) Pittsburgh Sleep Quality Index (PSQI) score was achieved by adding the seven component scores together.
*: p<0.05, ***: p<0.001 by independent t-test or chi-square test
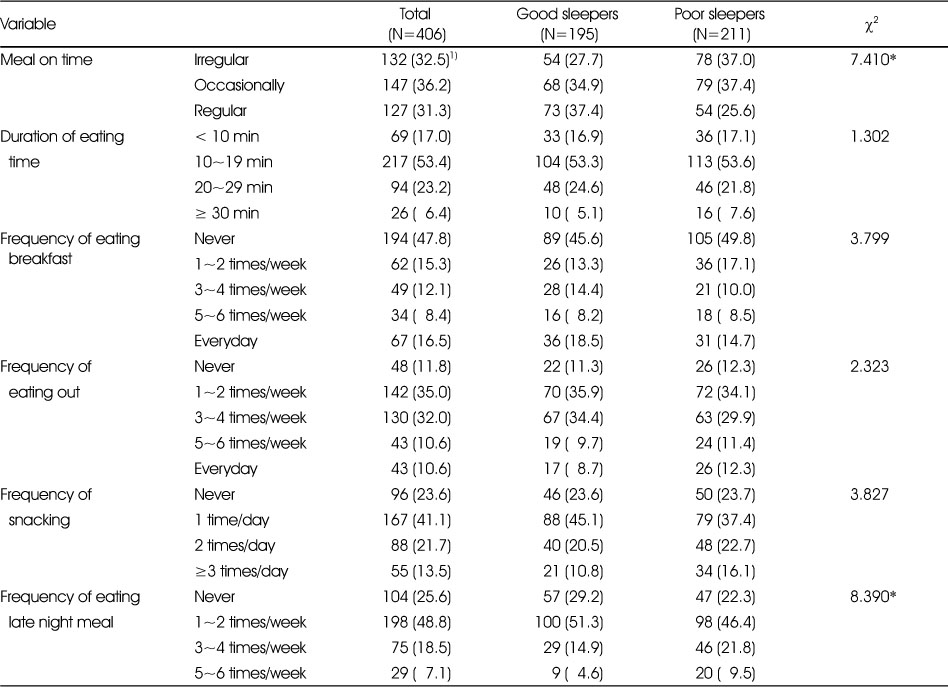
Dietary habits of subjects by PSQI sleep quality
1) N (%)
*: p<0.05 by chi-square test
The most favorite late night meals by PSQI sleep quality
1) Except for the subjects who answered never for eating late night meal
2) N (%)
Frequency of snack consumptions by PSQI sleep quality
1) Mean ± SD
2) Weekly consumption frequency
***: p<0.001 by independent t-test, #: p<0.05, †: p<0.001 by ANCOVA when adjusted for gender
Frequency of drink consumptions by PSQI sleep quality
1) Mean ± SD
2) Weekly consumption frequency
3) Calculated by subtracting the frequency of milk consumption from those of coffee, tea, and energy drink.
*: p<0.05 by independent t-test, #: p<0.05 by ANCOVA when adjusted for gender
Taste preferences by PSQI sleep quality
1) Mean ± SD
2) 5-point Likert scale from 1 (strongly dislike) to 5 (strongly like)
*: p<0.05, **: p<0.01 by independent t-test, #: p<0.05 by ANCOVA when adjusted for gender
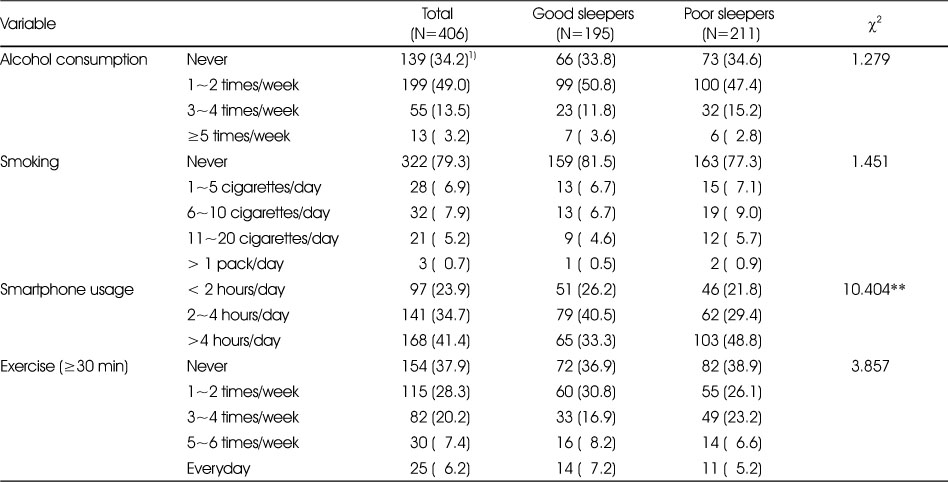
Health-related lifestyles of subjects by PSQI sleep quality
1) N (%)
**: p<0.01 by chi-square test
1) N (%) 2) Body mass index **: p<0.01 by chi-square test
1) Mean ± SD 2) Duration in bed (h)=Rise times - Bedtimes 3) N(%) 4) If sum is equal 0=0; 1~2=1; 3~4=2; 5~6=3 5) If sum is equal 0=0; 1~9=1; 10~18=2; 19~27=3 6) Pittsburgh Sleep Quality Index (PSQI) score was achieved by adding the seven component scores together. *: p<0.05, ***: p<0.001 by independent
1) N (%) *: p<0.05 by chi-square test
1) Except for the subjects who answered never for eating late night meal 2) N (%)
1) Mean ± SD 2) Weekly consumption frequency ***: p<0.001 by independent
1) Mean ± SD 2) Weekly consumption frequency 3) Calculated by subtracting the frequency of milk consumption from those of coffee, tea, and energy drink. *: p<0.05 by independent
1) Mean ± SD 2) 5-point Likert scale from 1 (strongly dislike) to 5 (strongly like) *: p<0.05, **: p<0.01 by independent
1) N (%) **: p<0.01 by chi-square test

 KSCN
KSCN


 Cite
Cite


