
Articles
- Page Path
- HOME > Korean J Community Nutr > Volume 18(5); 2013 > Article
-
Original Article
- A Survey on the Salt Content of Kindergarten Lunch Meals and Meal Providers' Dietary Attitude to Sodium Intake in Gyeonggi-do Area
- Jin Nam Kim, Seoyun Park, Sohyun Ahn, Hye-Kyeong Kim
-
Korean Journal of Community Nutrition 2013;18(5):478-490.
DOI: https://doi.org/10.5720/kjcn.2013.18.5.478
Published online: October 31, 2013
Department of Food Science & Nutrition, The Catholic University of Korea, Bucheon, Korea.
- Corresponding author: Hye-Kyeong Kim, Department of Food Science & Nutrition, The Catholic University of Korea, 43-1 Yeokgok 2-dong, Wonmi-gu, Bucheon, Gyeonggi-do 420-743, Korea. Tel: (02) 2164-4314, Fax: (02) 2164-4314, hkyeong@catholic.ac.kr
• Received: August 1, 2013 • Revised: August 27, 2013 • Accepted: September 6, 2013
Copyright © 2013 The Korean Society of Community Nutrition
This is an Open-Access article distributed under the terms of the Creative Commons Attribution Non-Commercial License (http://creativecommons.org/licenses/by-nc/3.0/) which permits unrestricted non-commercial use, distribution, and reproduction in any medium, provided the original work is properly cited.
- 2,144 Views
- 5 Download
- 18 Crossref
Abstract
- Dietary habit of excess sodium consumption is formed mainly by excessive salt intake from the younger age and this may lead to hypertension, stroke, and stomach cancer. This study was performed to estimate the salt content in kindergarten meals and provide basic data on meal providers' dietary attitude to sodium intake for nutrition education. We collected data on161 food items from 16 institutions in Gyeonggi-do and salt content was calculated from salinity and weight of individual food items. The average salt content from lunch meals was 2.2 g, which was about daily adequate intake of sodium for children aged 3 to 5 years old. Greatest contributor to the salt content in a meal was soup and stew (47.8%). The most salty dishes were sauces and kimchi followed by stir-fried food, deep-fried food, braised food, and grilled food. The salt content was higher in soup and stew despite of low salinity, due to the large quantity per serving. The salt contents of soups and kimchi were 40.6% and 14.3%, respectively of the total salt content in dish groups. Staff members and caregivers at home who prepared food for the child showed preference for one-dish rice meal, dried fish and salted mackerel, and broth when eating soup, stew, and noodles. Caregivers showed higher sodium index score and had higher preference for processed food such as Ramen, canned food, and ham compared with staff members (p < 0.05). These results suggested that monitoring salt content of kindergarten meals and nutrition education for those prepare meals for children are needed to lower sodium intake in childhood.
- 1. Ahn S, Park S, Kim JN, Han SN, Jeong SB, Kim HK. Salt content of school meals and comparison of perception related to sodium intake in elementary, middle, and high schools. Nutr Res Pract 2013; 7(1): 59-65.ArticlePubMedPMC
- 2. Brion MJ, Ness AR, Davey Smith G, Emmett P, Rogers I, Whincup P, Lawlor DA. Sodium intake in infancy and blood pressure at 7 years: findings from the Avon longitudinal study of parents and children. Eur J Clin Nutr 2008; 62(10): 1162-1169.ArticlePubMedPDF
- 3. de Wardener HE, MacGregor GA. Harmful effects of dietarysalt in addition to hypertension. J Hum Hypertens 2002; 16(4): 213-223.ArticlePubMedPDF
- 4. Gillespie AH. A theoretical framework for studying school nutrition education program. J Nutr Educ 1981; 13(4): 131-133.
- 5. He J, Whelton PK, Appel LJ, Charleston J, Klag MJ. Long-term effects of weight loss and dietary reduction on incidence of hypertension. Hypertension 2000; 35(2): 544-549.ArticlePubMed
- 6. Hooper L, Bartlett C, Davey Smith G, Ebrahim S. Systematic review of long term effects of advice to reduce dietary salt in adults. BMJ 2002; 325(7365): 628.ArticlePubMed
- 7. Jung EJ, Son SM, Kwon JS. The effect of sodium reduction education program of a public health center on the blood pressure, blood biochemical profile and sodium intake of hypertensive adults. Korean J Community Nutr 2012; 17(6): 752-771.Article
- 8. Jung HR, Lee MJ, Kim KC, Kim JB, Kim DH, Kang SH, Park JS, Kwon KI, Kim MH, Park YB. Survey on the sodium contents of nursery school meals in Gyeonggi-do. J Korean Soc Food Sci Nutr 2010; 39(4): 526-534.Article
- 9. Kannel WB. Blood pressure as a cardiovascular risk factor: prevention and treatment. JAMA 1996; 275(20): 1571-1576.ArticlePubMed
- 10. Kim JA, Kim YH, Ann MY, Lee YK. Measurements of salinity and salt content by menu types served at industry foodservice operations in Daegu. Korean J Community Nutr 2012; 17(5): 637-651.Article
- 11. Kim KO, Hwang IK. A study on salt taste preference and food habits. Saenghwalgwahagyeongu-Seouldaehakgyo 1992; 17: 61-64.
- 12. Kim YS, Paik HY. Measurement of Na intake in Korean adult females. Korean J Nutr 1987; 20(5): 341-349.
- 13. Lim HJ. A study on the calcium and sodium intakes and urinary calcium excretion of preschool children in Busan. Korean J Nutr 2001; 34(7): 786-796.
- 14. Meneton P, Jeunemaitre X, Wardener HE, MacGregor GA. Links between dietary salt intake, renal salt handling, blood pressure and cardiovascular diseases. Physiol Rev 2005; 85(2): 679-715.ArticlePubMed
- 15. Ministry of Health and Welfare, Korea Centers For Disease Control and Prevention. The fifth Korea national health & nutrition examination survey (KNHANES V). 2011; cited 2012 March 29]. Available from http://knhanes.cdc.go.kr/.
- 16. Ministry of Health and Welfare. 2013; cited 2013 May 9]. Available from http://stat.mw.go.kr/front/statData/publicationView.jsp?menuId=40&bbsSeq=6&nttSeq=20721&searchKey=&searchWord=&nPage=1.
- 17. Pangborn RM, Pecore SD. Taste perception of sodium chloride in relation to dietary intake of salt. Am J Clin Nutr 1982; 35(3): 510-520.ArticlePubMed
- 18. Shin EK, Lee HJ, Jun SY, Park EJ, Jung YY, Ahn MY, Lee YK. Development and evaluation of nutrition education program for sodium reduction in foodservice operations. Korean J Community Nutr 2008; 13(2): 216-227.
- 19. Shin EK, Lee YK. Evaluation of food and nutrient intake of preschool children in day-care centers. J Korean Soc Food Sci Nutr 2005; 34(7): 1008-1017.Article
- 20. Sohn CY, Pak HO. A survey on the foodservice management practice at child care centers in Gyeonggi area. J East Asian Soc Diet Life 2011; 21(4): 577-586.
- 21. Son SM, Huh GY, Lee HS. Development and evaluation of validity of short dish frequency questionnqire (DFQ) and short DFQ using Na index for estimation of habitual sodium intake. Korean J Community Nutr 2005; 10(5): 677-692.
- 22. Son SM, Park YS, Lim WH, Kim SB, Jeong YS. Development and evaluation of validity of short dish frequency questionnqire (DFQ) for estimation of habitual sodium intake for Korean adults. Korean J Community Nutr 2007; 12(6): 838-853.
- 23. Song ES, Kim EG. A survey on the foodservice management system of the child care centers in Chungnam Asan area. Korean J Community Nutr 2009; 14(6): 846-860.
- 24. The Korean Nutrition Society. Dietary reference intakes for Koreans. First revision. Seoul: Hanarum publishing; 2010.
- 25. Tsugane S. Salt, salted food intakes, and risk of gastric cancer:epidemiologic evidence. Cancer Sci 2005; 96(1): 1-6.PubMedPMC
- 26. Yon M, Lee Y, Kim D, Lee J, Koh E, Nam E, Shin H, Kang BW, Kim JW, Heo S, Cho HY, Kim CI. Major sources of sodium intake of the Korean population at prepared dish level-based on the KNHANES 2008 & 2009-. Korean J Community Nutr 2011; 16(4): 473-487.Article
REFERENCES

Table 1Salt content and salinity of menu groups from kindergarten meals
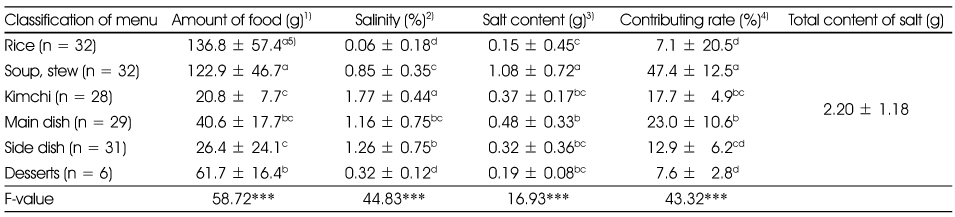
1) Weight of food supplied supplied for each meal (g)
2) Measured by salimeter (%)
3) Amount of food multiplied by salinity × 0.01 (g)
4) Salt content of each dish group divided by total salt content of the meal × 100 (%)
5) Mean±SD
abcd: Means with different superscripts are significantly different among groups by Duncan's multiple range test
***: p < 0.001
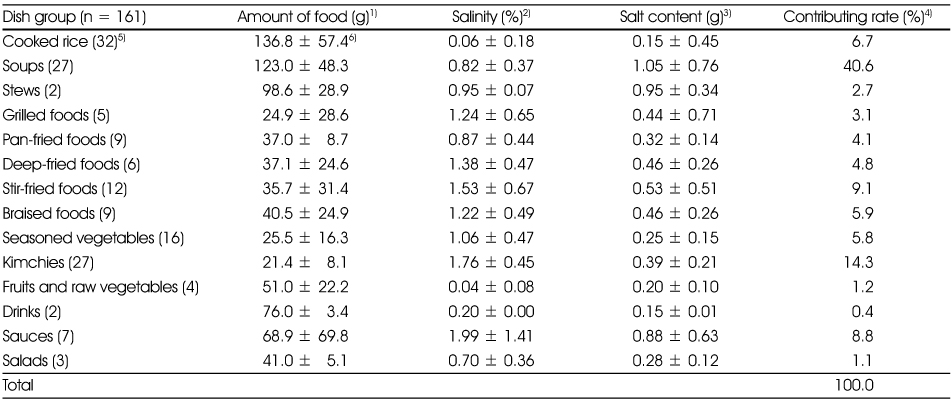
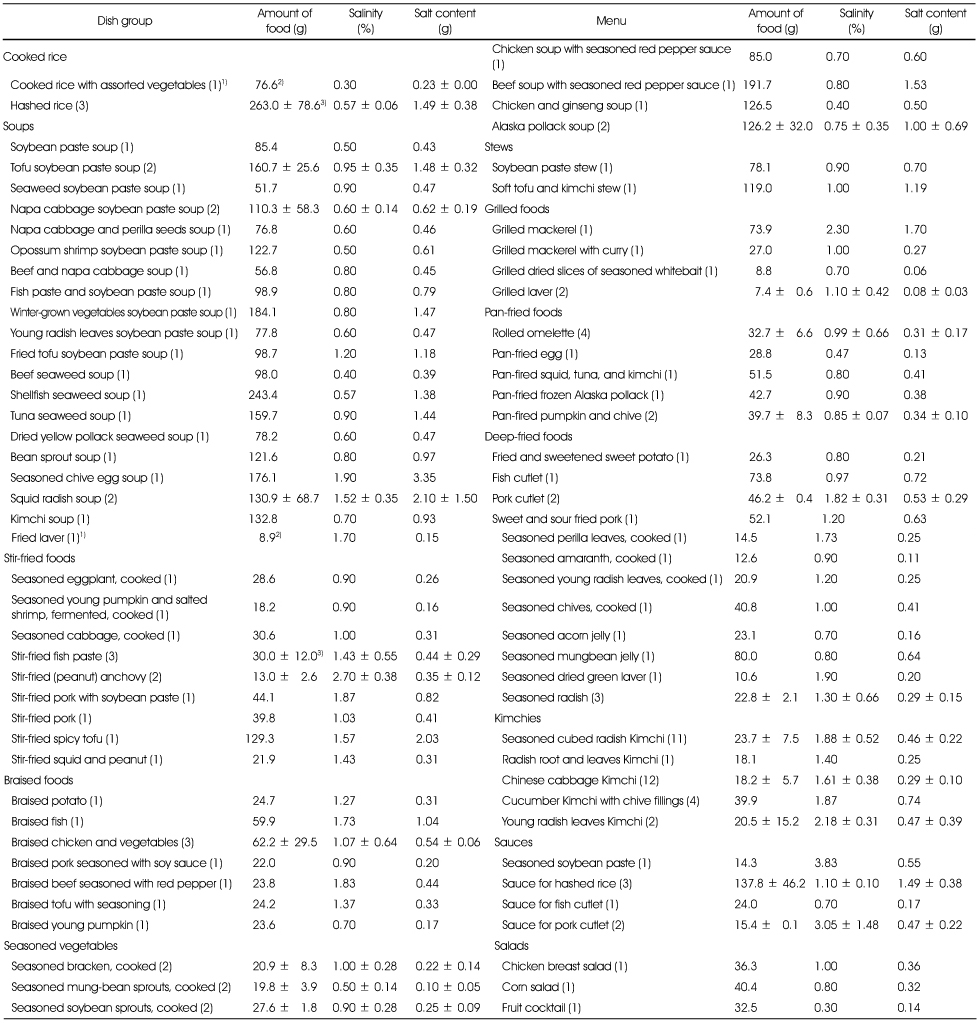
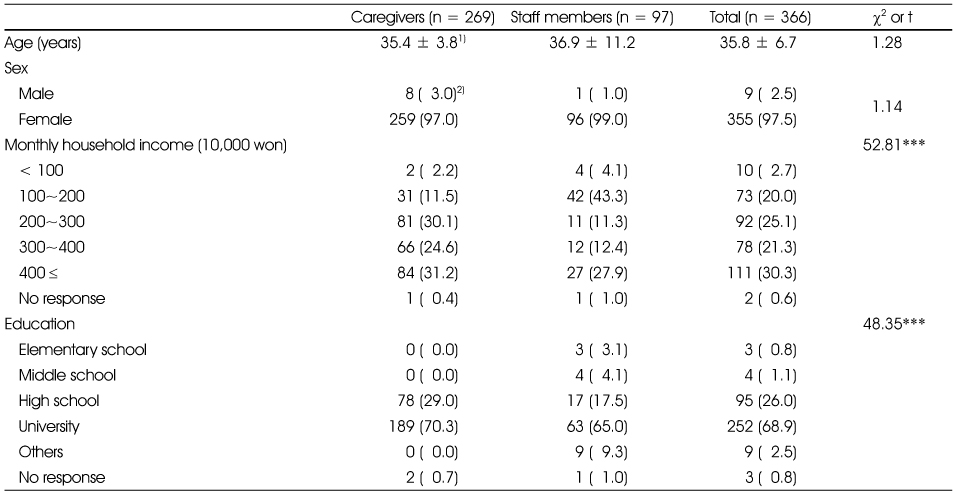
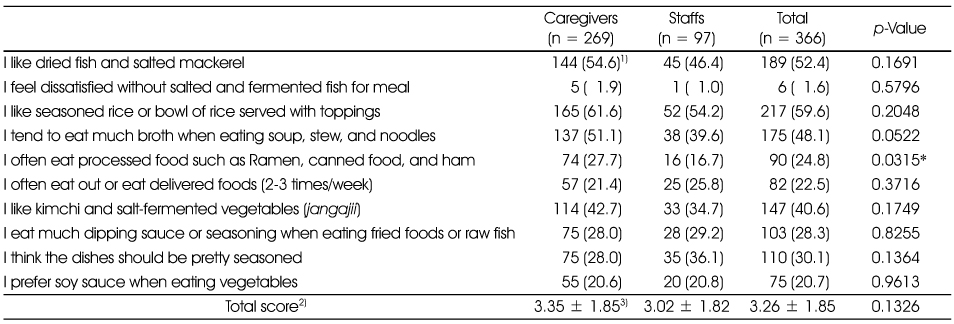
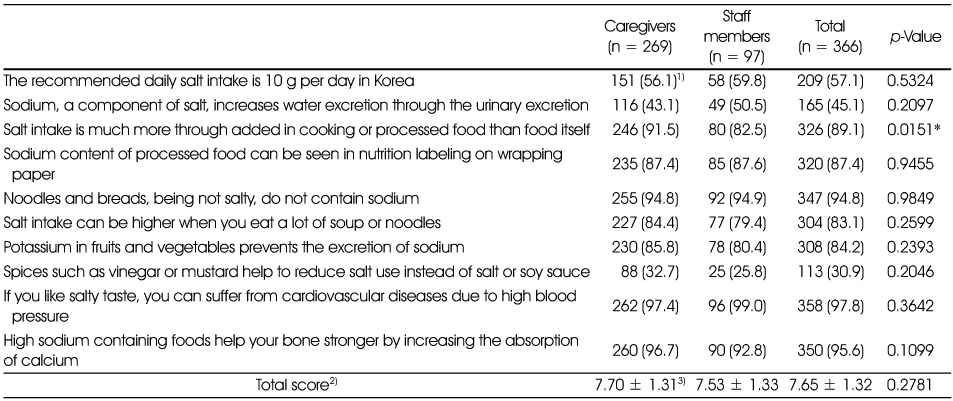
Table 7Dish frequency questionnaire (DFQ)
1) Mean ± SD, Standard score is 'Once per week = 1'.
2) Except bibimguksu, noodles mixed with vegetables and red pepper sauce
3) Sum of values calculated by multiplying weighed score according to the sodium content of serving size and consumption frequency (adopted from Son et al 2005)
*: p < 0.05, **: p < 0.01 ***: p < 0.001 significantly different between the groups by t-test
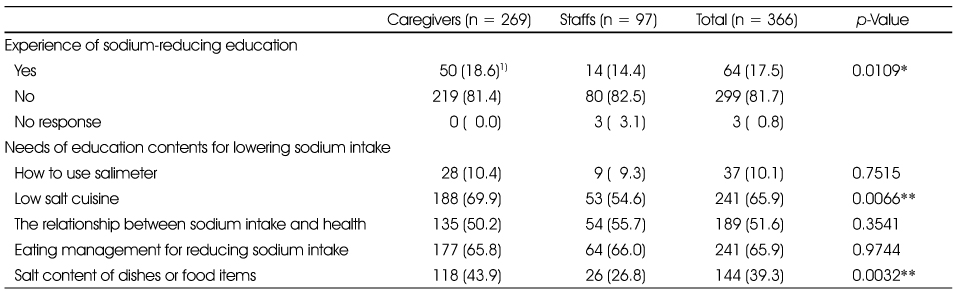
Figure & Data
REFERENCES
Citations
Citations to this article as recorded by 
- Changes in the importance and performance of low-sodium management among childcare center cooks in Yongin, South Korea, after salinometer support programs: a descriptive study
Jiwoo Min, Youngmi Lee, Yunhee Chang, Yujin Lee
Korean Journal of Community Nutrition.2024; 29(4): 304. CrossRef - Sodium Reduction Practice and Importance-Performance Analysis of Sodium Reduction Methods in School Foodservice in Daegu
Su-Hyeon Kim, Eun-Kyung Shin, Yeon-Kyung Lee
Korean Journal of Community Nutrition.2020; 25(5): 386. CrossRef - Dietary status of young children in Korea based on the data of 2013 ~ 2015 Korea National Health and Nutrition Examination Survey
Eun-kyung Kim, Byengchun Song, Se-Young Ju
Journal of Nutrition and Health.2018; 51(4): 330. CrossRef - Effects of a Practice Program for Low-Salt Meals on Infant Foodservices : Focusing on Infant Foodservices registered in Center for Children's Foodservice Management in Busan Metropolitan City
Chae-Young Jo, Jin-Suk Han
Journal of the East Asian Society of Dietary Life.2018; 28(1): 66. CrossRef - Comparison of nutrients and food intakes of young children according to lunch places: based on the fifth Korea National Health and Nutrition Examination Survey
Young-Sun Choi
Journal of Nutrition and Health.2018; 51(3): 254. CrossRef - Status of Recognition, Effort, and Satisfaction of Customers on Low-Sodium Diet in Industry Foodservice
Sang Jin Yoon, Kun Og Kang
Journal of the East Asian Society of Dietary Life.2017; 27(2): 168. CrossRef - Salinity Monitoring of Soups of The Institutions Enrolled at Center for Children’s Foodservice Management
Hyun Nae Park, Soon Mi Kim
Journal of the East Asian Society of Dietary Life.2016; 26(6): 507. CrossRef - School Dietitian Awareness, Practice, and Sodium Reduction Plan in School Meal Service
Eun Kyung Kim, Hae Young Kim
Korean Journal of Food & Cookery Science.2016; 32(2): 222. CrossRef - Survey on Actual Situation and Importance of Use of Snacks according to Young Children Mother’s Nutrition Knowledge
Sun-Hyun Kim, Geum-Soon Park
Journal of the East Asian Society of Dietary Life.2016; 26(2): 141. CrossRef - Study on the Salt and Sodium Content of Middle School Lunch Meals in Gyeongsangbuk-do Area - Focus on Application of 'SamSam Foodservice' -
So-Young Park, Kyung-A Lee
Journal of the Korean Society of Food Science and Nutrition.2016; 45(5): 757. CrossRef - The awareness level and needs for education on reducing sugar consumption among mothers with preschool children
Younhee Lee, Nami Joo
Nutrition Research and Practice.2016; 10(2): 229. CrossRef - Study on Sodium Contents of Kindergarten Lunch Meals in Gyeoungsangbuk-do Area
Dan-Bi Song, Kyung-A Lee
Korean Journal of Food & Cookery Science.2016; 32(5): 648. CrossRef - An Evaluation of the Foodservice Quality and Management of Preschool Foodservice Establishments by IPA - Focusing on Parents of Preschoolers in Metropolitan Area of Korea, China and Japan -
Sanghyun Park, Nami Joo
The Korean Journal of Food And Nutrition.2015; 28(1): 160. CrossRef - Sodium-related Eating Behaviors of Parents and Its Relationship to Eating Behaviors of Their Preschool Children
Ye Seul Kim, Hong Mie Lee, Jung Hee Kim
Korean Journal of Community Nutrition.2015; 20(1): 11. CrossRef - Nutrition knowledge, eating attitudes, nutrition behavior, self-efficacy of childcare center foodservice employees by stages of behavioral change in reducing sodium intake
Yun Ahn, Kyung Won Kim, Kyungmin Kim, Jinwon Pyun, Ikhyun Yeo, Kisun Nam
Journal of Nutrition and Health.2015; 48(5): 429. CrossRef - A Study on Eating Out Behavior and Recognition of Salinity in Restaurant Food in Jecheon Area
Soojin Park, Sung Hee Min
Journal of The Korean Society of Food Culture.2015; 30(1): 20. CrossRef - Assessment of Nutritional Status of Children in Community Child Center by Nutrition Quotient(NQ) - Gyeongiu -
Na-Hyung Kim
Journal of the East Asian Society of Dietary Life.2015; 25(1): 73. CrossRef - The Effectiveness of Na Reduction Program for Cook in Child-care Center: Focus on Self-reevaluation and Strengthen Consciousness
Hyewon Shin, Youngmee Lee
Korean Journal of Community Nutrition.2014; 19(5): 425. CrossRef
 Cite
CiteA Survey on the Salt Content of Kindergarten Lunch Meals and Meal Providers' Dietary Attitude to Sodium Intake in Gyeonggi-do Area
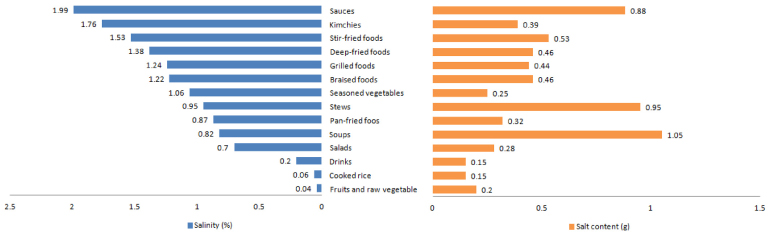
Fig. 1
The salinity and salt content of individual dish group.
Fig. 1
A Survey on the Salt Content of Kindergarten Lunch Meals and Meal Providers' Dietary Attitude to Sodium Intake in Gyeonggi-do Area
Salt content and salinity of menu groups from kindergarten meals
1) Weight of food supplied supplied for each meal (g)
2) Measured by salimeter (%)
3) Amount of food multiplied by salinity × 0.01 (g)
4) Salt content of each dish group divided by total salt content of the meal × 100 (%)
5) Mean±SD
abcd: Means with different superscripts are significantly different among groups by Duncan's multiple range test
***: p < 0.001
The salinity and salt content of dish groups served in kindergartens
1) Weight of food supplied for each meal (g)
2) Measured by salimeter (%)
3) Amount of food multiplied by salinity × 0.01 (g)
4) Sum of salt content of food in each dish group divided by total salt content × 100 (%)
5) N
6) Mean ± SD
The salinity and salt content of foods per serving
1) N
2) Mean
3) Mean ± SD
General characteristics of study subjects
1) Mean ± SD
2) N (%)
***: p < 0.001
Dietary attitude related to salt intake
1) N (%): Response rate of "Yes" in each item
2) Total number of 'yes' response in each subject
3) Mean ± SD
*: p < 0.05, significantly different between the groups by χ2-test
Nutrition knowledge related to salt intake
1) N (%): Response rate of "Yes" in each item
2) Total number of correct answer in each subject
3) Mean ± SD
*: p < 0.05, significantly different between the groups by χ2-test
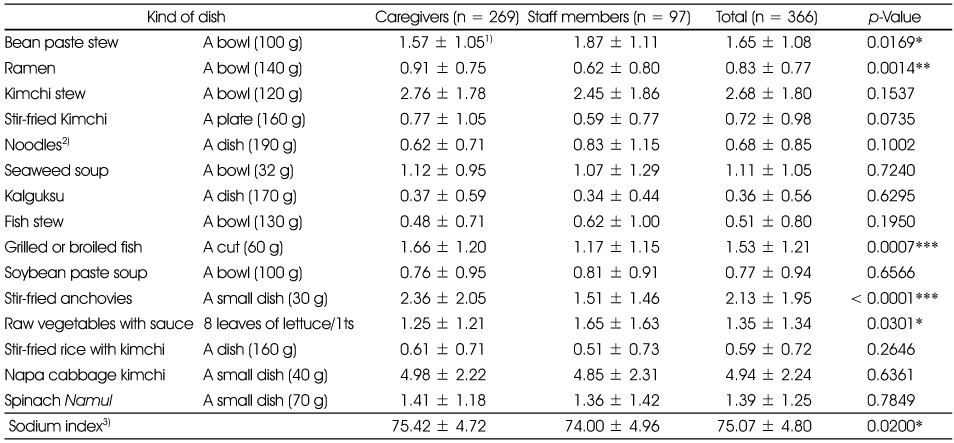
Dish frequency questionnaire (DFQ)
1) Mean ± SD, Standard score is 'Once per week = 1'.
2) Except bibimguksu, noodles mixed with vegetables and red pepper sauce
3) Sum of values calculated by multiplying weighed score according to the sodium content of serving size and consumption frequency (adopted from Son et al 2005)
*: p < 0.05, **: p < 0.01 ***: p < 0.001 significantly different between the groups by t-test
Experience of nutrition education and needs of education contents for lowering sodium intake
1) N (%): The frequency of answer in each item
*: p < 0.05, **: p < 0.01 significantly different between the groups by χ2-test
Table 1
Salt content and salinity of menu groups from kindergarten meals
1) Weight of food supplied supplied for each meal (g) 2) Measured by salimeter (%) 3) Amount of food multiplied by salinity × 0.01 (g) 4) Salt content of each dish group divided by total salt content of the meal × 100 (%) 5) Mean±SD abcd: Means with different superscripts are significantly different among groups by Duncan's multiple range test ***: p < 0.001
Table 2
The salinity and salt content of dish groups served in kindergartens
1) Weight of food supplied for each meal (g) 2) Measured by salimeter (%) 3) Amount of food multiplied by salinity × 0.01 (g) 4) Sum of salt content of food in each dish group divided by total salt content × 100 (%) 5) N 6) Mean ± SD
Table 3
The salinity and salt content of foods per serving
1) N 2) Mean 3) Mean ± SD
Table 4
General characteristics of study subjects
1) Mean ± SD 2) N (%) ***: p < 0.001
Table 5
Dietary attitude related to salt intake
1) N (%): Response rate of "Yes" in each item 2) Total number of 'yes' response in each subject 3) Mean ± SD *: p < 0.05, significantly different between the groups by χ2-test
Table 6
Nutrition knowledge related to salt intake
1) N (%): Response rate of "Yes" in each item 2) Total number of correct answer in each subject 3) Mean ± SD *: p < 0.05, significantly different between the groups by χ2-test
Table 7
Dish frequency questionnaire (DFQ)
1) Mean ± SD, Standard score is 'Once per week = 1'. 2) Except bibimguksu, noodles mixed with vegetables and red pepper sauce 3) Sum of values calculated by multiplying weighed score according to the sodium content of serving size and consumption frequency (adopted from Son et al 2005) *: p < 0.05, **: p < 0.01 ***: p < 0.001 significantly different between the groups by t-test
Table 8
Experience of nutrition education and needs of education contents for lowering sodium intake
1) N (%): The frequency of answer in each item *: p < 0.05, **: p < 0.01 significantly different between the groups by χ2-test


