Articles
- Page Path
- HOME > Korean J Community Nutr > Volume 19(3); 2014 > Article
-
Research Article
- Influence of Visual Differences in Bowl Size and Types on Dietary Intake of Female College Students with Normal Weight
- Young-Suk Kim, Un-Jae Chang
-
Korean Journal of Community Nutrition 2014;19(3):250-257.
DOI: https://doi.org/10.5720/kjcn.2014.19.3.250
Published online: June 30, 2014
Department of Food & Nutrition, Dongduk Women's University, Seoul, Korea.
- Corresponding author: Un-Jae Chang. Department of Food and Nutrition Dongduk Women's University, 23-1 Wolgok-dong, Seongbuk-gu, Seoul 136-714, Korea. Tel: (02) 940-4464, Fax: (02) 940-4609, uj@dongduk.ac.kr
Copyright © 2014 The Korean Society of Community Nutrition
This is an Open-Access article distributed under the terms of the Creative Commons Attribution Non-Commercial License (http://creativecommons.org/licenses/by-nc/3.0/) which permits unrestricted non-commercial use, distribution, and reproduction in any medium, provided the original work is properly cited.
- 1,012 Views
- 4 Download
- 2 Crossref
Figure & Data
REFERENCES
Citations

- Effects of Food Consumption Monitoring Using Modified Rice Bowls on Food Intake, Satiety Rate, and Eating Rate
Young-Suk Kim, Un-Jae Chang
Journal of the Korean Dietetic Association.2015; 21(3): 194. CrossRef - Dietary Intervention Strategies to Reduce Energy Intake in Diabetes
Mi Ra Rho
The Journal of Korean Diabetes.2015; 16(1): 43. CrossRef


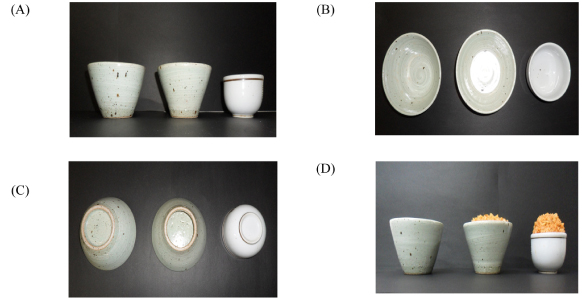
Fig. 1
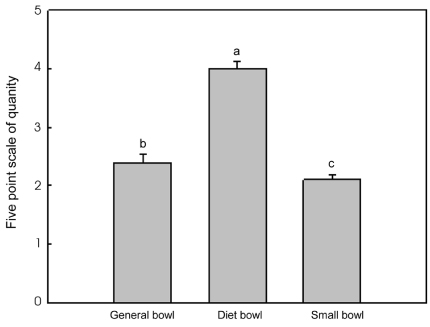
Fig. 2
Nutrient composition of raw material in Kimchi fried rice
Subject characteristic in this study
1) Mean ± SD
2) Body mass index, body weight (kg) / [height (m)]2
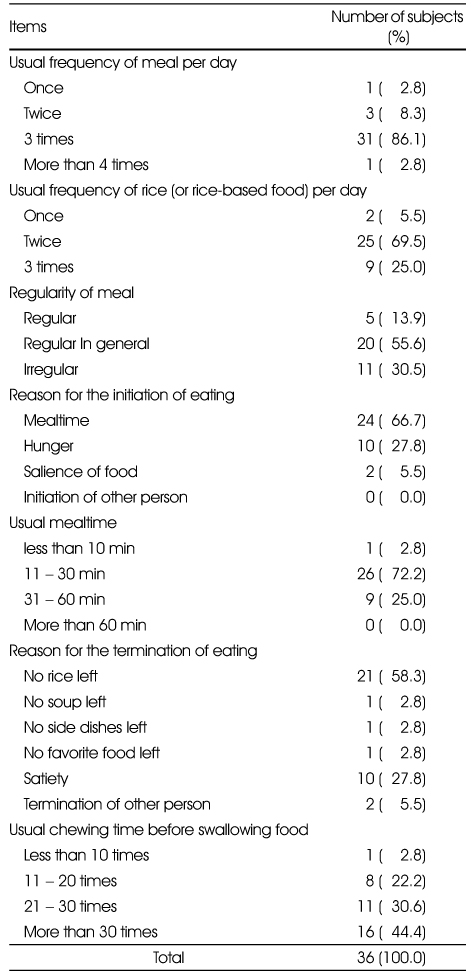
Usual eating behavior of subjects
Energy intake of Kimchi fried rice provided by general rice bowl, diet rice bowl and small rice bowl
Values are Mean ± SD for 36 subjects. Values were analyzed with an ANOVA followed by Bonferroni-adjusted post hoc test. Different letters indicate significant differences (p < 0.05) among bowls
1) General rice bowl vs. Diet rice bowl, p = 0.212
2) Diet rice bowl vs. Small rice bowl, p = 0.041
3) General rice bow vs. Small rice bowl, p = 0.048
Satiety rate of Kimchi fried rice provided by general rice bowl, diet rice bowl and small rice bowl
Values are Mean ± Standard deviation for 36 subjects. Values were analyzed with a repeated measure ANOVA followed by Bonferroni-adjusted post hoc test. Different letters indicate significant differences (p < 0.05) among bowls.
1) Mean ± SD 2) Body mass index, body weight (kg) / [height (m)]2
Values are Mean ± SD for 36 subjects. Values were analyzed with an ANOVA followed by Bonferroni-adjusted post hoc test. Different letters indicate significant differences (p < 0.05) among bowls 1) General rice bowl vs. Diet rice bowl, p = 0.212 2) Diet rice bowl vs. Small rice bowl, p = 0.041 3) General rice bow vs. Small rice bowl, p = 0.048
Values are Mean ± Standard deviation for 36 subjects. Values were analyzed with a repeated measure ANOVA followed by Bonferroni-adjusted post hoc test. Different letters indicate significant differences (p < 0.05) among bowls.

 KSCN
KSCN


 Cite
Cite


