Articles
- Page Path
- HOME > Korean J Community Nutr > Volume 18(4); 2013 > Article
-
Original Article
- Factors Related to Calceneal Broadband Ultrasound Attenuation, Anthropometric Indexes and Nutrient Intakes among Elementary School Children in Chungnam
- Ye-Jung Kim, Yoon Jeong Choi, Hee-Seon Kim
-
Korean Journal of Community Nutrition 2013;18(4):312-323.
DOI: https://doi.org/10.5720/kjcn.2013.18.4.312
Published online: August 31, 2013
Department of Food Science and Nutrition, Soonchunhyang University, Asan, Korea.
- Corresponding author: Hee-Seon Kim, Department of Food Science and Nutrition, Soonchunhyang University, 646 Eupnae-ri, Shinchang-myun, Asan-si, Choongnam 336-745, Republic of Korea. Tel: (041) 530-1263, Fax: (041) 530-1264, hskim1@sch.ac.kr
Copyright © 2013 The Korean Society of Community Nutrition
This is an Open-Access article distributed under the terms of the Creative Commons Attribution Non-Commercial License (http://creativecommons.org/licenses/by-nc/3.0/) which permits unrestricted non-commercial use, distribution, and reproduction in any medium, provided the original work is properly cited.
- 1,142 Views
- 0 Download
- 3 Crossref
Figure & Data
REFERENCES
Citations

- Children's Food Intake and Nutrition Levels, and Obesity by Maternal Employment: Based on the Korea National Health and Nutrition Examination Survey 2013–2015
Geunyeong Kang, Yoonna Lee, Mihyang UM, Seunghee Kye
Korean Journal of Community Nutrition.2019; 24(4): 331. CrossRef - Effects of Nutrition Education Using Dietary Guidebook in Higher Grade Elementary Students of Jeonbuk Area
Mi-Ran Park, Sook-Bae Kim
Korean Journal of Community Nutrition.2018; 23(1): 13. CrossRef - Effects of Dietary Education on Elementary Children in After-school Program in Seoul
Kyung-Hee Kim
Journal of the Korean Society of Food Culture.2014; 29(2): 222. CrossRef
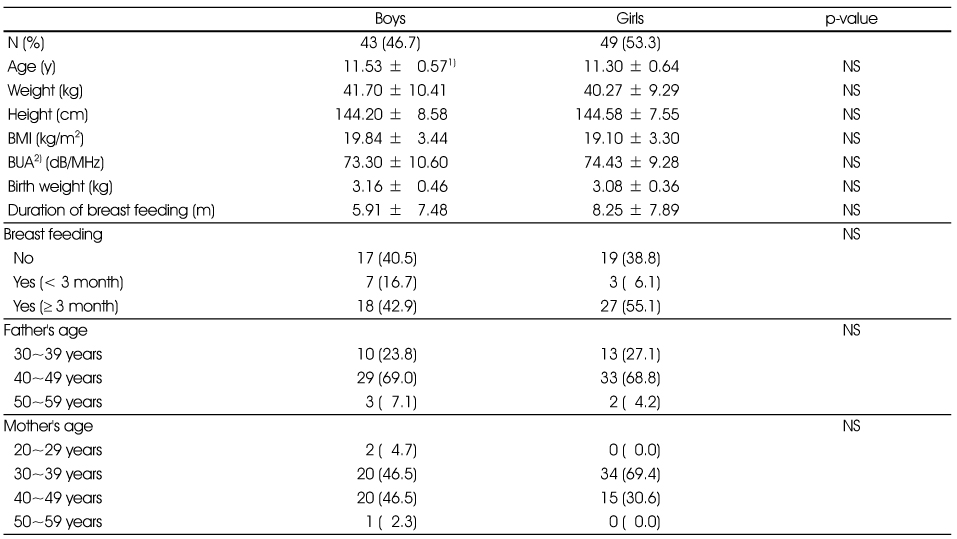
General characteristics of the subjects by gender
1) Mean ± SD
2) Broadband ultrasound attenuation (BUA)
NS: Not significant
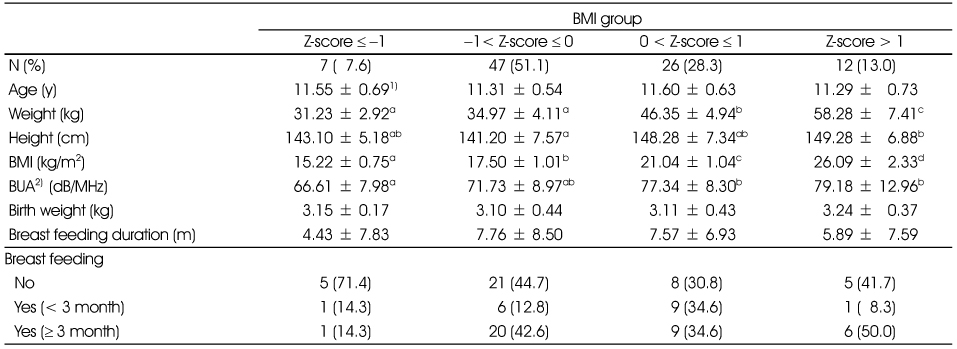
Comparison of the variables by the BMI of the study subjects
1) Mean ± SD
2) Broadband ultrasound attenuation (BUA)
abc: Values with different superscript letters within a row are significantly different based on one-way ANOVA followed by Tukey's post hoc test
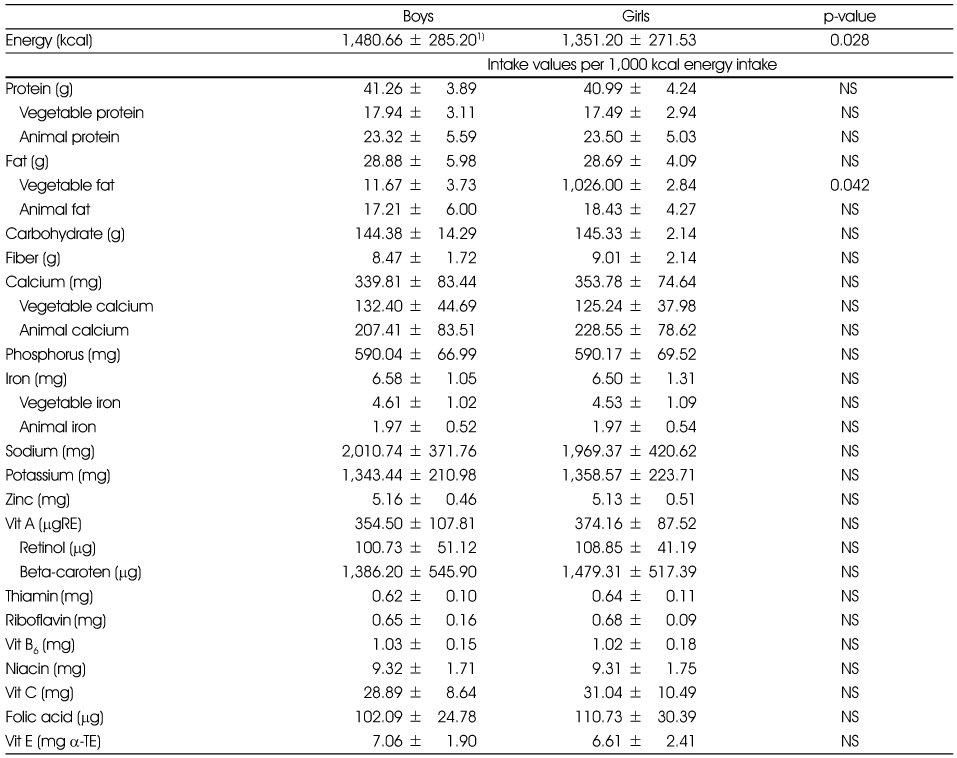
Dietary intakes of the subjects by sex
1) Mean ± SD
NS: Not significant
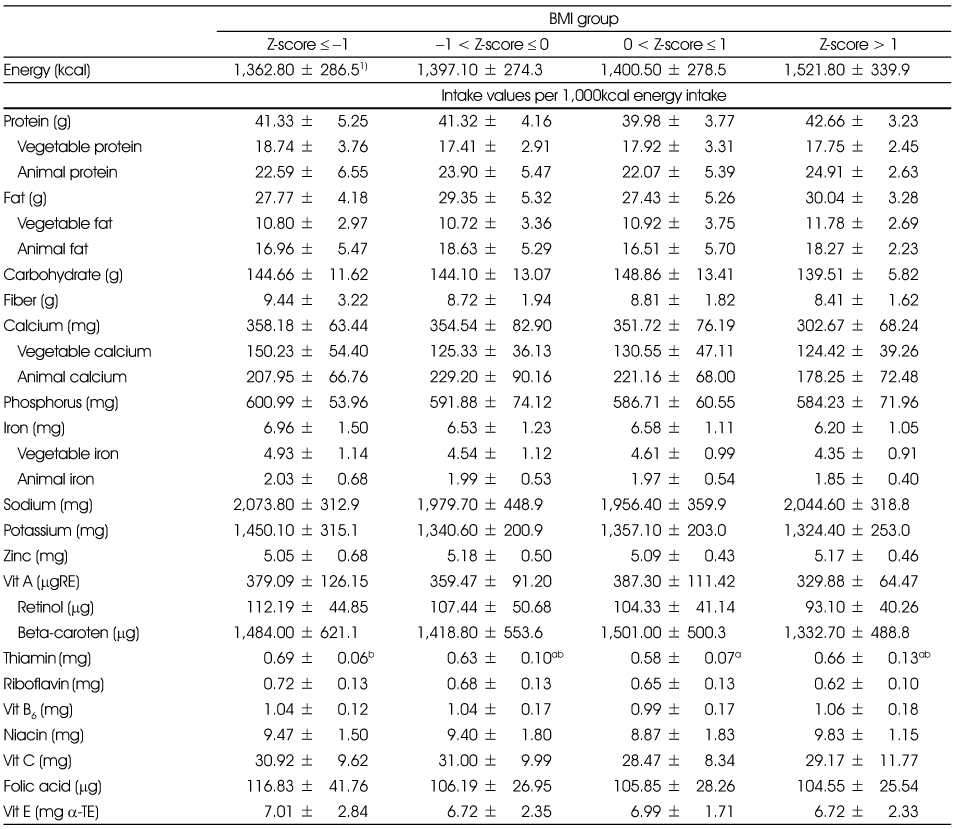
Dietary intakes of the subjects by the BMI group
1) Mean ± SD
ab: Values with different superscript letters within a row are significantly different based on one-way ANOVA followed by Tukey's post hoc test
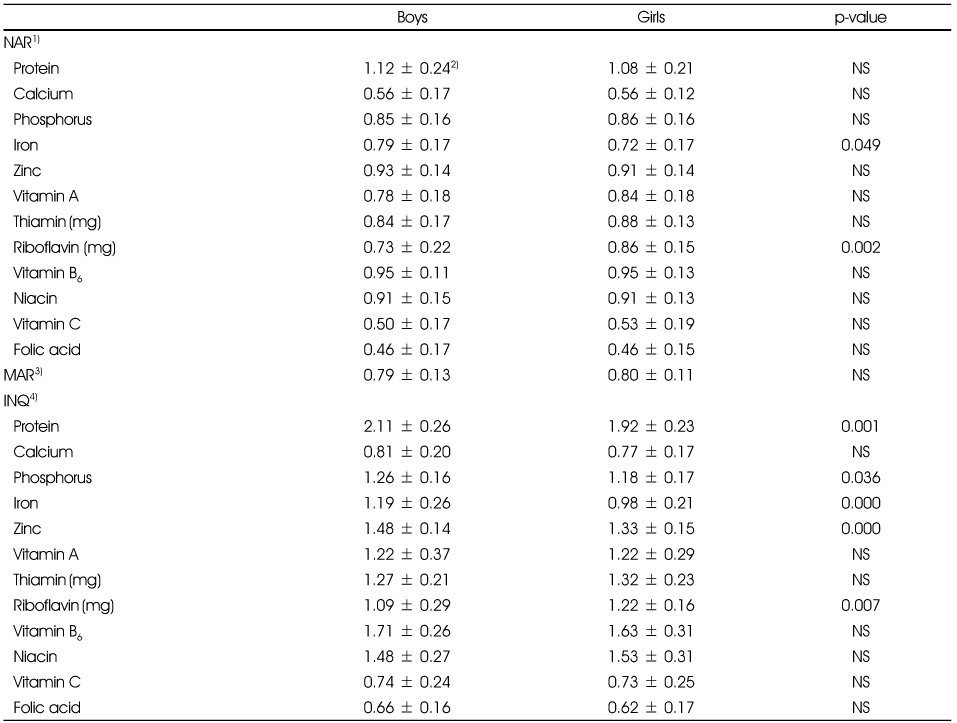
Evaluation of diet quality by sex
1) Nutrient Adequacy Ratio (NAR)
2) Mean ± SD
3) Mean Adequacy Ratio (MAR)
4) Index of Nutrition Quality (INQ)
NS: Not significant
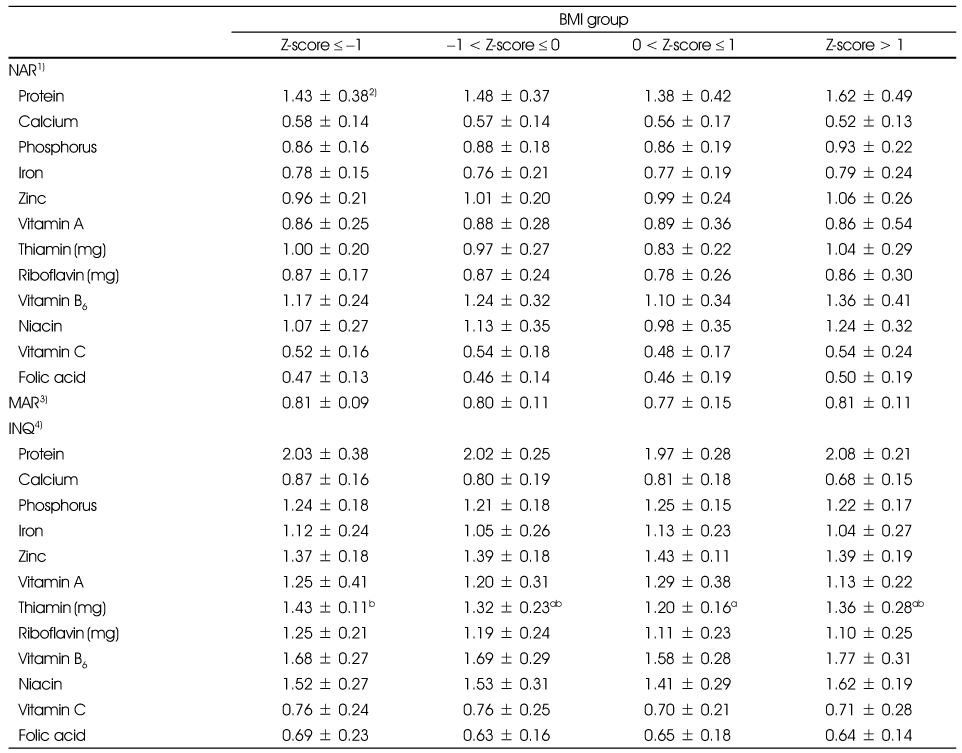
Evaluation of diet quality by the BMI group
1) Nutrient adequacy ratio (NAR)
2) Mean ± SD
3) Mean adequacy ratio (MAR)
4) Index of Nutrition Quality (INQ)
ab: Values with different superscript letters within a row are significantly different based on one-way ANOVA followed by Tukey's post hoc test
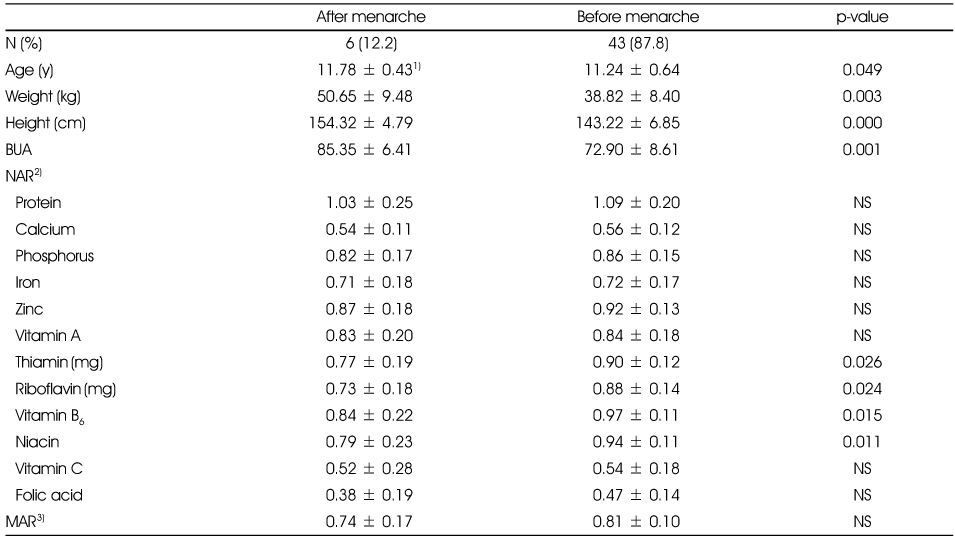
Anthropometric and dietary quality of the girls by menstrual status
1) Mean ± SD
2) Nutrient adequacy ratio (NAR)
3) Mean adequacy ratio (MAR)
NS: Not significant
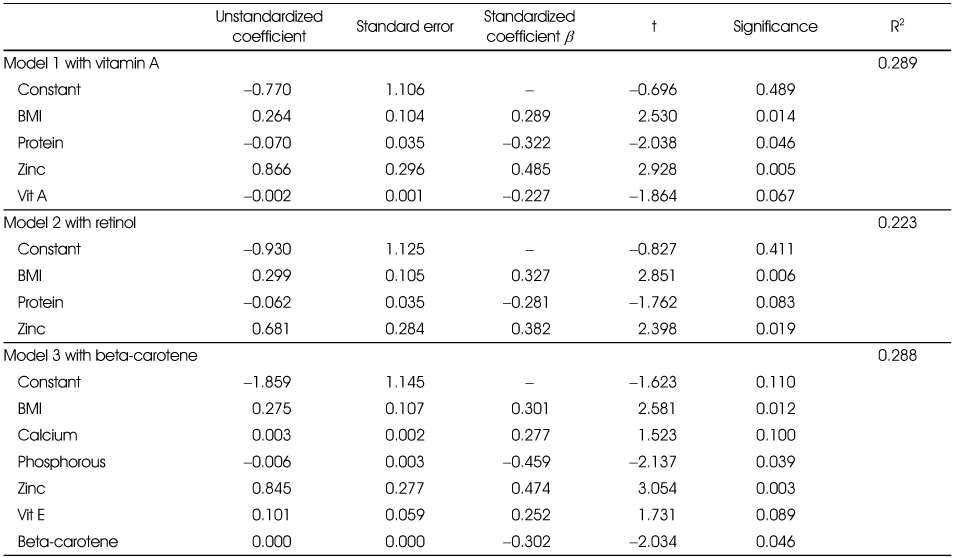
Summary of multiple regression model fit by backward elimination1) for z-score of BUA as a dependant variable
1) Significant level for stay (SLS) was 0.10
1) Mean ± SD 2) Broadband ultrasound attenuation (BUA) NS: Not significant
1) Mean ± SD 2) Broadband ultrasound attenuation (BUA) abc: Values with different superscript letters within a row are significantly different based on one-way ANOVA followed by Tukey's post hoc test
1) Mean ± SD NS: Not significant
1) Mean ± SD ab: Values with different superscript letters within a row are significantly different based on one-way ANOVA followed by Tukey's post hoc test
1) Nutrient Adequacy Ratio (NAR) 2) Mean ± SD 3) Mean Adequacy Ratio (MAR) 4) Index of Nutrition Quality (INQ) NS: Not significant
1) Nutrient adequacy ratio (NAR) 2) Mean ± SD 3) Mean adequacy ratio (MAR) 4) Index of Nutrition Quality (INQ) ab: Values with different superscript letters within a row are significantly different based on one-way ANOVA followed by Tukey's post hoc test
1) Mean ± SD 2) Nutrient adequacy ratio (NAR) 3) Mean adequacy ratio (MAR) NS: Not significant
1) Significant level for stay (SLS) was 0.10

 KSCN
KSCN
 Cite
Cite


