
Articles
- Page Path
- HOME > Korean J Community Nutr > Volume 21(1); 2016 > Article
-
Research Article
- Correlations Among Threshold and Assessment for Salty Taste and High-salt Dietary Behavior by Age
-
Lin Jiang, Yun-Young Jung, Yeon-Kyung Lee

-
Korean Journal of Community Nutrition 2016;21(1):75-83.
DOI: https://doi.org/10.5720/kjcn.2016.21.1.75
Published online: February 29, 2016
Department of Food Science and Nutrition, Kyungpook National University, Daegu, Korea.
- Corresponding author: Yeon-Kyung Lee. Department of Food Science and Nutrition, Kyungpook National University, 80 Daehakro, Bukgu, Daegu, 41566, Korea. Tel: (053) 950-6234, Fax: (053) 950-6229, yklee@knu.ac.kr
• Received: February 11, 2016 • Revised: February 18, 2016 • Accepted: February 25, 2016
Copyright © 2016 The Korean Society of Community Nutrition
This is an Open-Access article distributed under the terms of the Creative Commons Attribution Non-Commercial License (http://creativecommons.org/licenses/by-nc/3.0/) which permits unrestricted non-commercial use, distribution, and reproduction in any medium, provided the original work is properly cited.
- 2,279 Views
- 11 Download
- 5 Crossref
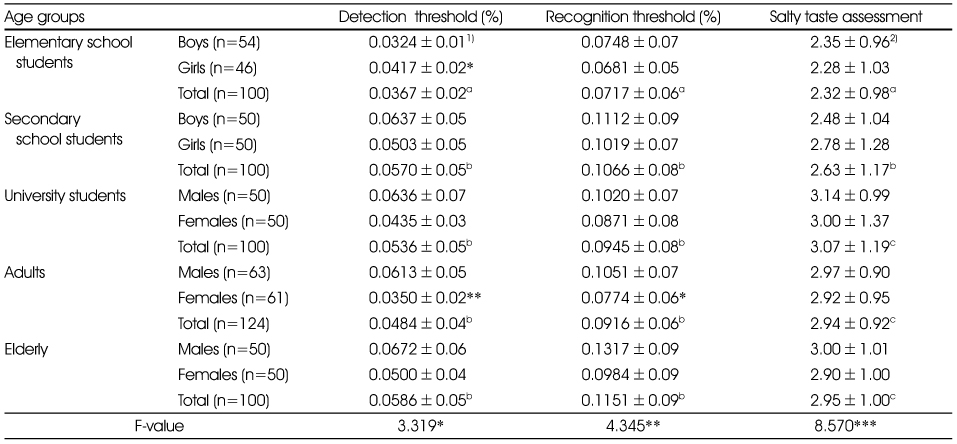
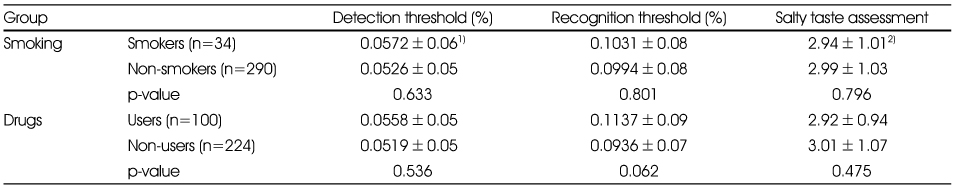
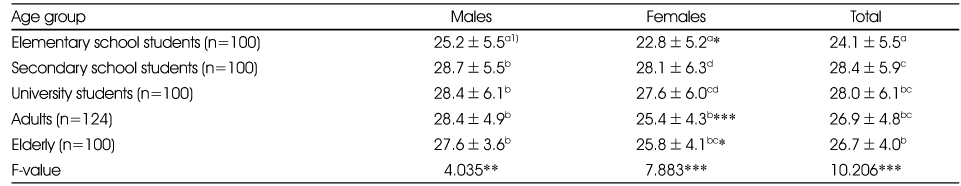
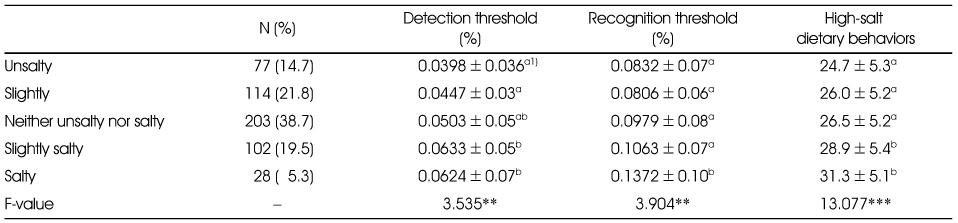
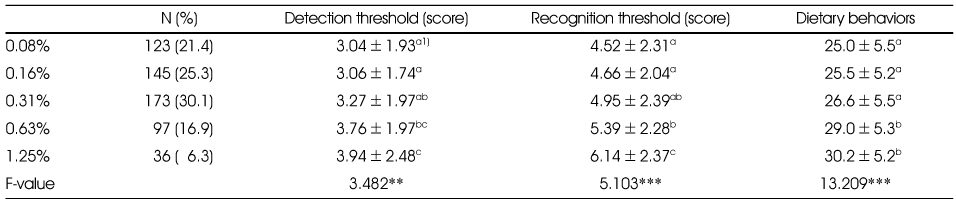
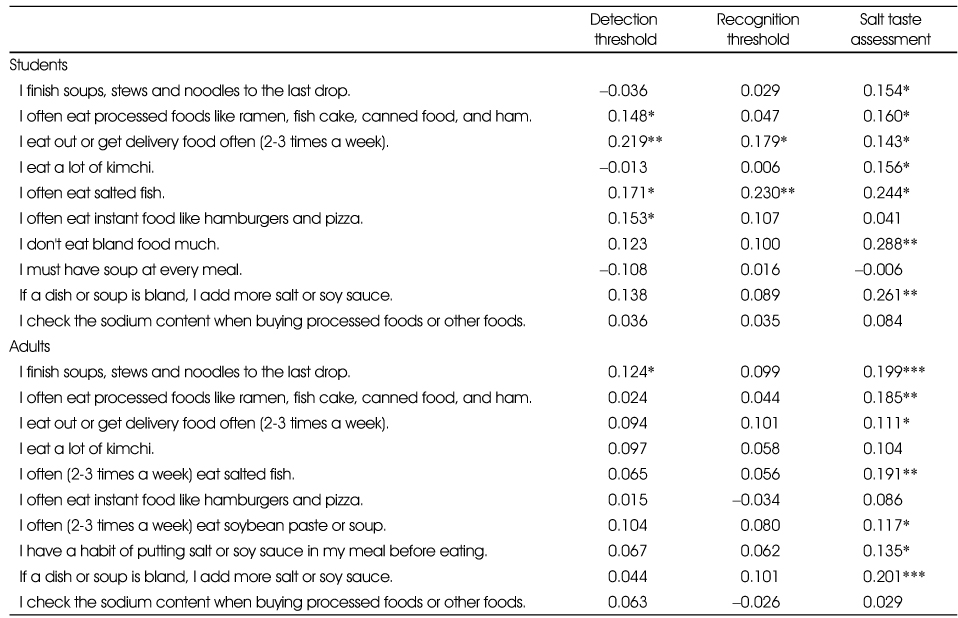
Figure & Data
REFERENCES
Citations
Citations to this article as recorded by 
- Detection and Recognition Thresholds for Basic Tastes among Koreans
Yu Jin Lee, Seyeong Park, Gyeonghye Yoon, Han Sub Kwak
Journal of the Korean Society of Food Science and Nutrition.2025; 54(3): 295. CrossRef - Consumer's Preference for Bibimnaengmyeon Sauce Supplemented with Different Amounts of Watermelon Powder
Ji-U Jin, Mi-Sook Cho, Ji-Eun Oh
Journal of the Korean Society of Food Science and Nutrition.2022; 51(6): 561. CrossRef - Comparison of Taste Preferences, Eating Behaviors, and Dietary Habits according to Age of the Elderly in Chungcheong-do
Eun-Sun Park, Mi-Kyeong Choi
Journal of the East Asian Society of Dietary Life.2019; 29(2): 139. CrossRef - Unstimulated saliva: Background noise in taste molecules
Gilles Feron
Journal of Texture Studies.2019; 50(1): 6. CrossRef - Altered Salivary Flow, Protein Composition, and Rheology Following Taste and TRP Stimulation in Older Adults
Rose-Anna Grace Pushpass, Blánaid Daly, Charles Kelly, Gordon Proctor, Guy Howard Carpenter
Frontiers in Physiology.2019;[Epub] CrossRef
 Cite
CiteCorrelations Among Threshold and Assessment for Salty Taste and High-salt Dietary Behavior by Age
Correlations Among Threshold and Assessment for Salty Taste and High-salt Dietary Behavior by Age
Comparison of the detection threshold, recognition threshold and salt taste assessment by age groups
1) Mean±SD
2) Total score of salty taste assessment is 5.
*: p < 0.05, **: p < 0.01, ***: p < 0.001
Values with the different small superscript are significantly different among subjects by Duncan's multiple range test.
Comparison of the detection threshold, recognition threshold and salt taste assessment by smoking and drug use
1) Mean±SD
2) Total score of salty taste assessment is 5.
Comparison of high-salt dietary behavior by age groups
1) Mean±SD
*: p < 0.05, **: p < 0.01, ***: p < 0.001
abc: Values with the different small superscript are significantly different among subjects by Duncan's multiple range test. Total score of high-salt dietary behavior is 50.
Comparison of the detection threshold, recognition threshold, and dietary behaviors by salty taste assessment
1) Mean±SD
**: p < 0.01, ***: p < 0.001
ab: Values with the different small superscript are significantly different among subjects by Duncan's multiple range test.
Total scores of dietary attitudes and dietary behaviors were 50.
Comparison of the detection threshold, recognition threshold, high-salt dietary attitude and dietary behaviors by taste preference
1) Mean±SD
**: p < 0.01, ***: p < 0.001
abc: Values with the different small superscript are significantly different among subjects by Duncan's multiple range test.
The score of detection threshold and recognition threshold 1: 0.0175%, 2: 0.0233%, 3: 0.0350%, 4: 0.0467%, 5: 0.0701%, 6: 0.0933%, 7; 0.1403%, 8: 0.1987%, 9: 0.2631%, 10: 0.351%
Total score of high-salt dietary behavior is 50.
Correlation coefficients by between high-salt behavior, and detection threshold, recognition threshold and salt taste assessment
*: p < 0.05, **: p < 0.01, ***: p < 0.001
Table 1
Comparison of the detection threshold, recognition threshold and salt taste assessment by age groups
1) Mean±SD 2) Total score of salty taste assessment is 5. *: p < 0.05, **: p < 0.01, ***: p < 0.001 Values with the different small superscript are significantly different among subjects by Duncan's multiple range test.
Table 2
Comparison of the detection threshold, recognition threshold and salt taste assessment by smoking and drug use
1) Mean±SD 2) Total score of salty taste assessment is 5.
Table 3
Comparison of high-salt dietary behavior by age groups
1) Mean±SD *: p < 0.05, **: p < 0.01, ***: p < 0.001 abc: Values with the different small superscript are significantly different among subjects by Duncan's multiple range test.
Total score of high-salt dietary behavior is 50.
Table 4
Comparison of the detection threshold, recognition threshold, and dietary behaviors by salty taste assessment
1) Mean±SD **: p < 0.01, ***: p < 0.001 ab: Values with the different small superscript are significantly different among subjects by Duncan's multiple range test. Total scores of dietary attitudes and dietary behaviors were 50.
Table 5
Comparison of the detection threshold, recognition threshold, high-salt dietary attitude and dietary behaviors by taste preference
1) Mean±SD **: p < 0.01, ***: p < 0.001 abc: Values with the different small superscript are significantly different among subjects by Duncan's multiple range test. The score of detection threshold and recognition threshold 1: 0.0175%, 2: 0.0233%, 3: 0.0350%, 4: 0.0467%, 5: 0.0701%, 6: 0.0933%, 7; 0.1403%, 8: 0.1987%, 9: 0.2631%, 10: 0.351% Total score of high-salt dietary behavior is 50.
Table 6
Correlation coefficients by between high-salt behavior, and detection threshold, recognition threshold and salt taste assessment
*: p < 0.05, **: p < 0.01, ***: p < 0.001


