
Articles
- Page Path
- HOME > Korean J Community Nutr > Volume 19(5); 2014 > Article
-
Research Article
- A Comparison between Asia-Pacific Region Criteria and Entropy Model Criteria about Body Mass Index of Elderly Females Using Morbidity of Chronic Disease
- Gu-Beom Jeong, Jin-Yong Park, Se-Young Kwon, Kyung-Ok Park, Pil-Sook Park, Mi-Yeon Park
-
Korean Journal of Community Nutrition 2014;19(5):490-498.
DOI: https://doi.org/10.5720/kjcn.2014.19.5.490
Published online: October 31, 2014
1School of Computer Information, Kyungpook National University, Sangju, Korea.
2Department of Microbiology, Gyeongsang National University Medical School, Jinju, Korea.
3Department of Biomedical Laboratory Science, Daegu Health College, Daegu, Korea.
4Department of Statistics and Actuarial Science, Soongsil University, Seoul, Korea.
5Department of Food Science & Nutrition, Kyungpook National University, Daegu, Korea.
6Department of Food & Nutrition, Gyeongsang National University, Jinju, Korea.
- Corresponding author: Mi-Yeon Park. Department of Food & Nutrition, Gyeongsang National University, 501, Jinju-daero, Jinju, Gyeongnam 660-701, Korea. Tel: (055) 772-1438, Fax: (055) 772-1439, mypark@gnu.ac.kr
• Received: August 5, 2014 • Revised: September 29, 2014 • Accepted: October 5, 2014
Copyright © 2014 The Korean Society of Community Nutrition
This is an Open-Access article distributed under the terms of the Creative Commons Attribution Non-Commercial License (http://creativecommons.org/licenses/by-nc/3.0/) which permits unrestricted non-commercial use, distribution, and reproduction in any medium, provided the original work is properly cited.
- 1,598 Views
- 0 Download
- 2 Crossref
Abstract
-
Objectives
- This study was conducted to propose the need of re-establishing the criteria of the body weight classification in the elderly. We compared the Asia-Pacific Region Criteria (APR-C) with Entropy Model Criteria (ENT-C) using Morbidity rate of chronic diseases which correlates significantly with Body Mass Index (BMI).
-
Methods
- Subjects were 886 elderly female participating in the 2007-2009 Korea National Health and Nutrition Examination Survey (KNHANES). We compared APR-C with those of ENT-C using Receiver Operating Characteristics (ROC) curve and logistic regression analysis.
-
Results
- In the case of the morbidity of hypertension, the results were as follows: Where it was in the T-off point of APR-C, sensitivity was 67.5%, specificity was 43.1%, and Youden's index was 10.6. While in the cut-off point of ENT-C, it was 56.7%, 56.6%, and 13.3 respectively. In the case of the morbidity of diabetes, the results were as follows: In the cut-off point of APR-C, Youden's index was 14.2. While in the cut-off point of ENT-C, it was 17.2 respectively. The Area Under the ROC Curve (AUC) of the subjects who had more than 2 diseases among hypertension, diabetes, and dyslipidemia was 0.615 (95% CI: 0.578-0.652). Compared to the normal group, the odds ratio of the hypertension group which will belong to the overweight or obesity was 1.79 (95% CI: 1.30-2.47) in the APR-C, and 2.04 (95% CI: 1.49-2.80) in the ENT-C (p > 0.001).
-
Conclusions
- We conclude that the optimal cut-off point of BMI to distinguish between normal weight and overweight was 24 kg/m2 (ENT-C) rather than 23 kg/m2 (APR-C).
Acknowledgments
Acknowledgments
- 1. Balagopal P, Rooyackers OE, Adey DB, Ades PA, Nair KS. Effects of aging on in vivo synthesis of skeletal muscle myosin heavy-chain and sarcoplasmic protein in humans. Am J Physiol 1997; 273(4 Pt 1): E790-E800.ArticlePubMed
- 2. Cao L, Shi Z, Cheng EK. Fast automatic multilevel thresholding method. Electron Lett 2002; 38(16): 868-870.Article
- 3. Deurenberg P, Weststrate JA, Seidell JC. Body mass index as a measure of body fatness: age- and sex-specific prediction formulas. Br J Nutr 1991; 65(2): 105-114.ArticlePubMed
- 4. Ding C, Stannus O, Cicuttini F, Antony B, Jones G. Body fat is associated with increased and lean mass with decreased knee cartilage loss in older adults: a prospective cohort study. Int J Obes (Lond) 2013; 37(6): 822-827.ArticlePubMedPDF
- 5. Eom JS, Lee TR, Park SJ, Ahn Y, Chung YJ. The risk factors of the pre-hypertension and hypertension of rural inhabitants in Chungnam-do. Korean J Nutr 2008; 41(8): 742-753.
- 6. Garrow JS, Webster J. Quetelet's index (W/H2) as a measure of fatness. Int J Obes 1985; 9(2): 147-153.
- 7. Han TS, Tajar A, Lean ME. Obesity and weight management in the elderly. Br Med Bull 2011; 97: 169-196.ArticlePubMed
- 8. Huang KC, Lin WY, Lee LT, Chen CY, Lo H, Hsia HH, Liu IL, Shau WY, Lin RS. Four anthropometric indices and cardiovascular risk factors in Taiwan. Int J Obes Relat Metab Disord 2002; 26(8): 1060-1068.ArticlePubMedPDF
- 9. Hughes VA, Frontera WR, Roubenoff R, Evans WJ, Singh MA. Longitudinal changes in body composition in older men and women: role of body weight change and physical activity. Am J Clin Nutr 2002; 76(2): 473-481.ArticlePubMed
- 10. Kang JH, Ryu BY, Suh HS, Shim KW. Neck circumference as a simple obesity index. J Korean Soc Study Obes 2002; 11(2): 142-149.
- 11. Kim WK. The risk of hypertension according to obesity and age of middle-age women. Korean J Sports Sci 2010; 19(2): 1377-1384.
- 12. Statistics Korea. Korean statistical information system. Daejeon: Statistics Korea; 2013.
- 13. Lee YE, Park JE, Hwang JY, Kim WY. Comparison of health risks according to the obesity types based upon BMI and waist circumference in Korean adults: the 1998-2005 Korean National Health and Nutrition Examination Surveys. Korean J Nutr 2009; 42(7): 631-638.Article
- 14. Luukka P. Feature selection using fuzzy entropy measures with similarity classifier. Expert Syst Appl 2011; 38(4): 4600-4607.Article
- 15. Ministry of Health & Welfare. 2008 National Health Statistics-The 4th Korea National Health and Nutrition Examination Survey, the second year. 2009.
- 16. Ministry of Health & Welfare. 2010 National Health Statistics-The 5th Korea National Health and Nutrition Examination Survey, the second year. 2011.
- 17. Ministry of Health and Welfare, Korea Centers for Disease Control and Prevention. Korea Health Statistics 2012: Korea National Health and Nutrition Examination Survey (KNHANES V-3). Cheongwon: Korea Centers for Disease Control and Prevention; 2013.
- 18. Mirmiran P, Esmaillzadeh A, Azizi F. Detection of cardiovascular risk factors by anthropometric measures in Tehranian adults: receiver operating characteristic (ROC) curve analysis. Eur J Clin Nutr 2004; 58(8): 1110-1118.ArticlePubMedPDF
- 19. Nakas CT, Yiannoutsos CT. Ordered multiple-class ROC analysis with continuous measurements. Stat Med 2004; 23(22): 3437-3449.ArticlePubMed
- 20. National Heart Lung and Blood Institute. National Institute of Diabetes and Digestive and Kidney Diseases (US). Clinical guidelines on the identification, evaluation, and treatment of overweight and obesity in adults: the evidence report. Bethesda (MD): National Heart, Lung, and Blood Institute; 1998.
- 21. Ohwaki K, Yano E. Body mass index as an indicator of metabolic disorders in annual health checkups among Japanese male workers. Ind Health 2009; 47(6): 611-616.ArticlePubMed
- 22. Oreopoulos A, Kalantar-Zadeh K, Sharma AM, Fonarow GC. The obesity paradox in the elderly: potential mechanisms and clinical implications. Clin Geriatr Med 2009; 25(4): 643-659. viii.ArticlePubMed
- 23. Park MY, Kwon JH, Lee DJ, Cho EK, Park PS. A study on the dietary attitudes and nutritional status of lifestyle disease patients living on Tongyoung city. Korean J Health Promot Dis Prev 2004; 4(3): 137-147.
- 24. Roubenoff R. Sarcopenic obesity: the confluence of two epidemics. Obes Res 2004; 12(6): 887-888.ArticlePubMed
- 25. Van der Schouw YT, Verbeek AL, Ruijs JH. ROC curves for the initial assessment of new diagnostic tests. Fam Pract 1992; 9(4): 506-511.ArticlePubMed
- 26. Shannon CE. A mathematical theory of communication. Bell Syst Tech J 1948; 27(3): 379-423.Article
- 27. Smith AG, Singleton JR. Obesity and hyperlipidemia are risk factors for early diabetic neuropathy. J Diabetes Complications 2013; 27(5): 436-442.ArticlePubMedPMC
- 28. Sullivan PW, Ghushchyan VH, Ben-Joseph R. The impact of obesity on diabetes, hyperlipidemia and hypertension in the United States. Qual Life Res 2008; 17(8): 1063-1071.ArticlePubMedPDF
- 29. Swets JA. Measuring the accuracy of diagnostic systems. Science 1988; 240(4857): 1285-1293.ArticlePubMed
- 30. Wakabayashi I. Relationships of body mass index with blood pressure and serum cholesterol concentrations at different ages. Aging Clin Exp Res 2004; 16(6): 461-466.ArticlePubMedPDF
- 31. Yang X, So WY, Ma RC, Ko GT, Kong AP, Ho CS, Lam CW, Ozaki R, Cockram CS, Tong PC, Wong V, Chan JC. Thresholds of risk factors for ischemic stroke in type 2 diabetic patients with and without albuminuria: a non-linear approach. Clin Neurol Neurosurg 2008; 110(7): 701-709.ArticlePubMed
- 32. Yeh FC, Tang A, Hobbs JP, Hottowy P, Dabrowski W, Sher A, Litke A, Beggs JM. Maximum entropy approaches to living neural networks. Entropy (Basel) 2010; 12(1): 89-106.Article
- 33. Yoon SH. Relationships between blood pressure and serum lipids, obesity indices in adults using health examination data. J Korea Acad Ind Coop Soc 2013; 14(9): 4394-4401.Article
- 34. Zamboni M, Mazzali G, Fantin F, Rossi A, Di Francesco V. Sarcopenic obesity: a new category of obesity in the elderly. Nutr Metab Cardiovasc Dis 2008; 18(5): 388-395.ArticlePubMed
- 35. Zamboni M, Mazzali G, Zoico E, Harris TB, Meigs JB, Di Francesco V, Fantin F, Bissoli L, Bosello O. Health consequences of obesity in the elderly: a review of four unresolved questions. Int J Obes (Lond) 2005; 29(9): 1011-1029.ArticlePubMedPDF
- 36. Zhou R, Cai R, Tong G. Applications of entropy in finance: a review. Entropy (Basel) 2013; 15(11): 4909-4931.Article
REFERENCES
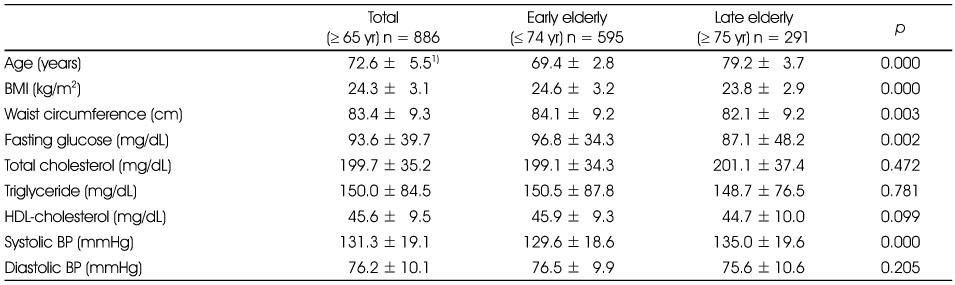
Table 2Partial correlation coefficient between body mass index and biochemical results and blood pressure in subjects1)

Table 3The sensitivity, specificities and Youden's index for the morbidity of hypertension, diabetes mellitus and dyslipidemia according to cut-off points of BMI
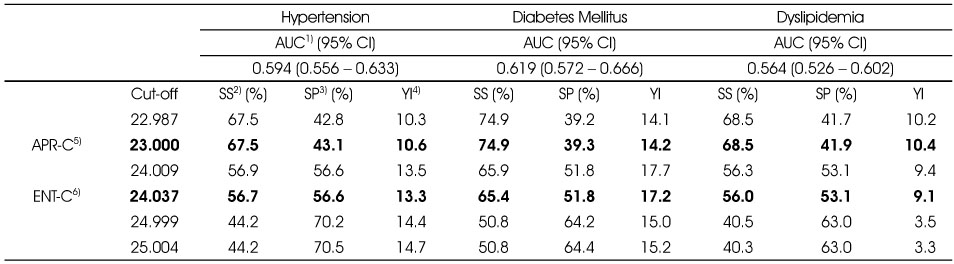
Table 4The sensitivity, specificities and Youden's index by the number of diseases among hypertension, diabetes mellitus and dyslipidemia according to cut-off points of BMI

Table 5The adjusted odds ratio and 95% confidence interval for overweight or obesity of Asia-Pacific region criteria and entropy model criteria by the stage of hypertension

Table 6The adjusted odds ratio and 95% confidence interval for overweight or obesity of Asia-Pacific Region Criteria and Entropy Model Criteria by the stage of diabetes mellitus


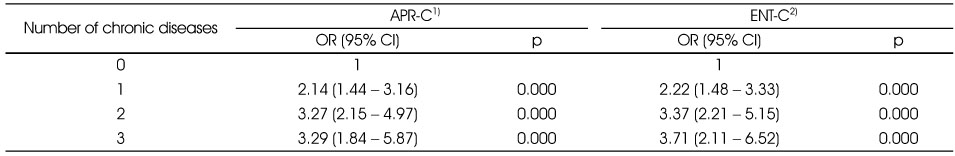
Figure & Data
REFERENCES
Citations
Citations to this article as recorded by 
- Factors related to cancer screening behaviors
Boyoung Choi, Tae Rim Um, Kwang-Soo Lee
Epidemiology and Health.2018; 40: e2018011. CrossRef - Nutrition States and Related Factors of Female Elderly according to Residence
Mi-Yeon Park
Journal of the East Asian Society of Dietary Life.2015; 25(1): 39. CrossRef
 Cite
CiteA Comparison between Asia-Pacific Region Criteria and Entropy Model Criteria about Body Mass Index of Elderly Females Using Morbidity of Chronic Disease
A Comparison between Asia-Pacific Region Criteria and Entropy Model Criteria about Body Mass Index of Elderly Females Using Morbidity of Chronic Disease
The distribution of general characteristics of subjects
1) Mean ± SD
Partial correlation coefficient between body mass index and biochemical results and blood pressure in subjects1)
1) Results after controlling for ages of the subjects
2) BMI: Body mass index
3) correlation coefficient (p value)
The sensitivity, specificities and Youden's index for the morbidity of hypertension, diabetes mellitus and dyslipidemia according to cut-off points of BMI
1) AUC: Area under the ROC curve
2) SS: Sensitivity
3) SP: Specificity
4) YI: Youden's index
5) Asia-Pacific Region Criteria
6) Entropy Model Criteria
The sensitivity, specificities and Youden's index by the number of diseases among hypertension, diabetes mellitus and dyslipidemia according to cut-off points of BMI
1) AUC: Area under the ROC curve
2) SS: Sensitivity
3) SP: Specificity
4) YI: Youden's index
5) Asia-Pacific Region Criteria
6) Entropy Model Criteria
The adjusted odds ratio and 95% confidence interval for overweight or obesity of Asia-Pacific region criteria and entropy model criteria by the stage of hypertension
1) Asia-Pacific Region Criteria
2) Entropy Model Criteria
The adjusted odds ratio and 95% confidence interval for overweight or obesity of Asia-Pacific Region Criteria and Entropy Model Criteria by the stage of diabetes mellitus
1) Asia-Pacific Region Criteria
2) Entropy Model Criteria
The adjusted odds ratio and 95% confidence interval for overweight or obesity of Asia-Pacific Region Criteria and Entropy Model Criteria by the stage of dyslipidemia
1) Asia-Pacific Region Criteria
2) Entropy Model Criteria
The adjusted odds ratio and 95% confidence interval for overweight or obesity of Asia-Pacific Region Criteria and Entropy Model Criteria by the number of chronic diseases
1) Asia-Pacific Region Criteria
2) Entropy Model Criteria
Table 1
The distribution of general characteristics of subjects
1) Mean ± SD
Table 2
Partial correlation coefficient between body mass index and biochemical results and blood pressure in subjects1)
1) Results after controlling for ages of the subjects 2) BMI: Body mass index 3) correlation coefficient (p value)
Table 3
The sensitivity, specificities and Youden's index for the morbidity of hypertension, diabetes mellitus and dyslipidemia according to cut-off points of BMI
1) AUC: Area under the ROC curve 2) SS: Sensitivity 3) SP: Specificity 4) YI: Youden's index 5) Asia-Pacific Region Criteria 6) Entropy Model Criteria
Table 4
The sensitivity, specificities and Youden's index by the number of diseases among hypertension, diabetes mellitus and dyslipidemia according to cut-off points of BMI
1) AUC: Area under the ROC curve 2) SS: Sensitivity 3) SP: Specificity 4) YI: Youden's index 5) Asia-Pacific Region Criteria 6) Entropy Model Criteria
Table 5
The adjusted odds ratio and 95% confidence interval for overweight or obesity of Asia-Pacific region criteria and entropy model criteria by the stage of hypertension
1) Asia-Pacific Region Criteria 2) Entropy Model Criteria
Table 6
The adjusted odds ratio and 95% confidence interval for overweight or obesity of Asia-Pacific Region Criteria and Entropy Model Criteria by the stage of diabetes mellitus
1) Asia-Pacific Region Criteria 2) Entropy Model Criteria
Table 7
The adjusted odds ratio and 95% confidence interval for overweight or obesity of Asia-Pacific Region Criteria and Entropy Model Criteria by the stage of dyslipidemia
1) Asia-Pacific Region Criteria 2) Entropy Model Criteria
Table 8
The adjusted odds ratio and 95% confidence interval for overweight or obesity of Asia-Pacific Region Criteria and Entropy Model Criteria by the number of chronic diseases
1) Asia-Pacific Region Criteria 2) Entropy Model Criteria


