
Articles
- Page Path
- HOME > Korean J Community Nutr > Volume 16(3); 2011 > Article
-
Original Article
- Analysis on Stress and Dietary Attitudes of Male Employees
- Mi-Ae Lee, Eun-Ju Lee, Hye-Kyung Soh, Bong-Soon Choi
-
Korean Journal of Community Nutrition 2011;16(3):337-352.
DOI: https://doi.org/10.5720/kjcn.2011.16.3.337
Published online: June 30, 2011
Department of Food Science and Nutrition, Catholic University of Daegu, Daegu, Korea.
- Corresponding author: Bong-Soon Choi, Department of Food Science and Nutrition, Catholic University of Daegu, 330 Geumnak 1-ri, hayang-eup, Gyeongsan-si 712-702, Gyeongbuk, Korea. Tel: (053) 850-3522, Fax: (053) 850-3516, bschoi@cu.ac.kr
• Received: December 9, 2010 • Revised: December 14, 2010 • Accepted: June 9, 2011
Copyright © 2011 The Korean Society of Community Nutrition
- 1,950 Views
- 4 Download
- 5 Crossref
Abstract
- This study was conducted to vitalize life through analysis on lifestyles, stress and dietary habits of male employees. For this study, questionnaire survey and physical measurements to examine BMI and waist circumference were performed with male employees in four companies located in Gyeongnam. Total 350 copies of the questionnaire were distributed and 327 ones were finally analyzed. The results of analysis on dietary life-related problems and stress were as follows. First, according to BMI, 56.9% were overweight and waist circumference recorded less than 90 cm in 90.5%. For lifestyles, 54.1%, 79.2%, 60.9% and 52.3% smoked, drank alcohol, didn't exercise and didn't sleep sufficiently. Second, for the correlation with job stress, the subjects graduating junior college or lower academic institution, production employees and sleeping insufficiently showed higher compared to the others. Analysis on the correlation with life stress found that conjugal relation stress was higher in alcohol-drinkers, the males not taking dietary supplements, those with a normal weight or more compared to underweight ones. Stress from relation with a child was higher aged 35~49 years than in those aged 20~34 years, and stress from economic life was higher aged less than 50 years, in those graduating junior colleges compared to those graduating colleges, in those sleeping insufficiently. Health life stress was found to be higher in those without religion compared to those with it such as Protestant Christianity and Catholicism, in alcohol drinkers and in those sleeping insufficiently and having a disease. Based on this, in order to improve the lifestyles and dietary habits and release stress effectively, practical nutrition education program should be carried out.
- 1. Adler N, Metthews K. Health psychology: why do somepeople get sick and some stay well? Annu Rev Psychol. 1994; 45: 229-259.ArticlePubMed
- 2. Ahn B, Kim SY. A study on the eating behaviors and the preferences of industrial workers in Korea. J East Asian Soc Diet Life. 1999; 9(3): 336-344.
- 3. Angus J, Rukholm E, Onge R, Michel I, Nolan RP, Lapum J, Evans S. Habitus stress and the body: the everyday production of health and cardiovascular risk. Qual Health Res. 2007; 17(8): 1088-1102.ArticlePubMedLink
- 4. Ashwell M, Cole TJ, Dixon AK. Obesity: new insight into the anthropometric classification of fat distribution shown by computed tomography. Br Med J. 1985; 290: 1692-1694.Article
- 5. Boyle MA, Morris DH. Community nutrition in action. 1999; 2nd ed. Belmont CA: West/Wadworth; 236-259.
- 6. Campbell A, Converse PE, Rodgers WL. The quality of American life. J Personal Soc Psychol. 1976; 47: 156-163.
- 7. Chang SJ, Koh SB, Kang MK, Cha BS, Park JK, Hyun SJ, Park JH, Kim SA, Kang DM, Chang SS, Lee KJ, Ha EH, Ha M, Woo JM, Cho JJ, Kim HS, Park JS. Epidemiology of psychosocial distress in Korean employees. J Prev Med Public Health. 2005; 38(1): 25-37.PubMed
- 8. Cho TR. Workers' job stress status and related factors-using Korean occupational stress questionnaire short form. Korean J Occup Health Nurs. 2006; 15(1): 58-71.
- 9. Cho KO, Lee HJ. The effects of regular exercise on obesity indices and dietary factors in adult males. Korean J Community Nutr. 2007; 12(2): 160-167.
- 10. Choi ES, Ha YM. Work-related stress and risk factors among Korean employees. J Korean Acad Nurs. 2009; 39(4): 549-561.ArticlePubMed
- 11. Choi JS, Jee SM, Baek HY, Hong SM. A study on the eating habits and dietary consciousness of adults in urban area. J Korean Soc Food Sci Nutr. 2003; 32(7): 1132-1146.Article
- 12. Choi MK, Kim JM, Kim JK. A study on the dietary habit and health of office workers in Seoul. Korean J Food Cult. 2003; 18(1): 45-55.
- 13. Dennis JP, Markey MA, Johnston KA, Vander Wal JS, Artinian NT. The role of stress and social support in predicting depression among a hypertensive African American sample. Heart Lung. 2008; 37(2): 105-112.ArticlePubMedPMC
- 14. Fuller j, Schaller-Ayers j. Health assessment: A nursing approach. 2000; Philadelphia: Lippincott.
- 15. Glanz K, Lewis FM, Rimer BK. Health behavior and health education-theory, research and practice. 1990; San Francisco: Jossey-Bass.
- 16. Han KL. A study on the relationship between the stress of middlelife men and climacteric symptom. 2002; Chung-Ang University; 2-5 MS thesis.
- 17. Han KL, Chung YK, Lee JO. A study on the relationship between the stress and climatric symtoms of middlelife men. J Korean Community Nurs. 2002; 13(3): 513-522.
- 18. Hong WS, Jang MR. Analysis of nutrition service needs and proposal of the role of dietitian for office worker. J Korean Diet Assoc. 1996; 2(1): 55-113.
- 19. Hughes BM. Individual difference in hostility and habituation of cardiovascular reactivity to stress. Stress Health. 2007; 23(1): 37-42.
- 20. Jang HS, Choi JH. The health status according to the age and BMI of male workers in Daegu·Gyeongbuk region. J Korean Soc Food Sci Nutr. 2007; 36(3): 318-326.Article
- 21. Jeffery RW, Ng DM. Relationships between perceived stress and health behaviors in a sample of working adults. Health Psychol. 2003; 22(6): 638-642.ArticlePubMed
- 22. Jun YS, Choi MK. Effect of academic examination stress on taste perception and nutrient intake in university students. J Korean Soc Food Sci Nutr. 2004; 33(2): 349-355.Article
- 23. Kim DH, Kim HD. Stress-related socio-demographic factors and life style on male white collar workers. J Korean Soc Health Educ Promot. 2002; 19(2): 45-55.
- 24. Kim HK, Kim JH. Relationship between stress and eating habits of adults in Ulsan. Korean J Nutr. 2009; 42(6): 536-546.Article
- 25. Kim JG, Kim JM, Choi MK. A study on the stress and dietary life of office workers in Seoul. Korean J Food Cookery Sci. 2003; 19(4): 413-422.
- 26. Kim M, Jung DY, Park HJ. A study on perceived and dietary habits of female college students. Korean J Women Health Nurs. 2008; 14(3): 181-188.ArticleLink
- 27. Kim SM, Lee DJ. What is the best simple anthropometric indicis of abd-ominal visceral fat in Korean obese patients? Korean J Obes. 1998; 7(2): 157-168.
- 28. Kim SS. A study on influential factors underlying middle-aged men's stress. 2001; Mokwon University; 5-20 MS thesis.
- 29. Kim YM. Work·family role burden and psychological well-being of Korean men in the middle-aged. 2003; Kunsan National University; MS thesis.
- 30. Korean Society of Occupational Stress. Korean occupational stress guestionnaine short form. 2005.
- 31. Kouvonen A, Kivimaki M, Cox SJ, Cox T. Relationship between work stress and body mass index among 45, 810 female and male employees. Psychosom Med. 2005; 67(4): 577-583.ArticlePubMed
- 32. Lee SY, Park HS, Kim DJ, Han JH, Kim SM, Cho GJ, Kim DY, Kwon HS, Kim SR, Lee CB, Oh SJ, Park CY, Yoo HJ. Appropriate waist circumference cutoff points for central obesity in Korean adults. Diabetes Res Clin Pract. 2007; 75(1): 72-80.ArticlePubMed
- 33. Lee YS. The relationship between stress and health habits in industrial workers. Korean J Prev Med. 1990; 23(1): 33-42.
- 34. Lee HJ, Jekarl J. Survey on alcohol use of workers for developing employee assistance program. 2002; Seoul: Korea Drinking Culture and Alcohol Research Foundation.
- 35. Mckeown T. The role of medicine. 1984; Oxford: Basil Blackwell.
- 36. Ministry of Health and Welfare. The Korea National Health and Nutrition Examination Survey. 2005.
- 37. Myung CO, Nam HW, Park YS. A study of stress, food habits and well-being related attitudes in urban middle-aged men. J East Asian Soc Diet Life. 2009; 19(2): 157-168.
- 38. Owens JF, Matthews KA. Sleep disturbance in healthy middle-aged women. Maturitas. 1998; 30(1): 41-50.ArticlePubMed
- 39. Park SB. Recognition status of health related to smoking, alcohol drinking, and stress in a working place. J Korean Acad Fam Med. 2001; 22(12): 1814-1822.
- 40. Park SM, Kim JY, Jang IS, Park EJ. Severity of insomnia, depression, and quality of life in elderly. J Korean Gerontol Soc. 2008; 28(4): 991-1007.
- 41. Polzer Casarez RL, Miles MS. Spirituality: a cultural strength for African American mothers with HIV. Clin Nurs Res. 2008; 17(2): 118-132.ArticlePubMedLink
- 42. Pouliot MC, Després JP. Waist circumference and abdominal sagittal diameter: best simple anthropometric indexes of abdominal visceral adipose tissue accumulation and related cardiovascular risk in men and women. Am J Cardiol. 1994; 73(7): 460-468.ArticlePubMed
- 43. Schuler RS. Definition and conceptualization of stress in organization. Organ Behav Hum Perform. 1980; 25(13): 184-215.
- 44. Shin YJ. Study on the dietary habit and behavior of office men in the city. 1997; Hyosung University; MS thesis.
- 45. The Korea National Statistical Office. Questionnaire for the economically active population survey. 2006.
- 46. The Korean Society of Community Nutrition. Questionnaire book related to nutrition. 2000; Seoul.
- 47. Theorell T, Perski A, Akerstedt T, Sigala F, Ahlgerg-Hulten G, Svensson J. Changes in job strain in relation to changes in physiological state. a longitudinal study. Scand J Work Environ Health. 1988; 14(3): 189-196.ArticlePubMed
- 48. Woo JM. Effects of cognitive-behavioral methods of stress management for workers. Cognitive Behav Ther Korea. 2005; 5(1): 43-52.
- 49. Yun SH, Bae JI, Lee SW, Ahn KA, Kim SE. The effects of job stress on depression, drinking and smoking among Korean men. Health Soc Sci. 2006; 19: 31-50.
REFERENCES
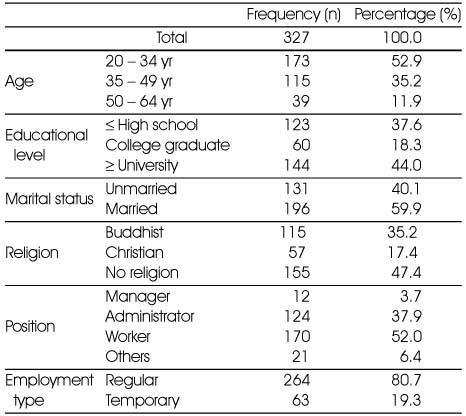
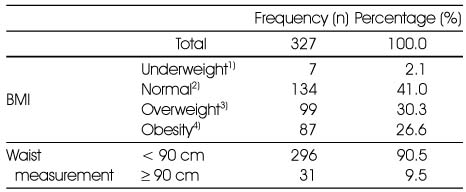

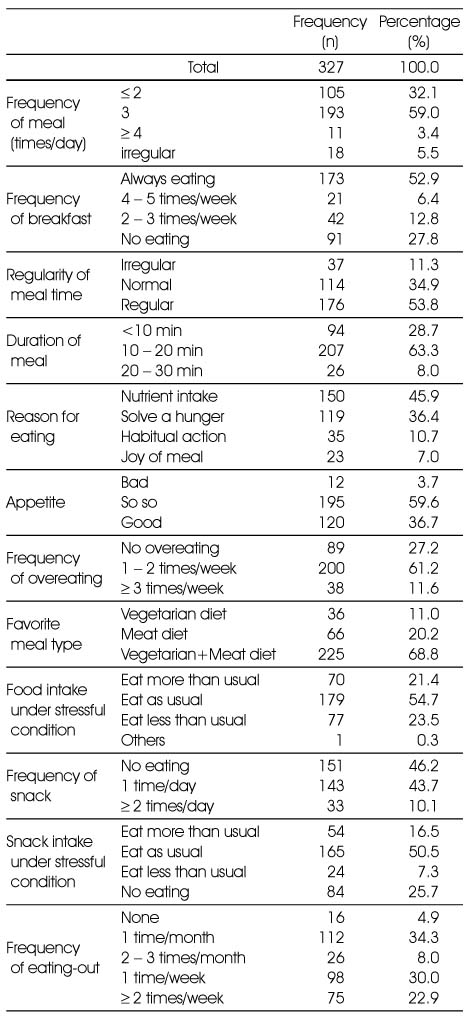
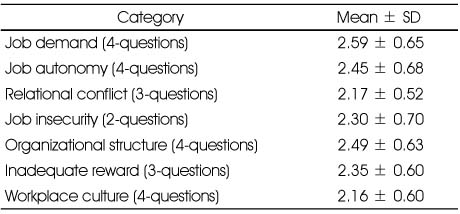

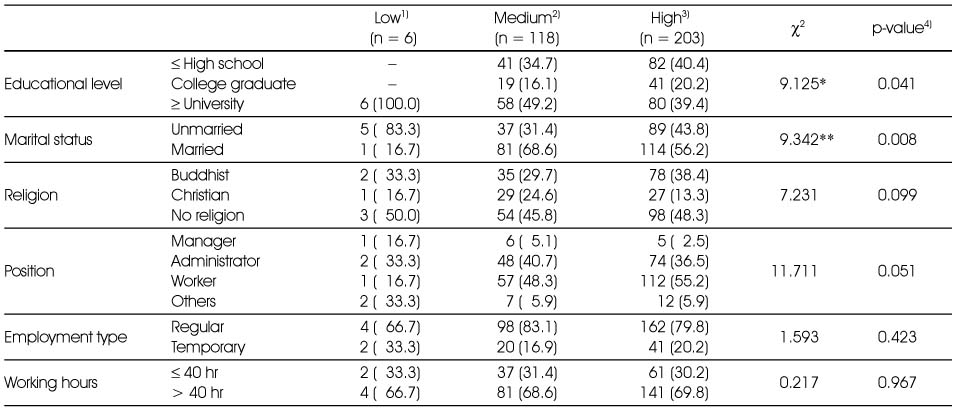
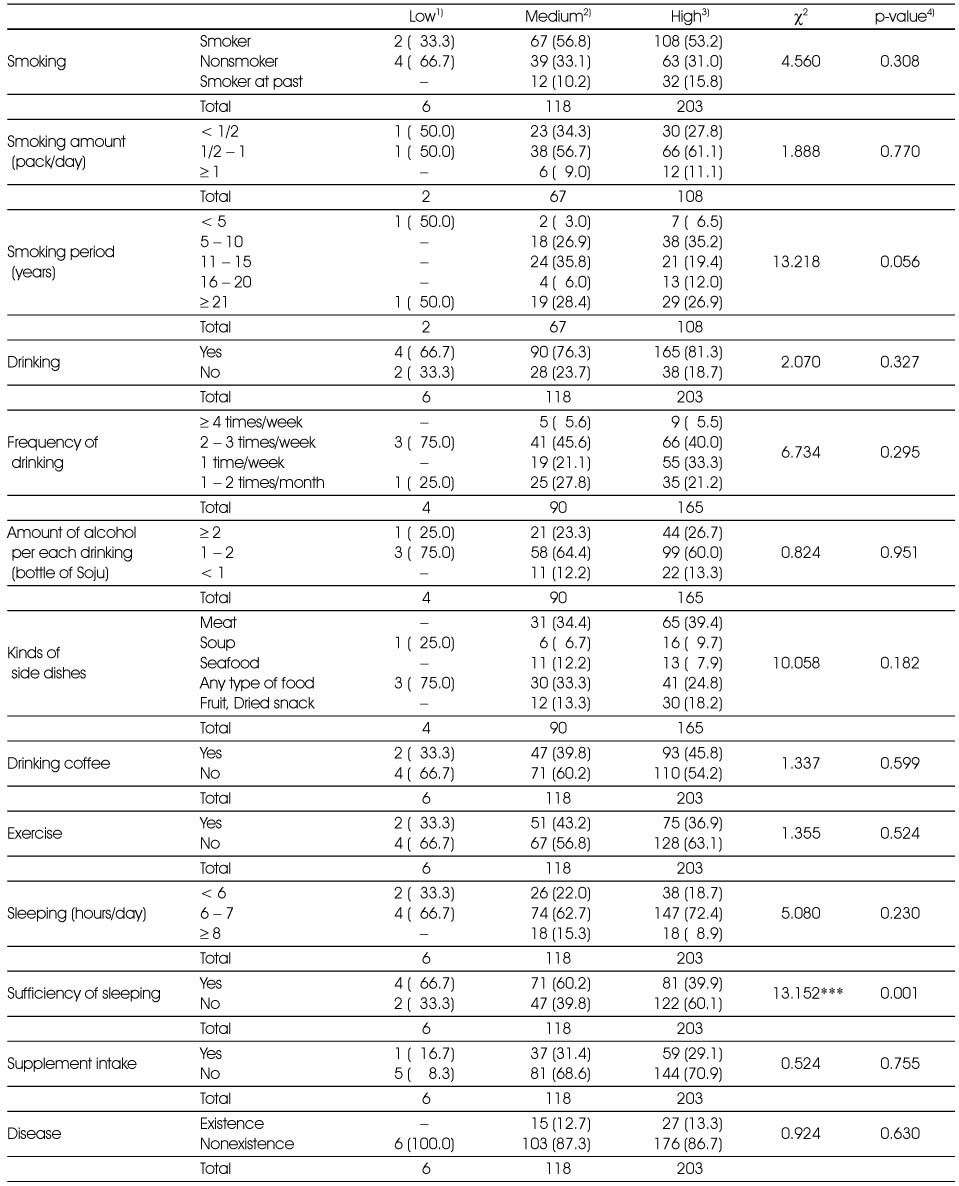


Table 11Food intake frequency score according to job stress levels

Values are Mean ± SD, *: p < 0.05
a, b: Means with different superscript letters are significantly different from each other at p < 0.05 by Duncan's multiple range test
1) Below 42.4 according to job stress score, 2) From 42.5 to 54.7 according to job stress score
3) Above 54.8 according to job stress score
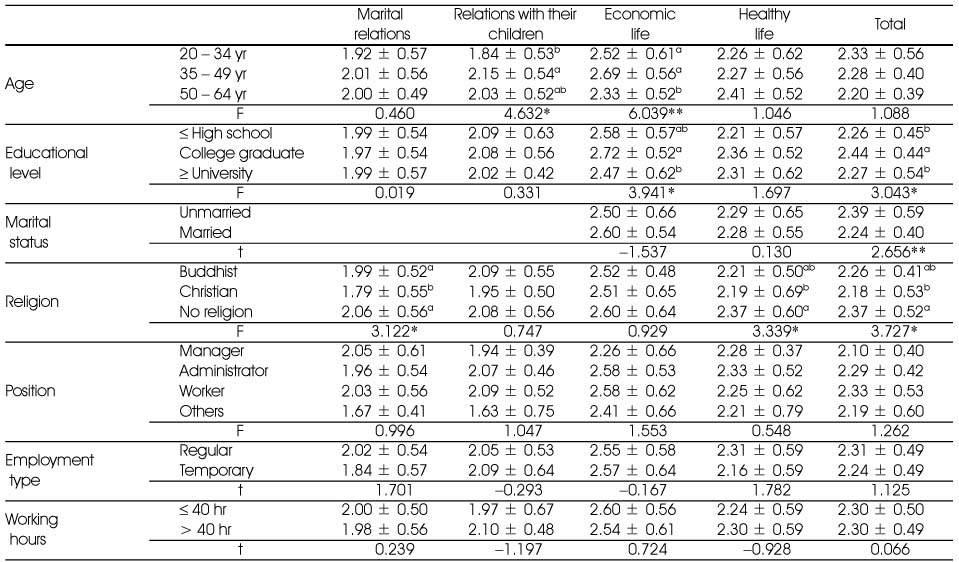
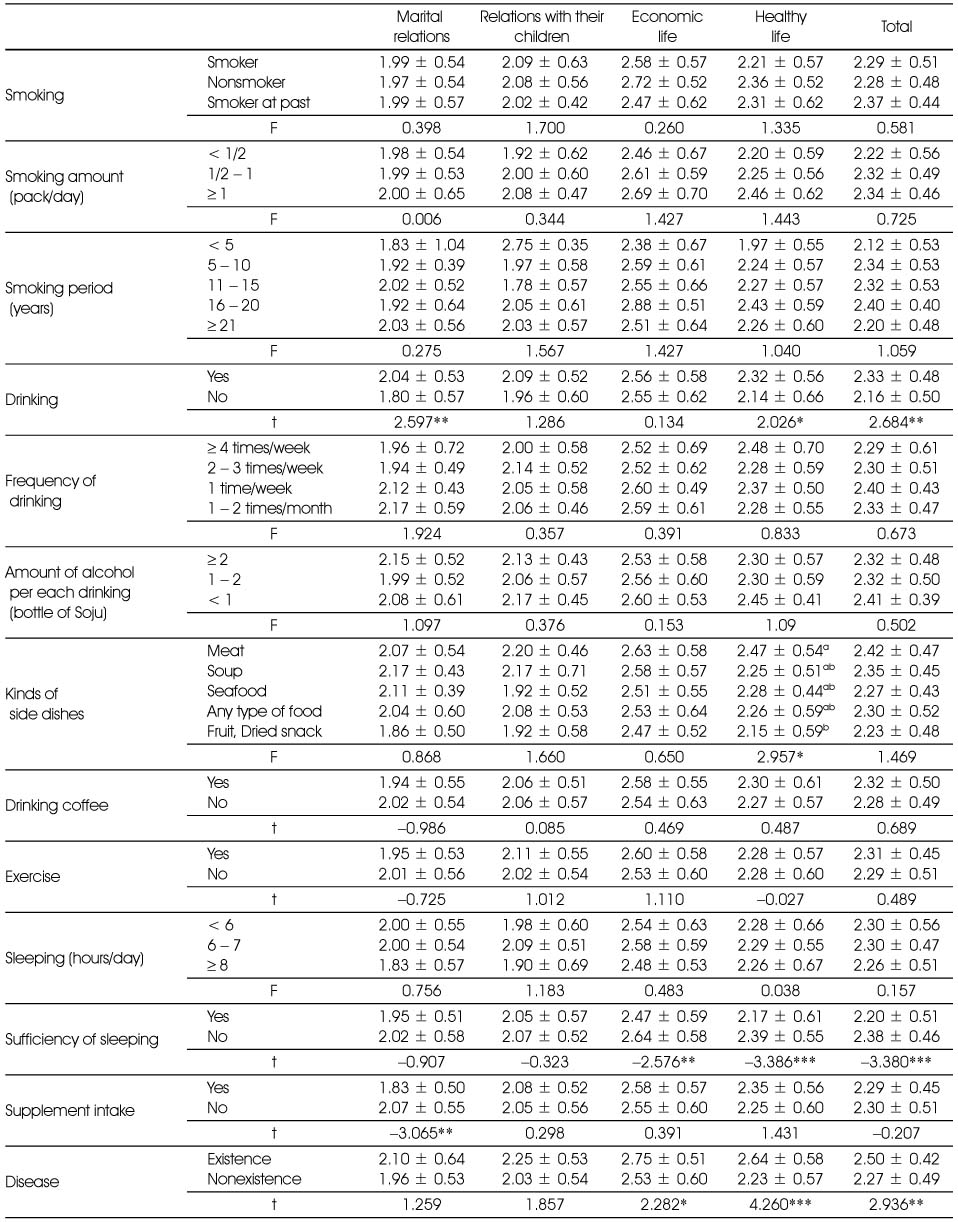


Figure & Data
REFERENCES
Citations
Citations to this article as recorded by 
- Effectiveness of a mobile health intervention on weight loss and dietary behavior changes among employees with overweight and obesity: a 12-week intervention study investigating the role of engagement
Imhuei Son, Jiyoun Hong, Young-Hee Han, Bo Jeong Gong, Meng Yuan Zhang, Woori Na, Cheongmin Sohn, Taisun Hyun
Korean Journal of Community Nutrition.2023; 28(2): 141. CrossRef - Association between stress and dietary habits, emotional eating behavior and insomnia of middle-aged men and women in Seoul and Gyeonggi
Onjeong Choi, Jiwon Kim, Yujin Lee, Youngmi Lee, Kyunghee Song
Nutrition Research and Practice.2021; 15(2): 225. CrossRef - A study on Korean workers’ practice of brushing teeth after lunch
Jin-Sun Choi
Journal of Korean Academy of Oral Health.2020; 44(2): 97. CrossRef - Eating Habits of the University Students affected by Stress Levels in the Areas of Seoul and Gangwon Province
Jeongsill Lee
The Korean Journal of Food And Nutrition.2015; 28(5): 782. CrossRef - A Study on Dietary Behaviors, Health-Related Lifestyle of Adult Visitors at Public Health Centers in Gyeonggi Urban Area
Jong-Sook Kwon, Kyungmin Kim, Hyun-Chang Seo, Yoonna Lee, Seunggeon Lim, Young-Sug Choi
Korean Journal of Community Nutrition.2013; 18(6): 611. CrossRef
 Cite
CiteAnalysis on Stress and Dietary Attitudes of Male Employees
Analysis on Stress and Dietary Attitudes of Male Employees
General characteristics of the subjects
Anthropometric data of the subjects
BMI : Body Mass Index = body weight (kg)/height (m)2
1) BMI < 18.5
2) 18.5 ≤ BMI < 23.0
3) 23.0 ≤ BMI < 25.0
4) BMI ≥ 25.0
Life habits of the subjects
Dietary habits of the subjects
The average score by job stress category
The higher the score, the higher the job stress (possible score 1 - 4)
The average score by daily life stress category
The higher the score, the higher the daily life stress (possible score 1 - 4)
Job stress levels according to general characteristics of the subjects
Values are N (%)
*: p < 0.05, **: p < 0.01
1) Below 42.4 according to job stress score
2) From 42.5 to 54.7 according to job stress score
3) Above 54.8 according to job stress score
4) Fisher's Exact test
Job stress levels according to life habits of the subjects
Values are N (%), ***: p < 0.001, †: Fisher's Exact test
1) Below 42.4 according to job stress score
2) From 42.5 to 54.7 according to job stress score
3) Above 54.8 according to job stress score
4) Fisher's Exact test
Job stress levels according to food habits of the subjects
Values are N (%)
**: p < 0.01
1) Below 42.4 according to job stress score
2) From 42.5 to 54.7 according to job stress score
3) Above 54.8 according to job stress score
4) Fisher's Exact test
Taste preference according to job stress levels
Values are Mean ± SD
The lower the score, the higher the preference (possible score 1 - 5)
1) Below 42.4 according to job stress score
2) From 42.5 to 54.7 according to job stress score
3) Above 54.8 according to job stress score
Food intake frequency score according to job stress levels
Values are Mean ± SD, *: p < 0.05
a, b: Means with different superscript letters are significantly different from each other at p < 0.05 by Duncan's multiple range test
1) Below 42.4 according to job stress score, 2) From 42.5 to 54.7 according to job stress score
3) Above 54.8 according to job stress score
Daily life stress score according to general characteristics of the subjects
Values are Mean ± SD: 4-point Likert scale (high score denote strong stress)
*: p < 0.05, **: p < 0.01
a, b: Means with different superscript letters are significantly different from each other at p < 0.05 by Duncan's multiple range test
Daily life stress score according to life habits of the subjects
Values are Mean ± SD: 4-point Likert scale (high score denote strong stress)
*: p < 0.05, **: p < 0.01, ***: p < 0.001
Daily life stress score according to dietary habits of the subjects
Values are Mean ± SD: 4-point Likert scale (high score denote strong stress)
*: p < 0.05, **: p < 0.01
a, b: Means with different superscript letters are significantly different from each other at p < 0.05 by Duncan's multiple range test
Correlation coefficient between food intake frequency and daily life stress
*: p < 0.05
Table 1
General characteristics of the subjects
Table 2
Anthropometric data of the subjects
BMI : Body Mass Index = body weight (kg)/height (m)2 1) BMI < 18.5 2) 18.5 ≤ BMI < 23.0 3) 23.0 ≤ BMI < 25.0 4) BMI ≥ 25.0
Table 3
Life habits of the subjects
Table 4
Dietary habits of the subjects
Table 5
The average score by job stress category
The higher the score, the higher the job stress (possible score 1 - 4)
Table 6
The average score by daily life stress category
The higher the score, the higher the daily life stress (possible score 1 - 4)
Table 7
Job stress levels according to general characteristics of the subjects
Values are N (%) *: p < 0.05, **: p < 0.01 1) Below 42.4 according to job stress score 2) From 42.5 to 54.7 according to job stress score 3) Above 54.8 according to job stress score 4) Fisher's Exact test
Table 8
Job stress levels according to life habits of the subjects
Values are N (%), ***: p < 0.001, †: Fisher's Exact test 1) Below 42.4 according to job stress score 2) From 42.5 to 54.7 according to job stress score 3) Above 54.8 according to job stress score 4) Fisher's Exact test
Table 9
Job stress levels according to food habits of the subjects
Values are N (%) **: p < 0.01 1) Below 42.4 according to job stress score 2) From 42.5 to 54.7 according to job stress score 3) Above 54.8 according to job stress score 4) Fisher's Exact test
Table 10
Taste preference according to job stress levels
Values are Mean ± SD The lower the score, the higher the preference (possible score 1 - 5) 1) Below 42.4 according to job stress score 2) From 42.5 to 54.7 according to job stress score 3) Above 54.8 according to job stress score
Table 11
Food intake frequency score according to job stress levels
Values are Mean ± SD, *: p < 0.05 a, b: Means with different superscript letters are significantly different from each other at p < 0.05 by Duncan's multiple range test 1) Below 42.4 according to job stress score, 2) From 42.5 to 54.7 according to job stress score 3) Above 54.8 according to job stress score
Table 12
Daily life stress score according to general characteristics of the subjects
Values are Mean ± SD: 4-point Likert scale (high score denote strong stress) *: p < 0.05, **: p < 0.01 a, b: Means with different superscript letters are significantly different from each other at p < 0.05 by Duncan's multiple range test
Table 13
Daily life stress score according to life habits of the subjects
Values are Mean ± SD: 4-point Likert scale (high score denote strong stress) *: p < 0.05, **: p < 0.01, ***: p < 0.001
Table 14
Daily life stress score according to dietary habits of the subjects
Values are Mean ± SD: 4-point Likert scale (high score denote strong stress) *: p < 0.05, **: p < 0.01 a, b: Means with different superscript letters are significantly different from each other at p < 0.05 by Duncan's multiple range test
Table 15
Correlation coefficient between food intake frequency and daily life stress
*: p < 0.05


