
Articles
- Page Path
- HOME > Korean J Community Nutr > Volume 28(3); 2023 > Article
-
Research Article
- Screen time, mealtime media use, and dietary behaviors in Korean preschoolers : a cross-sectional study
-
Young-Hee Han1)
 , Saerom Shin2), Eun Yeol Woo3), Hye-Kyung Park4), Taisun Hyun5),†
 -
Korean Journal of Community Nutrition 2023;28(3):206-219.
DOI: https://doi.org/10.5720/kjcn.2023.28.3.206
Published online: June 30, 2023
1)Invited professor, Department of Food and Nutrition, Chungbuk National University, Cheongju, Korea
2)Team member, National Institute of Food & Nutrition Service, Cheongju, Korea
3)Team leader, National Institute of Food & Nutrition Service, Cheongju, Korea
4)Former center director, National Institute of Food & Nutrition Service, Cheongju, Korea
5)Professor, Department of Food and Nutrition, Chungbuk National University, Cheongju, Korea
- †Corresponding author Taisun Hyun Department of Food and Nutrition, Chungbuk National University, Chungdaero-1, Heungduk-gu, Cheongju, Chungbuk 28644, Korea Tel: +82-43-261-2790 Fax: +82-43-267-2742 Email: taisun@cbnu.ac.kr
• Received: June 7, 2023 • Revised: June 20, 2023 • Accepted: June 21, 2023
© 2023 The Korean Society of Community Nutrition
This is an Open-Access article distributed under the terms of the Creative Commons Attribution Non-Commercial License (http://creativecommons.org/licenses/by-nc/4.0) which permits unrestricted non-commercial use, distribution, and reproduction in any medium, provided the original work is properly cited.
- 8,262 Views
- 166 Download
- 3 Crossref
Abstract
-
Objectives
- Screen time refers to the time spent using screen media, such as televisions, smartphones, computers, or tablets. Excessive exposure to screen media has been reported to negatively impact young children’s health and development, including overweight, short sleep duration, and language delays. This study examined the association of screen time and mealtime media use with dietary behaviors among preschool children.
-
Methods
- A cross-sectional survey was conducted on parents of children aged three to five years using the online questionnaires of the Nutrition Quotient for Preschoolers (NQ-P) and the Dietary Screening Test (DST). Data from 261 children’s parents were analyzed.
-
Results
- Of the 261 children, 96.9% used screen media, 55.6% used screen media for two hours or more daily, and 30.7% were exposed to screen media during meals. The NQ-P scores were significantly lower in the children with longer screen time and mealtime media use. Children who used screen media for two hours or more and those exposed to screen media during meals consumed kimchi less frequently and confectionery and sugar-sweetened beverages more frequently than children who used less than two hours and were not exposed to screen media during meals. In addition, they were more likely to be picky about food, refuse to eat, and less likely to feed themselves than children with shorter screen time and no mealtime media use.
-
Conclusions
- This study reported an association between unhealthy dietary behaviors, feeding difficulties, and screen time and mealtime media use among preschool children. Further research should explore effective strategies for reducing children’s screen time.
Introduction
Methods
1) Questionnaires
2) Scoring and processing of the responses
3) Group classification
Results
Discussion
Conclusion
-
Conflict of Interest
The authors declare no conflict of interest. The funders had no role in influencing the study results.
-
Funding
This study was supported by the National Institute of Food & Nutrition Service.
-
Data Availability
The participants in this study did not provide written consent for data disclosure, and therefore data cannot be used due to the sensitive nature of the research supporting data.
NOTES
Fig. 1.Percentage of children by (a) average screen time and (b) mealtime media use. 1) Time spent using TV, smartphones, computers, and tablets; 2) Use of TV or smartphone during meals
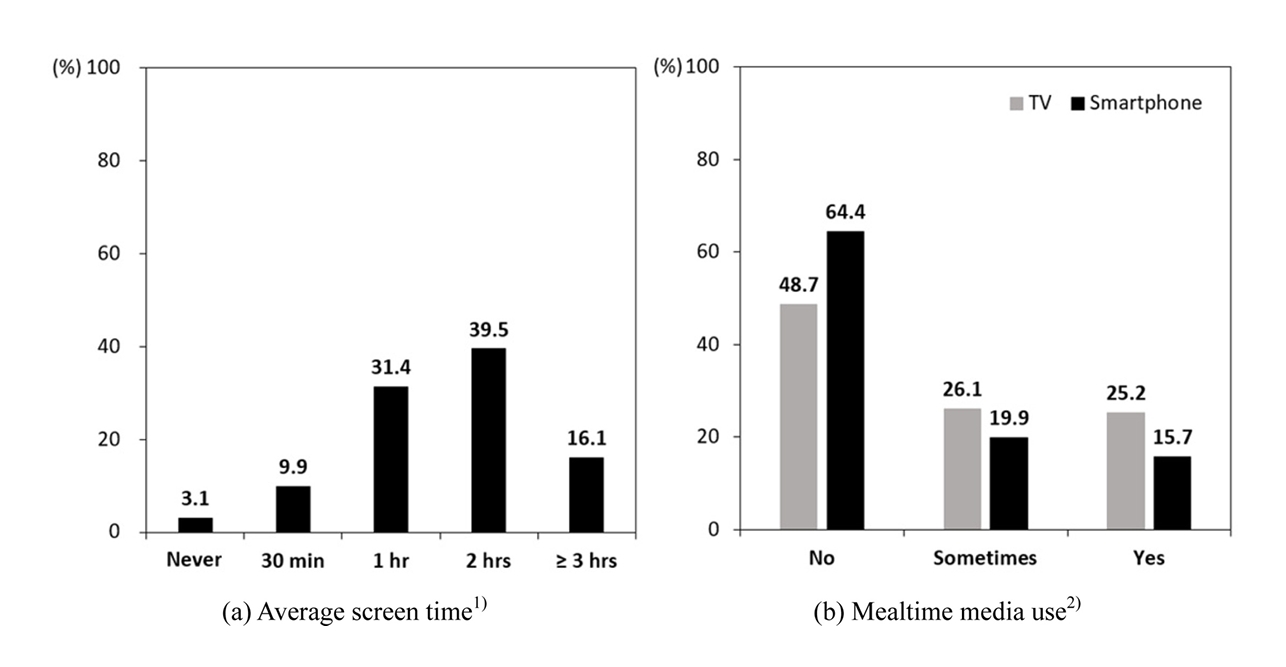
Table 1.General characteristics of preschoolers by screen media exposure
| Total (n = 261) |
Screen time |
Mealtime media use |
||||||
|---|---|---|---|---|---|---|---|---|
| < 2 hours (n = 116) | ≥ 2 hours (n = 145) | P-value1) | No (n = 110) | Sometimes (n = 71) | Yes (n = 80) | P-value2) | ||
| Sex | ||||||||
| Boy | 126 (48.3) | 52 (44.8) | 74 (51.0) | 0.319 | 51 (46.4) | 36 (50.7) | 39 (48.8) | 0.845 |
| Girl | 135 (51.7) | 64 (55.2) | 71 (49.0) | 59 (53.6) | 35 (49.3) | 41 (51.3) | ||
| Age (years) | ||||||||
| 3 | 62 (23.8) | 28 (24.1) | 34 (23.5) | 0.738 | 21 (19.1) | 20 (28.2) | 21 (26.2) | 0.528 |
| 4 | 107 (41.0) | 50 (43.1) | 57 (39.3) | 51 (46.4) | 26 (36.6) | 30 (37.5) | ||
| 5 | 92 (35.2) | 38 (32.8) | 54 (37.2) | 38 (34.5) | 25 (35.2) | 29 (36.3) | ||
| Residence area | ||||||||
| Big city | 171 (65.5) | 72 (62.1) | 99 (68.3) | 0.295 | 72 (65.5) | 49 (69.0) | 50 (62.5) | 0.702 |
| Small city, rural area | 90 (34.5) | 44 (37.9) | 46 (31.7) | 38 (34.5) | 22 (31.0) | 30 (37.5) | ||
| Daytime caregiver | ||||||||
| Parents, grandparents | 81 (31.0) | 28 (24.1) | 53 (36.6) | 0.031 | 38 (34.5) | 15 (21.1) | 28 (35.0) | 0.107 |
| Child care teacher | 180 (69.0) | 88 (75.9) | 92 (63.4) | 72 (65.5) | 56 (78.9) | 52 (65.0) | ||
| Meal duration (minutes) | 32.0 ± 13.1 | 31.0 ± 12.1 | 32.8 ± 13.8 | 0.273 | 30.6 ± 12.9b | 30.3 ± 11.5b | 35.5 ± 14.2a | 0.017 |
| Sleep duration (hours) | 9.5 ± 0.9 | 9.7 ± 0.9 | 9.4 ± 0.9 | 0.009 | 9.7 ± 0.8a | 9.5 ± 0.9ab | 9.3 ± 0.9b | 0.037 |
| BMI (kg/m2) | 16.1 ± 1.9 | 15.9 ± 2.0 | 16.2 ± 1.9 | 0.273 | 15.9 ± 1.8 | 16.4 ± 2.0 | 16.2 ± 2.1 | 0.192 |
| BMI category3) | ||||||||
| Underweight | 15 (5.7) | 5 (4.3) | 10 (6.9) | 0.272 | 7 (6.4) | 3 (4.2) | 5 (6.2) | 0.160 |
| Normal weight | 186 (71.3) | 86 (74.1) | 100 (69.0) | 82 (74.5) | 45 (63.4) | 59 (73.8) | ||
| Overweight | 15 (5.7) | 9 (7.8) | 6 (4.1) | 8 (7.3) | 6 (8.5) | 1 (1.2) | ||
| Obesity | 45 (17.3) | 16 (13.8) | 29 (20.0) | 13 (11.8) | 17 (23.9) | 15 (18.8) | ||
n (%) or mean ± SD
1)P-value was determined by X2-test or t-test.
2)P-value was determined by X2-test or ANOVA.
3)Underweight (weight for age < 5th percentiles), normal weight (5th ≤ BMI for age < 85th percentiles), overweight (85th ≤ BMI for age < 95th percentiles), and obesity (BMI for age ≥ 95th percentiles) based on the 2017 Korean National Growth Chart
Values with different superscripts within each row are significantly different at P < 0.05 by Tukey’s multiple comparison test.
BMI: Body Mass Index
Table 2.NQ-P score and assessment result by screen media exposure
| Total (n = 261) |
Screen time |
Mealtime media use |
||||||||
|---|---|---|---|---|---|---|---|---|---|---|
| < 2 hours (n = 116) | ≥ 2 hours (n = 145) | P-value1) | Adjusted P-value2) | No (n = 110) | Sometimes (n = 71) | Yes (n = 80 | P-value3) | Adjusted P-value2) | ||
| NQ-P score4) | ||||||||||
| Balance | 62.7 ± 11.8 (55.3 – 70.9) | 63.3 ± 10.4 (54.8 – 71.0) | 62.1 ± 12.8 (55.6 – 70.8) | 0.409 | 0.337 | 63.8 ± 11.9 (56.9 – 71.6) | 62.4 ± 12.8 (54.5 – 71.0) | 61.4 ± 10.7 (54.1 – 69.3) | 0.382 | 0.328 |
| Moderation | 50.7 ± 16.0 (38.9 – 61.1) | 55.2 ± 15.5 (44.0 – 65.6) | 47.2 ± 15.5 (34.0 – 56.6) | < 0.001 | < 0.001 | 55.6 ± 15.4a (44.5 – 66.3) | 47.8 ± 15.6b (37.1 – 60.7) | 46.6 ± 15.5b (33.4 – 55.4) | < 0.001 | < 0.001 |
| Environment | 62.0 ± 18.8 (48.3 – 76.7) | 68.5 ± 18.3 (54.1 – 83.4) | 56.9 ± 17.6 (43.3 – 68.9) | < 0.001 | < 0.001 | 68.9 ± 17.8a (56.8 – 82.8) | 58.4 ± 17.9b (45.3 – 71.9) | 55.9 ± 18.0b (41.4 – 68.7) | < 0.001 | < 0.001 |
| Overall | 58.9 ± 9.5 (52.5 – 64.8) | 62.2 ± 8.9 (54.8 – 68.6) | 56.3 ± 9.2 (51.0 – 62.3) | < 0.001 | < 0.001 | 62.6 ± 9.5a (57.5 – 69.1) | 57.0 ± 9.5b (52.1 – 62.7) | 55.6 ± 7.6b (50.4 – 60.7) | < 0.001 | < 0.001 |
| Assessment result5) | ||||||||||
| Good (≥ 65) | 65 (24.9) | 45 (38.8) | 20 (13.8) | < 0.001 | 44 (40.0) | 15 (21.1) | 6 (7.5) | < 0.001 | ||
| Monitoring required (< 65) | 196 (75.1) | 71 (61.2) | 125 (86.2) | 66 (60.0) | 56 (78.9) | 74 (92.5) | ||||
Mean ± SD (25th –75th percentile) or n (%)
1)P-value was determined by t-test or X2-test.
2)P-value was determined by ANCOVA after adjusting for sex, age, and BMI.
3)P-value was determined by ANOVA or X2-test.
4)Maximum score is 100.
5)"Good" represents an NQ-P score of 65 or above, while "monitoring required" represents a score below 65.
Values with different superscripts within each row are significantly different at P < 0.05 by Tukey’s multiple comparison test.
BMI: Body Mass Index
Table 3.Weekly consumption frequency of food group by screen media exposure
| Total (n = 261) |
Screen time |
Mealtime media use |
||||||||
|---|---|---|---|---|---|---|---|---|---|---|
| < 2 hours (n = 116) | ≥ 2 hours (n = 145) | P-value1) | Adjusted P-value2) | No (n = 110) | Sometimes (n = 71) | Yes (n = 80) | P-value3) | Adjusted P-value2) | ||
| Balance | ||||||||||
| White milk | 8.1 ± 6.3 | 7.9 ± 5.7 | 8.2 ± 6.8 | 0.709 | 0.646 | 7.8 ± 5.9 | 8.6 ± 7.3 | 8.0 ± 5.8 | 0.693 | 0.660 |
| Meat | 3.6 ± 1.9 | 3.6 ± 1.6 | 3.6 ± 2.1 | 0.884 | 0.965 | 3.6 ± 1.8 | 3.4 ± 1.8 | 3.8 ± 2.1 | 0.452 | 0.445 |
| Fish | 1.7 ± 1.4 | 1.6 ± 1.4 | 1.7 ± 1.5 | 0.311 | 0.391 | 1.7 ± 1.4 | 1.7 ± 1.4 | 1.5 ± 1.4 | 0.452 | 0.430 |
| Beans and bean products | 2.1 ± 1.8 | 2.1 ± 1.7 | 2.1 ± 2.0 | 0.757 | 0.987 | 2.2 ± 1.8 | 2.1 ± 2.0 | 1.9 ± 1.8 | 0.552 | 0.465 |
| Fruits4) | 5.1 ± 3.5 | 5.4 ± 3.6 | 4.8 ± 3.4 | 0.228 | 0.296 | 5.4 ± 3.3 | 4.5 ± 3.3 | 5.2 ± 3.8 | 0.234 | 0.269 |
| Vegetables (except kimchi) 4) | 11.8 ± 7.3 | 13.1 ± 6.8 | 10.7 ± 7.6 | 0.009 | 0.008 | 12.8 ± 7.1 | 11.5 ± 7.8 | 10.6 ± 7.0 | 0.117 | 0.134 |
| Kimchi4) | 10.6 ± 7.8 | 12.9 ± 7.4 | 8.8 ± 7.7 | < 0.001 | < 0.001 | 12.6 ± 7.1a | 11.0 ± 8.0a | 7.5 ± 7.8b | < 0.001 | < 0.001 |
| Moderation | ||||||||||
| Confectionery | 4.5 ± 3.5 | 3.5 ± 2.9 | 5.3 ± 3.7 | < 0.001 | < 0.001 | 3.7 ± 3.3b | 4.5 ± 3.6ab | 5.5 ± 3.4a | 0.002 | 0.003 |
| Sugar-sweetened beverages | 1.5 ± 1.7 | 1.1 ± 1.2 | 1.9 ± 1.9 | < 0.001 | < 0.001 | 1.0 ± 1.2b | 1.9 ± 1.8a | 2.0 ± 1.9a | < 0.001 | < 0.001 |
| Processed meat | 1.5 ± 1.4 | 1.3 ± 1.3 | 1.7 ± 1.5 | 0.051 | 0.104 | 1.2 ± 1.2b | 1.8 ± 1.5a | 1.7 ± 1.6a | 0.004 | 0.007 |
| Fast food | 0.4 ± 0.5 | 0.4 ± 0.5 | 0.4 ± 0.4 | 0.424 | 0.666 | 0.4 ± 0.4 | 0.4 ± 0.6 | 0.4 ± 0.3 | 0.666 | 0.728 |
Mean ± SD
1)P-value was determined by t-test.
2)P-value was determined by ANCOVA after adjusting for sex, age, and BMI.
3)P-value was determined by ANOVA.
4)Questions from DST
Values with different superscripts within each row are significantly different at P < 0.05 by Tukey’s multiple comparison test.
BMI: Body Mass Index, DST: Diet Screening Test
Table 4.Environmental factors of NQ-P by screen media exposure
| Total (n = 261) |
Screen time |
Mealtime media use |
||||||||
|---|---|---|---|---|---|---|---|---|---|---|
| < 2 hours (n = 116) | ≥ 2 hours (n = 145) | P-value1) | Adjusted P-value2) | No (n = 110) | Sometimes (n = 71) | Yes (n = 80) | P-value3) | Adjusted P-value2) | ||
| Average screen time (hours/d) | 1.6 ± 0.8 | 0.8 ± 0.3 | 2.3 ± 0.5 | < 0.001 | < 0.001 | 1.3 ± 0.7c | 1.7 ± 0.8b | 2.1 ± 0.7a | < 0.001 | < 0.001 |
| Breakfast frequency (weekly frequency) | 4.4 ± 2.5 | 4.8 ± 2.4 | 4.1 ± 2.6 | 0.029 | 0.024 | 5.0 ± 2.5a | 4.0 ± 2.5b | 4.1 ± 2.6b | 0.008 | 0.007 |
| Eating without moving around4) | 3.4 ± 1.1 | 3.6 ± 1.0 | 3.3 ± 1.1 | 0.012 | 0.004 | 3.7 ± 1.0a | 3.3 ± 1.0b | 3.2 ± 1.1b | 0.002 | < 0.001 |
| Washing hands before eating4) | 3.8 ± 0.8 | 4.0 ± 0.8 | 3.6 ± 0.8 | < 0.001 | < 0.001 | 3.9 ± 0.8a | 3.9 ± 0.8a | 3.5 ± 0.9b | 0.003 | 0.004 |
| Parents’ efforts for healthy eating4) | 3.9 ± 0.7 | 4.1 ± 0.7 | 3.7 ± 0.7 | < 0.001 | < 0.001 | 4.0 ± 0.7a | 3.8 ± 0.7ab | 3.7 ± 0.7b | 0.006 | 0.006 |
Mean ± SD
1)P-value was determined by t-test.
2)P-value was determined by ANCOVA after adjusting for sex, age, and BMI.
3)P-value was determined by ANOVA.
4)The responses are based on a 5-point Likert scale, 1 = very unlikely, 2 = unlikely, 3 = neutral, 4 = likely, 5 = very likely.
Values with different superscripts within each row are significantly different at P < 0.05 by Tukey’s multiple comparison test.
BMI: Body Mass Index
Table 5.Feeding difficulties1) by screen media exposure
| Total (n = 261) |
Screen time |
Mealtime media use |
||||||||
|---|---|---|---|---|---|---|---|---|---|---|
| < 2 hours (n = 116) | ≥ 2 hours (n = 145) | P-value2) | Adjusted P-value3) | No (n = 110) | Sometimes (n = 71) | Yes (n = 80) | P-value4) | Adjusted P-value3) | ||
| Chewing difficulty-hard food | 1.9 ± 0.9 | 1.9 ± 0.8 | 2.0 ± 0.9 | 0.510 | 0.449 | 1.9 ± 0.8 | 1.9 ± 0.8 | 2.0 ± 0.9 | 0.659 | 0.663 |
| Chewing difficulty-chewy food | 2.3 ± 1.0 | 2.2 ± 0.9 | 2.4 ± 1.0 | 0.069 | 0.057 | 2.3 ± 1.0 | 2.3 ± 0.9 | 2.4 ± 1.1 | 0.726 | 0.745 |
| Swallowing difficulty-holding or spitting out food | 2.3 ± 0.9 | 2.1 ± 1.0 | 2.4 ± 0.9 | 0.035 | 0.012 | 2.2 ± 0.9 | 2.2 ± 1.0 | 2.5 ± 1.0 | 0.135 | 0.119 |
| Swallowing difficulty-retching | 2.0 ± 0.8 | 1.8 ± 0.8 | 2.1 ± 0.9 | 0.004 | 0.002 | 2.0 ± 0.9 | 1.9 ± 0.9 | 2.0 ± 0.8 | 0.815 | 0.827 |
| Picky eating | 2.8 ± 1.1 | 2.5 ± 1.0 | 3.0 ± 1.2 | < 0.001 | < 0.001 | 2.6 ± 1.0b | 2.6 ± 1.2b | 3.2 ± 1.2a | < 0.001 | < 0.001 |
| Refusal to eat | 1.7 ± 0.9 | 1.6 ± 0.8 | 1.8 ± 0.9 | 0.053 | 0.033 | 1.6 ± 0.8b | 1.6 ± 0.8b | 2.0 ± 1.0a | 0.009 | 0.008 |
| Not feeding themselves | 2.4 ± 1.1 | 2.2 ± 1.1 | 2.6 ± 1.2 | 0.014 | 0.004 | 2.1 ± 1.0c | 2.5 ± 1.0b | 2.9 ± 1.2a | < 0.001 | < 0.001 |
Mean ± SD
1)The responses are based on a 5-point Likert scale, 1 = very unlikely, 2 = unlikely, 3 = neutral, 4 = likely, 5 = very likely.
2)P-value was determined by t-test.
3)P-value was determined by ANCOVA after adjusting for sex, age, and BMI.
4)P-value was determined by ANOVA.
Values with different superscripts within each row are significantly different at P < 0.05 by Tukey’s multiple comparison test.
BMI: Body Mass Index
- 1. Kaur N, Gupta M, Malhi P, Grover S. Screen time in under-five children. Indian Pediatr 2019; 56(9): 773-788.ArticlePubMedPDF
- 2. Radesky JS, Christakis DA. Increased screen time: Implications for early childhood development and behavior. Pediatr Clin North Am 2016; 63(5): 827-839.PubMed
- 3. Kilic AO, Sari E, Yucel H, Oğuz MM, Polat E, Acoglu EA, et al. Exposure to and use of mobile devices in children aged 1-60 months. Eur J Pediatr 2019; 178: 221-227.ArticlePubMedPDF
- 4. Korea Press Foundation. Children and Media in Korea 2020 [Internet]. Korea Press Foundation; 2020 [cited 2023 Mar 31]. Available from: https://www.kpf.or.kr/front/research/consumerDetail.do?miv_pageNo=&miv_pageSize=&total_cnt=&LISTOP=&mode=W&seq=591511&link_g_topmenu_id=&link_g_submenu_id=&link_g_homepage=F®_stadt=®_enddt=&searchkey=all1&searchtxt=
- 5. Robidoux H, Ellington E, Lauerer J. Screen time: The impact of digital technology on children and strategies in care. J Psychosoc Nurs Ment Health Serv 2019; 57(11): 15-20.Article
- 6. World Health Organization. Guidelines on physical activity, sedentary behaviour and sleep for children under 5 years of age [Internet]. World Health Organization; 2019 [cited 2023 Mar 31]. Available from: https://apps.who.int/iris/handle/10665/311664
- 7. Guram S, Heinz P. Media use in children: American Academy of Pediatrics recommendations 2016. Arch Dis Child Educ Pract Ed 2018; 103(2): 99-101.ArticlePubMed
- 8. Tremblay MS, Leblanc AG, Carson V, Choquette L, Connor GS, Dillman C, et al. Canadian sedentary behaviour guidelines for the early years (aged 0-4 years). Appl Physiol Nutr Metab 2012; 37(2): 370-380.ArticlePubMed
- 9. Okely AD, Ghersi D, Hesketh KD, Santos R, Loughran SP, Cliff DP, et al. A collaborative approach to adopting/adapting guidelines - The Australian 24-Hour Movement Guidelines for the early years (Birth to 5 years): An integration of physical activity, sedentary behavior, and sleep. BMC Public Health 2017; 17(S5): 869.ArticlePubMedPMCPDF
- 10. Bozzola E, Spina G, Ruggiero M, Memo L, Agostiniani R, Bozzola M, et al. Media devices in pre-school children: The recommendations of the Italian pediatric society. Ital J Pediatr 2018; 44(1): 69.ArticlePubMedPMCPDF
- 11. Colley RC, Garriguet D, Adamo KB, Carson V, Janssen I, Timmons BW, et al. Physical activity and sedentary behavior during the early years in Canada: A cross-sectional study. Int J Behav Nutr Phys Act 2013; 10: 54.ArticlePubMedPMC
- 12. Zhao J, Zhang Y, Jiang F, Ip P, Ho FKW, Zhang Y, et al. Excessive screen time and psychosocial well-being: The mediating role of body mass index, sleep duration, and parent-child interaction. J Pediatr 2018; 202: 157-162.ArticlePubMed
- 13. McArthur BA, Volkova V, Tomopoulos S, Madigan S. Global prevalence of meeting screen time guidelines among children 5 years and younger: A systematic review and meta-analysis. JAMA Pediatr 2022; 176(4): 373-383.ArticlePubMedPMC
- 14. Korea Information Society Development Institute. 2022 Korea Media Panel Survey [Internet]. Korea Information Society Development Institute; 2022 [cited 2023 May 31]. Available from: https://www.kisdi.re.kr/report/view.do?key=m2101113024973&arrMasterId=3934581&masterId=3934581&artId=1131416
- 15. Canadian Paediatric Society, Digital Health Task Force. Screen time and young children: Promoting health and development in a digital world. Paediatr Child Health 2017; 22(8): 461-477.ArticlePubMedPMC
- 16. Li C, Cheng G, Sha T, Cheng W, Yan Y. The relationships between screen use and health indicators among infants, toddlers, and preschoolers: A meta-analysis and systematic review. Int J Environ Res Public Health 2020; 17(19): 7324.ArticlePubMedPMC
- 17. Ramírez-Coronel AA, Abdu WJ, Alshahrani SH, Treve M, Jalil AT, Alkhayyat AS, et al. Childhood obesity risk increases with increased screen time: A systematic review and dose-response meta-analysis. J Health Popul Nutr 2023; 42(1): 5.PubMedPMC
- 18. Kim SY, Han S, Park EJ, Yoo HJ, Park D, Suh S, et al. The relationship between smartphone overuse and sleep in younger children: A prospective cohort study. J Clin Sleep Med 2020; 16(7): 1133-1139.ArticlePubMedPMC
- 19. Byeon H, Hong S. Relationship between television viewing and language delay in toddlers: Evidence from a Korea national cross-sectional survey. PLoS One 2015; 10(3): e0120663.ArticlePubMedPMC
- 20. Pearson N, Biddle SJ. Sedentary behavior and dietary intake in children, adolescents, and adults: A systematic review. Am J Prev Med 2011; 41(2): 178-188.PubMed
- 21. Sisson SB, Shay CM, Broyles ST, Leyva M. Television-viewing time and dietary quality among U.S. children and adults. Am J Prev Med 2012; 43(2): 196-200.ArticlePubMed
- 22. Li P, Ren Z, Zhang J, Lan H, Szeto IM, Wang P, et al. Consumption of added sugar among Chinese toddlers and its association with picky eating and daily screen time. Nutrients 2022; 14(9): 1840.ArticlePubMedPMC
- 23. Jusienė R, Urbonas V, Laurinaitytė I, Rakickienė L, Breidokienė R, Kuzminskaitė M, Szeto IM, et al. Screen use during meals among young children: Exploration of associated variables. Medicina (Kaunas) 2019; 55(10): 688.ArticlePubMedPMC
- 24. Avery A, Anderson C, McCullough F. Associations between children's diet quality and watching television during meal or snack consumption: A systematic review. Matern Child Nutr 2017; 13(4): e12428.ArticlePubMedPMCLink
- 25. Thompson AL, Adair LS, Bentley ME. Maternal characteristics and perception of temperament associated with infant TV exposure. Pediatrics 2013; 131(2): e390-e397.ArticlePubMedPMCPDF
- 26. Kim H, Pae M. Lifestyle, dietary behavior and snack preference of upper-grade elementary school students in Cheongju according to the usage time of smartphones. Korean J Community Nutr 2017; 22(1): 40-52.ArticleLink
- 27. Han SH, Park SH, Lee EY, Chang KJ. Dietary attitudes, dietary behaviors, and smartphone usage-related dietary habits according to risk level of smartphone overdependence of elementary school students in the Siheung and Ansan areas. J Korean Soc Food Cult 2017; 32(5): 437-445.
- 28. Lim HS, Kim SK. Analysis of health habit and hair mineral nutrition status of media addicted adolescent. J Nutr Health 2018; 51(4): 295-306.ArticleLink
- 29. Cho SJ, Kim JN, Park SJ, Shin WS. Smartphone usage influences the eating habits of middle school students. J Korean Diet Assoc 2018; 24(3): 199-211.
- 30. Park KA. Dietary and lifestyle habits and dietary behaviors according to level of smartphone addiction in university students in Kyungnam province. J Korean Diet Assoc 2017; 23(4): 408-430.
- 31. Lee JS, Kang MH, Kwak TK, Chung HR, Kwon S, Kim HY, et al. Development of nutrition quotient for Korean preschoolers (NQ-P): Item selection and validation of factor structure. J Nutr Health 2016; 49(5): 378-394.ArticleLink
- 32. Nutrii Co. Ltd. Dietary Screening Test (DST) [Internet]. Nutrii Co. Ltd; 2017 [cited 2020 Jun 15]. Available from: http://icaresolution.co.kr/
- 33. Korea Disease Control and Prevention Agency, The Korean Pediatric Society. 2017 Korean National Growth Charts for children and adolescents [Internet]. Korea Disease Control and Prevention Agency; 2017 [cited 2021 Oct 1]. Available from: https://knhanes.kdca.go.kr/knhanes/sub08/sub08_02.do
- 34. Lee EY, Song YK, Hunter S, Jeon J, Kuzik N, Predy M, et al. Levels and correlates of physical activity and screen time among early years children (2-5 years): Cross-cultural comparisons between Canadian and South Korean data. Child Care Health Dev 2021; 47(3): 377-386.ArticlePubMedLink
- 35. McArthur BA, Tough S, Madigan S. Screen time and developmental and behavioral outcomes for preschool children. Pediatr Res 2022; 91(6): 1616-1621.ArticlePubMedPDF
- 36. Utter J, Scragg R, Schaaf D. Associations between television viewing and consumption of commonly advertised foods among New Zealand children and young adolescents. Public Health Nutr 2006; 9(5): 606-612.ArticlePubMed
- 37. Manios Y, Kondaki K, Kourlaba G, Grammatikaki E, Birbilis M, Ioannou E. Television viewing and food habits in toddlers and preschoolers in Greece: The GENESIS study. Eur J Pediatr 2009; 168(7): 801-808.ArticlePubMedPDF
- 38. Jarman M, Edwards K, Blissett J. Influences on the dietary intakes of preschool children: A systematic scoping review. Int J Behav Nutr Phys Act 2022; 19(1): 20.ArticlePubMedPMCPDF
- 39. Kim JH, Jung YH. Evaluation of food behavior and nutritional status of preschool children in Nowon-gu of Seoul by using nutrition quotient (NQ). Korean J Community Nutr 2014; 19(1): 1-11.Article
- 40. Bae JM, Kang MH. Age difference in association between obesity and nutrition quotient scores of preschoolers and school children. J Nutr Health 2016; 49(6): 447-458.ArticleLink
- 41. Lee HJ, Kim JH, Song SJ. Assessment of dietary behaviors among preschoolers in Daejeon: Using nutrition quotient for preschoolers (NQP). J Nutr Health 2019; 52(2): 194-205.ArticleLink
- 42. Kim SY, Cha SM. Evaluation of dietary behavior and investigation of the affecting factors among preschoolers in Busan and Gyeongnam area using nutrition quotient for preschoolers (NQ-P). J Nutr Health 2020; 53(6): 596-612.ArticleLink
- 43. Kim SY, Cha SM. Evaluation of dietary behaviors of preschool children in Seoul and Gyeonggi-do associated with the level of parents' health consciousness: Using nutrition quotient for preschoolers (NQ-P). Nutr Res Pract 2021; 15(2): 248-265.ArticlePubMedPMCLink
- 44. Huo J, Kuang X, Xi Y, Xiang C, Yong C, Liang J, et al. Screen time and its association with vegetables, fruits, snacks and sugary sweetened beverages intake among Chinese preschool children in Changsha, Hunan province: A Cross-Sectional Study. Nutrients 2022; 14(19): 4086.ArticlePubMedPMC
- 45. Russell SJ, Croker H, Viner RM. The effect of screen advertising on children's dietary intake: A systematic review and meta-analysis. Obes Rev 2019; 20(4): 554-568.PubMed
- 46. Yeom MY, Choi E. Correlation of the nutrition quotient between parents and picky eaters in preschoolers. Korean H Food Nutr 2023; 36(2): 103-113.
- 47. Yang HR. How to approach feeding difficulties in young children. Korean J Pediatr 2017; 60(12): 379-384.ArticlePubMedPMCLink
- 48. Teekavanich S, Rukprayoon H, Sutchritpongsa S, Rojmahamongkol P. Electronic media use and food intake in Thai toddlers. Appetite 2022; 176: 106121.ArticlePubMed
- 49. Cole NC, Musaad SM, Lee SY, Donovan SM; STRONG Kids Team. Home feeding environment and picky eating behavior in preschool-aged children: A prospective analysis. Eat Behav 2018; 30: 76-82.ArticlePubMed
REFERENCES
Figure & Data
REFERENCES
Citations
Citations to this article as recorded by 
- Evaluation of young children’s dietary behaviors by parental growth concern levels in Gyeonggi area: a descriptive study
Youn-Rok Kang, Hyung-Sook Kim
Korean Journal of Community Nutrition.2026; 31(1): 75. CrossRef - Screen Use While Eating and Toddler Dietary Intake in Mexican American Families
Darcy A. Thompson, Laura K. Kaizer, Sarah J. Schmiege, Natasha J. Cabrera, Lauren Clark, Haley Ringwood, Estefania Miramontes Valdes, Andrea Jimenez-Zambrano, Monica McNulty, Jeanne M. Tschann
Journal of Nutrition Education and Behavior.2026;[Epub] CrossRef - Exploring the impact of screen time, food advertising, and nutritional knowledge of parents on eating habits in preschoolers: a comprehensive review
P. Nagadharshini, Veena B. M., Shweatha H. E.
International Journal Of Community Medicine And Public Health.2025; 12(8): 3836. CrossRef
 Cite
Cite- Figure
-
- We recommend
- Related articles
-
- The association between sodium index and the risk of obesity in Korean and Chinese university students: a cross-sectional study
- Ultra-processed food intake and dietary behaviors in Korean adolescents: a cross-sectional study based on the 2019–2023 Korea National Health and Nutrition Examination Survey
- Nutrition Quotient and nutrient intake among older adults in a rural Korean community: a cross-sectional study
- Associations between diet quality and regional factors in Korea vary according to individuals’ characteristics: a cross-sectional study
- Adult consumers’ perception of plant-based meat substitutes and related factors in Korea: a cross-sectional study
Screen time, mealtime media use, and dietary behaviors in Korean preschoolers : a cross-sectional study

Fig. 1. Percentage of children by (a) average screen time and (b) mealtime media use. 1) Time spent using TV, smartphones, computers, and tablets; 2) Use of TV or smartphone during meals
Fig. 1.
Screen time, mealtime media use, and dietary behaviors in Korean preschoolers : a cross-sectional study
| Total (n = 261) | Screen time |
Mealtime media use |
||||||
|---|---|---|---|---|---|---|---|---|
| < 2 hours (n = 116) | ≥ 2 hours (n = 145) | P-value |
No (n = 110) | Sometimes (n = 71) | Yes (n = 80) | P-value |
||
| Sex | ||||||||
| Boy | 126 (48.3) | 52 (44.8) | 74 (51.0) | 0.319 | 51 (46.4) | 36 (50.7) | 39 (48.8) | 0.845 |
| Girl | 135 (51.7) | 64 (55.2) | 71 (49.0) | 59 (53.6) | 35 (49.3) | 41 (51.3) | ||
| Age (years) | ||||||||
| 3 | 62 (23.8) | 28 (24.1) | 34 (23.5) | 0.738 | 21 (19.1) | 20 (28.2) | 21 (26.2) | 0.528 |
| 4 | 107 (41.0) | 50 (43.1) | 57 (39.3) | 51 (46.4) | 26 (36.6) | 30 (37.5) | ||
| 5 | 92 (35.2) | 38 (32.8) | 54 (37.2) | 38 (34.5) | 25 (35.2) | 29 (36.3) | ||
| Residence area | ||||||||
| Big city | 171 (65.5) | 72 (62.1) | 99 (68.3) | 0.295 | 72 (65.5) | 49 (69.0) | 50 (62.5) | 0.702 |
| Small city, rural area | 90 (34.5) | 44 (37.9) | 46 (31.7) | 38 (34.5) | 22 (31.0) | 30 (37.5) | ||
| Daytime caregiver | ||||||||
| Parents, grandparents | 81 (31.0) | 28 (24.1) | 53 (36.6) | 0.031 | 38 (34.5) | 15 (21.1) | 28 (35.0) | 0.107 |
| Child care teacher | 180 (69.0) | 88 (75.9) | 92 (63.4) | 72 (65.5) | 56 (78.9) | 52 (65.0) | ||
| Meal duration (minutes) | 32.0 ± 13.1 | 31.0 ± 12.1 | 32.8 ± 13.8 | 0.273 | 30.6 ± 12.9b | 30.3 ± 11.5b | 35.5 ± 14.2a | 0.017 |
| Sleep duration (hours) | 9.5 ± 0.9 | 9.7 ± 0.9 | 9.4 ± 0.9 | 0.009 | 9.7 ± 0.8a | 9.5 ± 0.9ab | 9.3 ± 0.9b | 0.037 |
| BMI (kg/m2) | 16.1 ± 1.9 | 15.9 ± 2.0 | 16.2 ± 1.9 | 0.273 | 15.9 ± 1.8 | 16.4 ± 2.0 | 16.2 ± 2.1 | 0.192 |
| BMI category |
||||||||
| Underweight | 15 (5.7) | 5 (4.3) | 10 (6.9) | 0.272 | 7 (6.4) | 3 (4.2) | 5 (6.2) | 0.160 |
| Normal weight | 186 (71.3) | 86 (74.1) | 100 (69.0) | 82 (74.5) | 45 (63.4) | 59 (73.8) | ||
| Overweight | 15 (5.7) | 9 (7.8) | 6 (4.1) | 8 (7.3) | 6 (8.5) | 1 (1.2) | ||
| Obesity | 45 (17.3) | 16 (13.8) | 29 (20.0) | 13 (11.8) | 17 (23.9) | 15 (18.8) | ||
| Total (n = 261) | Screen time |
Mealtime media use |
||||||||
|---|---|---|---|---|---|---|---|---|---|---|
| < 2 hours (n = 116) | ≥ 2 hours (n = 145) | P-value |
Adjusted P-value |
No (n = 110) | Sometimes (n = 71) | Yes (n = 80 | P-value |
Adjusted P-value |
||
| NQ-P score |
||||||||||
| Balance | 62.7 ± 11.8 (55.3 – 70.9) | 63.3 ± 10.4 (54.8 – 71.0) | 62.1 ± 12.8 (55.6 – 70.8) | 0.409 | 0.337 | 63.8 ± 11.9 (56.9 – 71.6) | 62.4 ± 12.8 (54.5 – 71.0) | 61.4 ± 10.7 (54.1 – 69.3) | 0.382 | 0.328 |
| Moderation | 50.7 ± 16.0 (38.9 – 61.1) | 55.2 ± 15.5 (44.0 – 65.6) | 47.2 ± 15.5 (34.0 – 56.6) | < 0.001 | < 0.001 | 55.6 ± 15.4a (44.5 – 66.3) | 47.8 ± 15.6b (37.1 – 60.7) | 46.6 ± 15.5b (33.4 – 55.4) | < 0.001 | < 0.001 |
| Environment | 62.0 ± 18.8 (48.3 – 76.7) | 68.5 ± 18.3 (54.1 – 83.4) | 56.9 ± 17.6 (43.3 – 68.9) | < 0.001 | < 0.001 | 68.9 ± 17.8a (56.8 – 82.8) | 58.4 ± 17.9b (45.3 – 71.9) | 55.9 ± 18.0b (41.4 – 68.7) | < 0.001 | < 0.001 |
| Overall | 58.9 ± 9.5 (52.5 – 64.8) | 62.2 ± 8.9 (54.8 – 68.6) | 56.3 ± 9.2 (51.0 – 62.3) | < 0.001 | < 0.001 | 62.6 ± 9.5a (57.5 – 69.1) | 57.0 ± 9.5b (52.1 – 62.7) | 55.6 ± 7.6b (50.4 – 60.7) | < 0.001 | < 0.001 |
| Assessment result |
||||||||||
| Good (≥ 65) | 65 (24.9) | 45 (38.8) | 20 (13.8) | < 0.001 | 44 (40.0) | 15 (21.1) | 6 (7.5) | < 0.001 | ||
| Monitoring required (< 65) | 196 (75.1) | 71 (61.2) | 125 (86.2) | 66 (60.0) | 56 (78.9) | 74 (92.5) | ||||
| Total (n = 261) | Screen time |
Mealtime media use |
||||||||
|---|---|---|---|---|---|---|---|---|---|---|
| < 2 hours (n = 116) | ≥ 2 hours (n = 145) | P-value |
Adjusted P-value |
No (n = 110) | Sometimes (n = 71) | Yes (n = 80) | P-value |
Adjusted P-value |
||
| Balance | ||||||||||
| White milk | 8.1 ± 6.3 | 7.9 ± 5.7 | 8.2 ± 6.8 | 0.709 | 0.646 | 7.8 ± 5.9 | 8.6 ± 7.3 | 8.0 ± 5.8 | 0.693 | 0.660 |
| Meat | 3.6 ± 1.9 | 3.6 ± 1.6 | 3.6 ± 2.1 | 0.884 | 0.965 | 3.6 ± 1.8 | 3.4 ± 1.8 | 3.8 ± 2.1 | 0.452 | 0.445 |
| Fish | 1.7 ± 1.4 | 1.6 ± 1.4 | 1.7 ± 1.5 | 0.311 | 0.391 | 1.7 ± 1.4 | 1.7 ± 1.4 | 1.5 ± 1.4 | 0.452 | 0.430 |
| Beans and bean products | 2.1 ± 1.8 | 2.1 ± 1.7 | 2.1 ± 2.0 | 0.757 | 0.987 | 2.2 ± 1.8 | 2.1 ± 2.0 | 1.9 ± 1.8 | 0.552 | 0.465 |
| Fruits |
5.1 ± 3.5 | 5.4 ± 3.6 | 4.8 ± 3.4 | 0.228 | 0.296 | 5.4 ± 3.3 | 4.5 ± 3.3 | 5.2 ± 3.8 | 0.234 | 0.269 |
| Vegetables (except kimchi) |
11.8 ± 7.3 | 13.1 ± 6.8 | 10.7 ± 7.6 | 0.009 | 0.008 | 12.8 ± 7.1 | 11.5 ± 7.8 | 10.6 ± 7.0 | 0.117 | 0.134 |
| Kimchi |
10.6 ± 7.8 | 12.9 ± 7.4 | 8.8 ± 7.7 | < 0.001 | < 0.001 | 12.6 ± 7.1a | 11.0 ± 8.0a | 7.5 ± 7.8b | < 0.001 | < 0.001 |
| Moderation | ||||||||||
| Confectionery | 4.5 ± 3.5 | 3.5 ± 2.9 | 5.3 ± 3.7 | < 0.001 | < 0.001 | 3.7 ± 3.3b | 4.5 ± 3.6ab | 5.5 ± 3.4a | 0.002 | 0.003 |
| Sugar-sweetened beverages | 1.5 ± 1.7 | 1.1 ± 1.2 | 1.9 ± 1.9 | < 0.001 | < 0.001 | 1.0 ± 1.2b | 1.9 ± 1.8a | 2.0 ± 1.9a | < 0.001 | < 0.001 |
| Processed meat | 1.5 ± 1.4 | 1.3 ± 1.3 | 1.7 ± 1.5 | 0.051 | 0.104 | 1.2 ± 1.2b | 1.8 ± 1.5a | 1.7 ± 1.6a | 0.004 | 0.007 |
| Fast food | 0.4 ± 0.5 | 0.4 ± 0.5 | 0.4 ± 0.4 | 0.424 | 0.666 | 0.4 ± 0.4 | 0.4 ± 0.6 | 0.4 ± 0.3 | 0.666 | 0.728 |
| Total (n = 261) | Screen time |
Mealtime media use |
||||||||
|---|---|---|---|---|---|---|---|---|---|---|
| < 2 hours (n = 116) | ≥ 2 hours (n = 145) | P-value |
Adjusted P-value |
No (n = 110) | Sometimes (n = 71) | Yes (n = 80) | P-value |
Adjusted P-value |
||
| Average screen time (hours/d) | 1.6 ± 0.8 | 0.8 ± 0.3 | 2.3 ± 0.5 | < 0.001 | < 0.001 | 1.3 ± 0.7c | 1.7 ± 0.8b | 2.1 ± 0.7a | < 0.001 | < 0.001 |
| Breakfast frequency (weekly frequency) | 4.4 ± 2.5 | 4.8 ± 2.4 | 4.1 ± 2.6 | 0.029 | 0.024 | 5.0 ± 2.5a | 4.0 ± 2.5b | 4.1 ± 2.6b | 0.008 | 0.007 |
| Eating without moving around |
3.4 ± 1.1 | 3.6 ± 1.0 | 3.3 ± 1.1 | 0.012 | 0.004 | 3.7 ± 1.0a | 3.3 ± 1.0b | 3.2 ± 1.1b | 0.002 | < 0.001 |
| Washing hands before eating |
3.8 ± 0.8 | 4.0 ± 0.8 | 3.6 ± 0.8 | < 0.001 | < 0.001 | 3.9 ± 0.8a | 3.9 ± 0.8a | 3.5 ± 0.9b | 0.003 | 0.004 |
| Parents’ efforts for healthy eating |
3.9 ± 0.7 | 4.1 ± 0.7 | 3.7 ± 0.7 | < 0.001 | < 0.001 | 4.0 ± 0.7a | 3.8 ± 0.7ab | 3.7 ± 0.7b | 0.006 | 0.006 |
| Total (n = 261) | Screen time |
Mealtime media use |
||||||||
|---|---|---|---|---|---|---|---|---|---|---|
| < 2 hours (n = 116) | ≥ 2 hours (n = 145) | P-value |
Adjusted P-value |
No (n = 110) | Sometimes (n = 71) | Yes (n = 80) | P-value |
Adjusted P-value |
||
| Chewing difficulty-hard food | 1.9 ± 0.9 | 1.9 ± 0.8 | 2.0 ± 0.9 | 0.510 | 0.449 | 1.9 ± 0.8 | 1.9 ± 0.8 | 2.0 ± 0.9 | 0.659 | 0.663 |
| Chewing difficulty-chewy food | 2.3 ± 1.0 | 2.2 ± 0.9 | 2.4 ± 1.0 | 0.069 | 0.057 | 2.3 ± 1.0 | 2.3 ± 0.9 | 2.4 ± 1.1 | 0.726 | 0.745 |
| Swallowing difficulty-holding or spitting out food | 2.3 ± 0.9 | 2.1 ± 1.0 | 2.4 ± 0.9 | 0.035 | 0.012 | 2.2 ± 0.9 | 2.2 ± 1.0 | 2.5 ± 1.0 | 0.135 | 0.119 |
| Swallowing difficulty-retching | 2.0 ± 0.8 | 1.8 ± 0.8 | 2.1 ± 0.9 | 0.004 | 0.002 | 2.0 ± 0.9 | 1.9 ± 0.9 | 2.0 ± 0.8 | 0.815 | 0.827 |
| Picky eating | 2.8 ± 1.1 | 2.5 ± 1.0 | 3.0 ± 1.2 | < 0.001 | < 0.001 | 2.6 ± 1.0b | 2.6 ± 1.2b | 3.2 ± 1.2a | < 0.001 | < 0.001 |
| Refusal to eat | 1.7 ± 0.9 | 1.6 ± 0.8 | 1.8 ± 0.9 | 0.053 | 0.033 | 1.6 ± 0.8b | 1.6 ± 0.8b | 2.0 ± 1.0a | 0.009 | 0.008 |
| Not feeding themselves | 2.4 ± 1.1 | 2.2 ± 1.1 | 2.6 ± 1.2 | 0.014 | 0.004 | 2.1 ± 1.0c | 2.5 ± 1.0b | 2.9 ± 1.2a | < 0.001 | < 0.001 |
Table 1. General characteristics of preschoolers by screen media exposure
n (%) or mean ± SD Underweight (weight for age < 5th percentiles), normal weight (5th ≤ BMI for age < 85th percentiles), overweight (85th ≤ BMI for age < 95th percentiles), and obesity (BMI for age ≥ 95th percentiles) based on the 2017 Korean National Growth Chart Values with different superscripts within each row are significantly different at BMI: Body Mass Index
Table 2. NQ-P score and assessment result by screen media exposure
Mean ± SD (25th –75th percentile) or n (%) Maximum score is 100. "Good" represents an NQ-P score of 65 or above, while "monitoring required" represents a score below 65. Values with different superscripts within each row are significantly different at BMI: Body Mass Index
Table 3. Weekly consumption frequency of food group by screen media exposure
Mean ± SD Questions from DST Values with different superscripts within each row are significantly different at BMI: Body Mass Index, DST: Diet Screening Test
Table 4. Environmental factors of NQ-P by screen media exposure
Mean ± SD The responses are based on a 5-point Likert scale, 1 = very unlikely, 2 = unlikely, 3 = neutral, 4 = likely, 5 = very likely. Values with different superscripts within each row are significantly different at BMI: Body Mass Index
Table 5. Feeding difficulties1) by screen media exposure
Mean ± SD The responses are based on a 5-point Likert scale, 1 = very unlikely, 2 = unlikely, 3 = neutral, 4 = likely, 5 = very likely. Values with different superscripts within each row are significantly different at BMI: Body Mass Index


