
Articles
- Page Path
- HOME > Korean J Community Nutr > Volume 28(4); 2023 > Article
-
Research Article
- Association between dietary intake, body measurements, and urinary bone resorption markers in young adults with osteopenia and osteoporosis: a cross-sectional study
-
Mi-Hyun Kim
 , Mi-Kyeong Choi†
 -
Korean Journal of Community Nutrition 2023;28(4):282-292.
DOI: https://doi.org/10.5720/kjcn.2023.28.4.282
Published online: August 31, 2023
Professor, Department of Food and Nutrition, Kongju National University, Yesan, Korea
- †Corresponding author Mi-Kyeong Choi Department of Food and Nutrition, Kongju National University, 54 Daehak-ro, Yesan 32439, Korea Tel: +82-41-330-1462 Fax: +82-41-330-1469 E-mail: mkchoi67@kongju.ac.kr
• Received: April 25, 2023 • Revised: June 12, 2023 • Accepted: July 3, 2023
© 2023 The Korean Society of Community Nutrition
This is an Open-Access article distributed under the terms of the Creative Commons Attribution Non-Commercial License (http://creativecommons.org/licenses/by-nc/4.0) which permits unrestricted non-commercial use, distribution, and reproduction in any medium, provided the original work is properly cited.
- 1,685 Views
- 22 Download
- 1 Crossref
Abstract
-
Objectives
- Bone health in early adulthood, as individuals approach peak bone mass, plays a critical role in preventing osteoporosis later in life. This study aimed to investigate the associations between lifestyle and dietary factors, anthropometric measurements, and urinary bone resorption markers in young adults.
-
Methods
- A cross-sectional study was conducted with 100 healthy Korean adults (50 men and 50 women) in their 20s and early 30s. Bone mineral density (BMD), anthropometric measurements, dietary intake (24-hour recall), and urinary bone resorption indicators (deoxypyridinoline and N-terminal telopeptide of type I collagen) were analyzed. Variables were compared between the osteopenia and osteoporosis groups (OSTEO group: 30% men and 60% women) and the healthy control group.
-
Results
- Men in the OSTEO group were significantly taller than those in the control group (P < 0.05). Women in the OSTEO group had significantly lower body weight and body composition (muscle and body fat) than those in the normal group (P < 0.01). Men in the OSTEO group had a significantly higher intake of animal calcium (Ca) than those in the normal group (P < 0.05). Women in the OSTEO group had significantly higher dietary fiber, vitamin A, Ca, plant Ca, and potassium intake than did those in the normal group (P < 0.05). There were no significant differences in caffeinated beverage consumption, eating habits, or urinary bone resorption indicators between the OSTEO and control groups of either sex.
-
Conclusions
- In our study of young South Korean adults, we observed low bone density levels, with particularly low BMD in taller men and underweight women. We found a higher nutrient intake in the OSTEO group, indicating the possibility of reverse causality, a phenomenon often found in cross-sectional studies. Therefore, there is a need to further elucidate dietary factors related to osteoporosis in young adults through prospective cohort studies involving a larger population.
Introduction
Methods
Results
Discussion
Conclusion
-
Conflict of Interest
There are no financial or other issues that might lead to conflict of interest.
-
Funding
This research received no external funding.
-
Data Availability
The participants of the study did not give written consent for their data to be shared publicly. Due to the sensitive nature of the research, supporting data is not available.
NOTES
Fig. 1.Comparison of bone resorption indicators (NTx (A) and DPD (B)) in the urine between OSTEO and normal groups in men and women. OSTEO: osteopenia & osteoporosis, NTx: N-terminal telopeptide of type I collagen, DPD: deoxypyridinoline, NS: not significant by unpaired t-test

Table 1.Characteristics and body measurements in OSTEO and normal groups among men and women
| Characteristics |
Men (n = 50) |
P-value1) |
Women (n = 50) |
P-value1) | ||
|---|---|---|---|---|---|---|
| OSTEO (n = 15) | Normal (n = 35) | OSTEO (n = 30) | Normal (n = 20) | |||
| Age | 22.33 ± 0.90 | 22.54 ± 1.58 | 0.557 | 21.57 ± 2.11 | 20.80 ± 1.24 | 0.113 |
| Height (cm) | 177.50 ± 4.50 | 173.46 ± 5.49 | 0.016 | 159.43 ± 4.30 | 160.82 ± 4.85 | 0.294 |
| Weight (kg) | 76.36 ± 10.63 | 72.95 ± 10.12 | 0.288 | 54.50 ± 11.43 | 65.68 ± 13.30 | 0.003 |
| BMI (kg/m2) | 24.21 ± 3.03 | 24.20 ± 2.71 | 0.991 | 21.39 ± 4.02 | 25.36 ± 4.84 | 0.003 |
| SMM (kg) | 34.45 ± 4.38 | 32.05 ± 4.43 | 0.085 | 18.94 ± 3.01 | 22.18 ± 3.92 | 0.002 |
| BFM (kg) | 16.41 ± 5.65 | 16.52 ± 4.83 | 0.946 | 17.44 ± 7.55 | 23.85 ± 8.14 | 0.006 |
| VFA (cm2) | 88.92 ± 21.93 | 85.20 ± 20.14 | 0.563 | 43.71 ± 26.58 | 68.57 ± 29.85 | 0.003 |
| BQI | 69.25 ± 10.00 | 100.09 ± 10.60 | < 0.001 | 71.56 ± 9.38 | 93.23 ± 9.85 | < 0.001 |
| T-score | - 1.86 ± 0.54 | - 0.21 ± 0.57 | < 0.001 | - 1.74 ± 0.50 | - 0.58 ± 0.53 | < 0.001 |
| Z-score | - 1.95 ± 0.57 | - 0.19 ± 0.60 | < 0.001 | - 1.82 ± 0.56 | - 0.52 ± 0.60 | < 0.001 |
| Bone status | Men (n = 50) | Women (n = 50) | P-value2) | |||
| Normal (T-score ≥ - 1.0) | 35 (70.0) | 20 (40.0) | 0.005 | |||
| Osteopenia (- 2.5 ≤ T-score < -1.0) | 12 (24.0) | 27 (54.0) | ||||
| Osteoporosis (T-score < - 2.5) | 3 (6.0) | 3 (6.0) | ||||
Table 2.Comparison of daily energy and nutrient intake between OSTEO and normal groups in men and women
|
Men (n = 50) |
P-value1) | Adjusted P-value2) |
Women (n = 50) |
P-value1) | Adjusted P-value2) | |||
|---|---|---|---|---|---|---|---|---|
| OSTEO (n = 15) | Normal (n = 35) | OSTEO (n = 30) | Normal (n = 20) | |||||
| Energy (kcal) | 2,392.68 ± 660.51 | 2,211.67 ± 775.72 | 0.434 | - | 1,748.18 ± 582.91 | 1,893.34 ± 599.94 | 0.398 | - |
| Carbohydrate (g) | 307.85 ± 60.66 | 261.18 ± 111.69 | 0.064 | 0.187 | 247.09 ± 93.43 | 214.75 ± 79.51 | 0.210 | 0.005 |
| Fat (g) | 90.15 ± 41.59 | 79.26 ± 37.42 | 0.366 | 0.641 | 55.25 ± 24.24 | 58.87 ± 28.93 | 0.634 | 0.924 |
| Protein (g) | 84.84 ± 33.97 | 76.73 ± 29.85 | 0.403 | 0.722 | 61.60 ± 23.01 | 57.38 ± 21.89 | 0.520 | 0.091 |
| Dietary fiber (g) | 19.34 ± 8.48 | 16.71 ± 8.22 | 0.310 | 0.499 | 18.73 ± 8.35 | 12.46 ± 5.16 | 0.002 | 0.000 |
| Vitamin A (mg RAE) | 456.56 ± 274.60 | 365.48 ± 252.02 | 0.260 | 0.397 | 372.34 ± 287.02 | 245.71 ± 147.63 | 0.047 | 0.019 |
| Vitamin D (mg) | 2.70 ± 2.75 | 2.51 ± 5.29 | 0.870 | 0.909 | 3.21 ± 3.18 | 4.97 ± 10.88 | 0.490 | 0.548 |
| Vitamin E (mg) | 21.09 ± 10.76 | 20.65 ± 11.74 | 0.901 | 0.836 | 18.28 ± 10.45 | 14.48 ± 6.72 | 0.124 | 0.035 |
| Vitamin K (mg) | 100.67 ± 76.48 | 93.95 ± 80.36 | 0.785 | 0.835 | 75.59 ± 56.03 | 61.86 ± 50.27 | 0.381 | 0.316 |
| Vitamin C (mg) | 62.81 ± 46.55 | 42.07 ± 34.37 | 0.086 | 0.128 | 66.56 ± 57.37 | 48.65 ± 87.69 | 0.427 | 0.351 |
| Vitamin B1 (mg) | 2.37 ± 1.01 | 1.97 ± 0.87 | 0.158 | 0.241 | 1.48 ± 0.59 | 1.24 ± 0.74 | 0.213 | 0.101 |
| Vitamin B2 (mg) | 1.75 ± 1.01 | 1.46 ± 0.75 | 0.260 | 0.421 | 1.35 ± 0.66 | 1.11 ± 0.57 | 0.192 | 0.049 |
| Niacin (mg) | 16.46 ± 7.39 | 13.84 ± 7.08 | 0.242 | 0.386 | 12.20 ± 4.90 | 11.64 ± 4.88 | 0.696 | 0.274 |
| Vitamin B6 (mg) | 1.65 ± 0.70 | 1.45 ± 0.62 | 0.329 | 0.486 | 1.37 ± 0.58 | 1.46 ± 0.98 | 0.708 | 0.943 |
| Folate (mg) | 403.29 ± 211.80 | 356.65 ± 179.36 | 0.429 | 0.661 | 367.25 ± 210.76 | 269.28 ± 143.48 | 0.076 | 0.026 |
| Vitamin B12 (mg) | 8.57 ± 6.81 | 6.07 ± 7.22 | 0.260 | 0.327 | 5.56 ± 3.85 | 9.03 ± 15.37 | 0.335 | 0.301 |
| Calcium (mg) | 547.94 ± 355.41 | 408.46 ± 283.44 | 0.147 | 0.221 | 564.54 ± 494.33 | 331.69 ± 231.00 | 0.030 | 0.019 |
| Plant calcium (mg) | 236.26 ± 172.67 | 227.98 ± 182.56 | 0.882 | 0.784 | 255.41 ± 157.90 | 165.47 ± 101.67 | 0.018 | 0.003 |
| Animal calcium (mg) | 311.67 ± 240.21 | 180.49 ± 161.73 | 0.028 | 0.037 | 309.13 ± 466.88 | 166.23 ± 224.62 | 0.156 | 0.148 |
| Phosphorus (mg) | 1168.53 ± 525.70 | 1063.31 ± 420.81 | 0.456 | 0.851 | 928.41 ± 367.81 | 816.65 ± 287.32 | 0.258 | 0.029 |
| Sodium (mg) | 4,199.53 ± 1,563.34 | 3,597.55 ± 1,587.89 | 0.223 | 0.355 | 3,333.52 ± 1,359.37 | 2,934.29 ± 1,396.91 | 0.319 | 0.080 |
| Potassium (mg) | 2,353.38 ± 835.12 | 1,979.84 ± 816.66 | 0.148 | 0.216 | 2,221.47 ± 1,051.47 | 1,466.26 ± 529.30 | 0.002 | 0.000 |
| Iron (mg) | 14.98 ± 7.75 | 13.05 ± 5.82 | 0.339 | 0.536 | 13.56 ± 7.32 | 10.03 ± 4.88 | 0.065 | 0.002 |
| Plant iron (mg) | 8.93 ± 4.22 | 8.09 ± 3.85 | 0.497 | 0.751 | 9.61 ± 5.57 | 7.10 ± 3.76 | 0.084 | 0.004 |
| Animal iron (mg) | 6.04 ± 4.73 | 4.96 ± 3.47 | 0.369 | 0.530 | 3.94 ± 2.75 | 2.93 ± 2.41 | 0.189 | 0.072 |
| Zinc (mg) | 10.49 ± 4.56 | 8.89 ± 4.02 | 0.221 | 0.352 | 7.81 ± 3.45 | 6.70 ± 2.86 | 0.240 | 0.052 |
| Copper (mg) | 671.09 ± 490.37 | 604.95 ± 454.17 | 0.647 | 0.963 | 603.37 ± 299.88 | 547.02 ± 388.75 | 0.566 | 0.250 |
| Selenium (mg) | 86.03 ± 55.06 | 74.70 ± 44.61 | 0.447 | 0.701 | 67.45 ± 36.62 | 71.98 ± 48.90 | 0.710 | 0.937 |
| Cholesterol (mg) | 339.69 ± 270.74 | 315.10 ± 268.44 | 0.768 | 0.974 | 329.84 ± 261.41 | 312.35 ± 226.97 | 0.808 | 0.487 |
Table 3.Comparison of preference and intake frequency of caffeinated beverages between OSTEO and normal groups in men and women
Table 4.Comparison of eating attitudes and habits between OSTEO and normal groups in men and women
- 1. Riggs BL, Melton LJ. Involutional osteoporosis. New Engl J Med 1986; 314(26): 1676-1686.ArticlePubMed
- 2. Cosman F, Beur SJ, LeBoff MS, Lewiecki EM, Tanner B, Randall S, et al. Clinician’s guide to prevention and treatment of osteoporosis. Osteoporosis Int 2014; 25: 2359-2381.ArticlePubMedPMCPDF
- 3. Choi JH, Kim SK. Comparison of the dietary factors between normal and osteopenia groups by bone mineral density in Korean female college students. J Korean Soc Food Sci Nutr 2008; 37(7): 869-878.Article
- 4. Choi MJ, Jung YJ. The relationship between food habit, nutrient intakes and bone mineral density and bone mineral content in adult women. Korean J Nutr 1998; 31(9): 1446-1456.
- 5. Lee IJ. Comparative of bone mineral density according to the body mass index and eating habits of female university students. J Radiol Sci Technol 2017; 40(4): 581-587.Article
- 6. Lee JS, Park HS, Han SH, Gegen T, Jang MJ. Study on relationship between caffeine intake level and metabolic syndrome and related diseases in Korean adults: 2013-2016 Korea National Health and Nutrition Examination Survey. J Nutr Health 2019; 52(2): 227-241.ArticleLink
- 7. Yean JY, Sung CJ. A study on dietary mineral intakes, urinary mineral excretions, and bone mineral density in Korean postmenopausal women. Korean J Community Nutr 2011; 16(5): 569-579.Article
- 8. Koo JO, Kim MS. Analysis of bone mineral density, biochemical index and nutrient intakes of 30-70 years old women: Based on 2011 KNHANES. Korean J Community Nutr 2014; 19(4): 328-341.Article
- 9. Conlisk AJ, Galuska DA. Is caffeine associated with bone mineral density in young adult women? Prev Med 2000; 31(5): 562-568.ArticlePubMed
- 10. Lim HJ. A study on the calcium and sodium intakes and urinary calcium excretion of Adults in Busan. Korean J Community Nutr 2011; 16(2): 215-226.Article
- 11. Kim MG, Kim SD. Factors affecting coffee intake in Korean adults. J Korea Acad Ind Soc 2020; 21(3): 529-536.
- 12. Korea Disease Control and Prevention Agency. Korean Health Statistics 2021: Korean national health and nutrition examination survey. Cheongju: Korea Disease Control and Prevention Agency; 2022. p. 118-120.
- 13. Darelid A, Ohlsson C, Nilsson M, Kindblom JM, Mellstrom D, Lorentzon M. Catch up in bone acquisition in young adult men with late normal puberty. J Bone Miner Res 2012; 27(10): 2198-2207.ArticlePubMedPDF
- 14. Meyer HE, Tverdal A, Falch JA. Risk factors for hip fracture in middle-aged Norwegian women and men. Am J Epidemiol 1993; 137(11): 1203-1211.ArticlePubMed
- 15. Cauley JA, Cawthon PM, Peters KE, Cummings SR, Ensrud KE, Bauer DC, et al. Risk factors for hip fracture in older men: The Osteoporotic Fractures in Men Study (MrOS). J Bone Miner Res 2016; 31(10): 1810-1819.ArticlePubMedPMCPDF
- 16. Vandenput L, Kindblom JM, Bygdell M, Nethander M, Ohlsson C. Pubertal timing and adult fracture risk in men: A population-based cohort study. PLoS Med 2019; 16(12): e1002986.ArticlePubMedPMC
- 17. Vanderschueren D, Laurent MR, Claessens F, Gielen E, Lagerquist MK, Vandenput L, et al. Sex steroid actions in male bone. Endocr Rev 2014; 35(6): 906-960.ArticlePubMedPMC
- 18. Jeong HR, Yun SJ, Kim MH. Evaluation of food and nutrient intake by food frequency questionnaire between normal and risk groups according to the bone mineral density of female college students residing in Gangwon area. Korean J Community Nutr 2010; 15(4): 429-444.
- 19. Edelstein SL, Barrett-Connor E. Relation between body size and bone mineral density in elderly men and women. Am J Epidemiol 1993; 138(3): 160-169.ArticlePubMed
- 20. DeSimone DP, Stevens J, Edwards J, Shary J, Gordon L, Bell NH. Influence of body habitus and race on bone mineral density of the midradius, hip, and spine in aging women. J Bone Miner Res 1989; 4(6): 827-830.ArticlePubMedPDF
- 21. Raisz LG. Pathogenesis of osteoporosis: Concepts, conflicts, and prospects. J Clin Invest 2005; 115(12): 3318-3325.ArticlePubMedPMC
- 22. Thomas T, Burguera B, Melton LJ, Atkinson EJ, O'Fallon WM, Riggs BL, et al. Role of serum leptin, insulin, and estrogen levels as potential mediators of the relationship between fat mass and bone mineral density in men versus women. Bone 2001; 29(2): 114-120.ArticlePubMed
- 23. Finkelstein JS, Brockwell SE, Mehta V, Greendale GA, Sowers MR, Ettinger B, et al. Bone mineral density changes during the menopause transition in a multiethnic cohort of women. J Clin Endocr Metab 2008; 93(3): 861-868.ArticlePubMedPMCPDF
- 24. Maclnnis RJ, Cassar C, Nowson CA, Paton LM, Flicker L, Hopper JL, et al. Determinants of bone density in 30-to 65-year-old women: A co-twin study. J Bone Miner Res 2003; 18(9): 1650-1656.ArticlePubMedPDF
- 25. Blain H, Vuillemin A, Guillemin F, Durant R, Hanesse B, De Talance N, et al. Serum leptin level is a predictor of bone mineral density in postmenopausal women. J Clin Endocr Metab 2002; 87(3): 1030-1035.ArticlePubMed
- 26. Pasco JA, Henry MJ, Kotowicz MA, Collier GR, Ball MJ, Ugoni AM, et al. Serum leptin levels are associated with bone mass in nonobese women. J Clin Endocr Metab 2001; 86(5): 1884-1887.ArticlePubMed
- 27. Weeks BK, Beck BR. The BPAQ: A bone-specific physical activity assessment instrument. Osteoporosis Int 2008; 19: 1567-1577.ArticlePDF
- 28. Casale M, von Hurst PR, Beck KL, Shultz S, Kruger MC, O'Brien W, et al. Lean mass and body fat percentage are contradictory predictors of bone mineral density in pre-menopausal pacific island women. Nutrients 2016; 8(8): 470.ArticlePubMedPMC
- 29. Tehrani SS, Moallem M, Ebrahimi R, Hosseini SR, Nooreddini H, Parsian H. Status of circulating bone turnover markers in elderly osteoporosis/osteopenia patients in comparison with healthy subjects. Asian Biomed 2020; 14(3): 97-106.Article
- 30. Islamoglu AH, Garipagaoglu M, Bicer HS, Kurtulus D, Ozturk M, Gunes FE. The effects of dietary changes on bone markers in postmenopausal vertebral osteopenia. Clin Nutr 2020; 39(12): 3744-3749.ArticlePubMed
- 31. Harris SS, Dawson-Hughes B. Caffeine and bone loss in healthy postmenopausal women. Am J Clin Nutr 1994; 60(4): 573-578.ArticlePubMed
- 32. Lloyd T, Rollings N, Eggli DF, Kieselhorst K, Chinchilli VM. Dietary caffeine intake and bone status of postmenopausal women. Am J Clin Nutr 1997; 65(6): 1826-1830.ArticlePubMed
- 33. Choi MK, Kim MH. The association between coffee consumption and bone status in young adult males according to calcium intake level. Clin Nutr Res 2016; 5(3): 180-189.ArticlePubMedPMCLink
- 34. Choi E, Choi KH, Park SM, Shin D, Joh HK, Cho E. The benefit of bone health by drinking coffee among Korean postmenopausal women: A cross-sectional analysis of the fourth & fifth Korea National Health and Nutrition Examination Surveys. PLoS One 2016; 11(1): e0147762.ArticlePubMedPMC
- 35. Heaney RP. Effects of caffeine on bone and the calcium economy. Food Chem Toxicol 2002; 40(9): 1263-1270.ArticlePubMed
- 36. Conlisk AJ, Galuska DA. Is caffeine associated with bone mineral density in young adult women? Prev Med 2000; 31(5): 562-568.ArticlePubMed
- 37. Hallström H, Melhus H, Glynn A, Lind L, Syvänen AC, Michaëlsson K. Coffee consumption and CYP1A2 genotype in relation to bone mineral density of the proximal femur in elderly men and women: A cohort study. Nutr Metab 2010; 7(1): 1-9.
- 38. Ministry of Health and Welfare (KR), The Korean Nutrition Society. Dietary reference intakes for Koreans 2020: Minerals. Sejong: Ministry of Health and Welfare; 2020. p. 2-34.
REFERENCES
Figure & Data
REFERENCES
Citations
Citations to this article as recorded by 
- High-protein diets for weight loss and their associations with bone status and diet quality in female college students
Seon-Young Park, Jee-Young Yeon, Mi-Hyun Kim
Nutrition Research and Practice.2026; 20(2): 317. CrossRef
 Cite
Cite- Figure
-
- We recommend
- Related articles
-
- The association between sodium index and the risk of obesity in Korean and Chinese university students: a cross-sectional study
- Associations between diet quality and regional factors in Korea vary according to individuals’ characteristics: a cross-sectional study
- A study on regional differences in dietary behaviors and satisfaction in Korea focusing on urban and rural comparisons: a cross-sectional study
- Relationship between self-care and health-related behaviors among Korean adults: a cross-sectional study
- Eating habits and dietary supplement utilization according to food-related lifestyle among Korean adults: a cross-sectional study
Association between dietary intake, body measurements, and urinary bone resorption markers in young adults with osteopenia and osteoporosis: a cross-sectional study
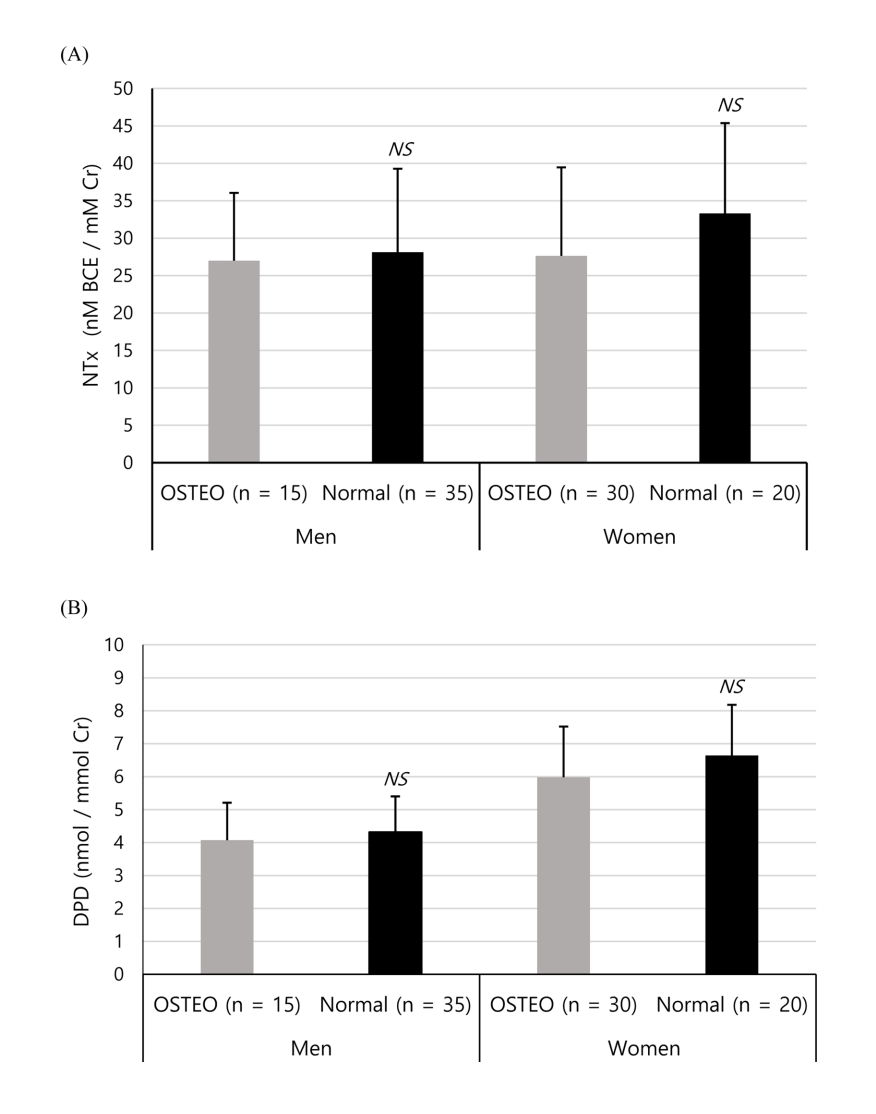
Fig. 1. Comparison of bone resorption indicators (NTx (A) and DPD (B)) in the urine between OSTEO and normal groups in men and women. OSTEO: osteopenia & osteoporosis, NTx: N-terminal telopeptide of type I collagen, DPD: deoxypyridinoline, NS: not significant by unpaired t-test
Fig. 1.
Association between dietary intake, body measurements, and urinary bone resorption markers in young adults with osteopenia and osteoporosis: a cross-sectional study
| Characteristics | Men (n = 50) |
P-value |
Women (n = 50) |
P-value |
||
|---|---|---|---|---|---|---|
| OSTEO (n = 15) | Normal (n = 35) | OSTEO (n = 30) | Normal (n = 20) | |||
| Age | 22.33 ± 0.90 | 22.54 ± 1.58 | 0.557 | 21.57 ± 2.11 | 20.80 ± 1.24 | 0.113 |
| Height (cm) | 177.50 ± 4.50 | 173.46 ± 5.49 | 0.016 | 159.43 ± 4.30 | 160.82 ± 4.85 | 0.294 |
| Weight (kg) | 76.36 ± 10.63 | 72.95 ± 10.12 | 0.288 | 54.50 ± 11.43 | 65.68 ± 13.30 | 0.003 |
| BMI (kg/m2) | 24.21 ± 3.03 | 24.20 ± 2.71 | 0.991 | 21.39 ± 4.02 | 25.36 ± 4.84 | 0.003 |
| SMM (kg) | 34.45 ± 4.38 | 32.05 ± 4.43 | 0.085 | 18.94 ± 3.01 | 22.18 ± 3.92 | 0.002 |
| BFM (kg) | 16.41 ± 5.65 | 16.52 ± 4.83 | 0.946 | 17.44 ± 7.55 | 23.85 ± 8.14 | 0.006 |
| VFA (cm2) | 88.92 ± 21.93 | 85.20 ± 20.14 | 0.563 | 43.71 ± 26.58 | 68.57 ± 29.85 | 0.003 |
| BQI | 69.25 ± 10.00 | 100.09 ± 10.60 | < 0.001 | 71.56 ± 9.38 | 93.23 ± 9.85 | < 0.001 |
| T-score | - 1.86 ± 0.54 | - 0.21 ± 0.57 | < 0.001 | - 1.74 ± 0.50 | - 0.58 ± 0.53 | < 0.001 |
| Z-score | - 1.95 ± 0.57 | - 0.19 ± 0.60 | < 0.001 | - 1.82 ± 0.56 | - 0.52 ± 0.60 | < 0.001 |
| Bone status | Men (n = 50) | Women (n = 50) | P-value |
|||
| Normal (T-score ≥ - 1.0) | 35 (70.0) | 20 (40.0) | 0.005 | |||
| Osteopenia (- 2.5 ≤ T-score < -1.0) | 12 (24.0) | 27 (54.0) | ||||
| Osteoporosis (T-score < - 2.5) | 3 (6.0) | 3 (6.0) | ||||
| Men (n = 50) |
P-value |
Adjusted P-value |
Women (n = 50) |
P-value |
Adjusted P-value |
|||
|---|---|---|---|---|---|---|---|---|
| OSTEO (n = 15) | Normal (n = 35) | OSTEO (n = 30) | Normal (n = 20) | |||||
| Energy (kcal) | 2,392.68 ± 660.51 | 2,211.67 ± 775.72 | 0.434 | - | 1,748.18 ± 582.91 | 1,893.34 ± 599.94 | 0.398 | - |
| Carbohydrate (g) | 307.85 ± 60.66 | 261.18 ± 111.69 | 0.064 | 0.187 | 247.09 ± 93.43 | 214.75 ± 79.51 | 0.210 | 0.005 |
| Fat (g) | 90.15 ± 41.59 | 79.26 ± 37.42 | 0.366 | 0.641 | 55.25 ± 24.24 | 58.87 ± 28.93 | 0.634 | 0.924 |
| Protein (g) | 84.84 ± 33.97 | 76.73 ± 29.85 | 0.403 | 0.722 | 61.60 ± 23.01 | 57.38 ± 21.89 | 0.520 | 0.091 |
| Dietary fiber (g) | 19.34 ± 8.48 | 16.71 ± 8.22 | 0.310 | 0.499 | 18.73 ± 8.35 | 12.46 ± 5.16 | 0.002 | 0.000 |
| Vitamin A (mg RAE) | 456.56 ± 274.60 | 365.48 ± 252.02 | 0.260 | 0.397 | 372.34 ± 287.02 | 245.71 ± 147.63 | 0.047 | 0.019 |
| Vitamin D (mg) | 2.70 ± 2.75 | 2.51 ± 5.29 | 0.870 | 0.909 | 3.21 ± 3.18 | 4.97 ± 10.88 | 0.490 | 0.548 |
| Vitamin E (mg) | 21.09 ± 10.76 | 20.65 ± 11.74 | 0.901 | 0.836 | 18.28 ± 10.45 | 14.48 ± 6.72 | 0.124 | 0.035 |
| Vitamin K (mg) | 100.67 ± 76.48 | 93.95 ± 80.36 | 0.785 | 0.835 | 75.59 ± 56.03 | 61.86 ± 50.27 | 0.381 | 0.316 |
| Vitamin C (mg) | 62.81 ± 46.55 | 42.07 ± 34.37 | 0.086 | 0.128 | 66.56 ± 57.37 | 48.65 ± 87.69 | 0.427 | 0.351 |
| Vitamin B1 (mg) | 2.37 ± 1.01 | 1.97 ± 0.87 | 0.158 | 0.241 | 1.48 ± 0.59 | 1.24 ± 0.74 | 0.213 | 0.101 |
| Vitamin B2 (mg) | 1.75 ± 1.01 | 1.46 ± 0.75 | 0.260 | 0.421 | 1.35 ± 0.66 | 1.11 ± 0.57 | 0.192 | 0.049 |
| Niacin (mg) | 16.46 ± 7.39 | 13.84 ± 7.08 | 0.242 | 0.386 | 12.20 ± 4.90 | 11.64 ± 4.88 | 0.696 | 0.274 |
| Vitamin B6 (mg) | 1.65 ± 0.70 | 1.45 ± 0.62 | 0.329 | 0.486 | 1.37 ± 0.58 | 1.46 ± 0.98 | 0.708 | 0.943 |
| Folate (mg) | 403.29 ± 211.80 | 356.65 ± 179.36 | 0.429 | 0.661 | 367.25 ± 210.76 | 269.28 ± 143.48 | 0.076 | 0.026 |
| Vitamin B12 (mg) | 8.57 ± 6.81 | 6.07 ± 7.22 | 0.260 | 0.327 | 5.56 ± 3.85 | 9.03 ± 15.37 | 0.335 | 0.301 |
| Calcium (mg) | 547.94 ± 355.41 | 408.46 ± 283.44 | 0.147 | 0.221 | 564.54 ± 494.33 | 331.69 ± 231.00 | 0.030 | 0.019 |
| Plant calcium (mg) | 236.26 ± 172.67 | 227.98 ± 182.56 | 0.882 | 0.784 | 255.41 ± 157.90 | 165.47 ± 101.67 | 0.018 | 0.003 |
| Animal calcium (mg) | 311.67 ± 240.21 | 180.49 ± 161.73 | 0.028 | 0.037 | 309.13 ± 466.88 | 166.23 ± 224.62 | 0.156 | 0.148 |
| Phosphorus (mg) | 1168.53 ± 525.70 | 1063.31 ± 420.81 | 0.456 | 0.851 | 928.41 ± 367.81 | 816.65 ± 287.32 | 0.258 | 0.029 |
| Sodium (mg) | 4,199.53 ± 1,563.34 | 3,597.55 ± 1,587.89 | 0.223 | 0.355 | 3,333.52 ± 1,359.37 | 2,934.29 ± 1,396.91 | 0.319 | 0.080 |
| Potassium (mg) | 2,353.38 ± 835.12 | 1,979.84 ± 816.66 | 0.148 | 0.216 | 2,221.47 ± 1,051.47 | 1,466.26 ± 529.30 | 0.002 | 0.000 |
| Iron (mg) | 14.98 ± 7.75 | 13.05 ± 5.82 | 0.339 | 0.536 | 13.56 ± 7.32 | 10.03 ± 4.88 | 0.065 | 0.002 |
| Plant iron (mg) | 8.93 ± 4.22 | 8.09 ± 3.85 | 0.497 | 0.751 | 9.61 ± 5.57 | 7.10 ± 3.76 | 0.084 | 0.004 |
| Animal iron (mg) | 6.04 ± 4.73 | 4.96 ± 3.47 | 0.369 | 0.530 | 3.94 ± 2.75 | 2.93 ± 2.41 | 0.189 | 0.072 |
| Zinc (mg) | 10.49 ± 4.56 | 8.89 ± 4.02 | 0.221 | 0.352 | 7.81 ± 3.45 | 6.70 ± 2.86 | 0.240 | 0.052 |
| Copper (mg) | 671.09 ± 490.37 | 604.95 ± 454.17 | 0.647 | 0.963 | 603.37 ± 299.88 | 547.02 ± 388.75 | 0.566 | 0.250 |
| Selenium (mg) | 86.03 ± 55.06 | 74.70 ± 44.61 | 0.447 | 0.701 | 67.45 ± 36.62 | 71.98 ± 48.90 | 0.710 | 0.937 |
| Cholesterol (mg) | 339.69 ± 270.74 | 315.10 ± 268.44 | 0.768 | 0.974 | 329.84 ± 261.41 | 312.35 ± 226.97 | 0.808 | 0.487 |
| Men (n = 50) |
P-value | Women (n = 50) |
P-value | |||
|---|---|---|---|---|---|---|
| OSTEO (n = 15) | Normal (n = 35) | OSTEO (n = 30) | Normal (n = 20) | |||
| Preference | ||||||
| Black coffee | 4.00 ± 1.13 | 3.11 ± 1.55 | 0.052 | 3.00 ± 1.46 | 3.55 ± 1.32 | 0.182 |
| Café latte or cappuccino | 3.93 ± 1.10 | 2.89 ± 0.99 | 0.002 | 3.13 ± 1.22 | 3.35 ± 1.27 | 0.548 |
| Café mocha or white mocha | 3.40 ± 1.18 | 2.77 ± 0.97 | 0.056 | 2.90 ± 1.03 | 3.10 ± 1.17 | 0.526 |
| Instant coffee | 3.00 ± 1.31 | 2.91 ± 1.09 | 0.812 | 2.90 ± 1.16 | 3.10 ± 1.21 | 0.559 |
| Green or black tea | 3.73 ± 1.22 | 3.17 ± 1.15 | 0.127 | 3.90 ± 0.92 | 3.80 ± 1.11 | 0.730 |
| Total | 18.07 ± 4.23 | 14.86 ± 3.41 | 0.007 | 15.83 ± 3.71 | 16.90 ± 3.73 | 0.325 |
| Intake frequency | ||||||
| Black coffee | 2.43 ± 2.21 | 1.97 ± 2.32 | 0.516 | 1.47 ± 2.30 | 2.05 ± 2.43 | 0.394 |
| Café latte or cappuccino | 1.70 ± 2.09 | 0.77 ± 1.09 | 0.121 | 0.75 ± 1.14 | 0.40 ± 0.91 | 0.257 |
| Café mocha or white mocha | 0.67 ± 1.47 | 0.50 ± 1.08 | 0.656 | 0.20 ± 0.52 | 0.23 ± 0.55 | 0.871 |
| Instant coffee | 0.20 ± 0.53 | 0.39 ± 0.67 | 0.343 | 0.48 ± 1.00 | 0.50 ± 1.30 | 0.959 |
| Green tea or black tea | 1.40 ± 1.93 | 0.87 ± 1.73 | 0.342 | 1.00 ± 1.11 | 1.23 ± 1.77 | 0.616 |
| Total | 6.40 ± 5.37 | 4.50 ± 3.45 | 0.140 | 3.90 ± 3.14 | 4.40 ± 3.30 | 0.591 |
| Men (n = 50) |
P-value | Women (n = 50) |
P-value | |||
|---|---|---|---|---|---|---|
| OSTEO (n = 15) | Normal (n = 35) | OSTEO (n = 30) | Normal (n = 20) | |||
| Eating attitude | ||||||
| I try to eat breakfast regularly every day | 2.20 ± 1.32 | 1.83 ± 0.92 | 0.259 | 1.97 ± 1.33 | 1.70 ± 0.86 | 0.432 |
| I try to eat an adequate amount of meals | 3.60 ± 0.63 | 3.31 ± 0.83 | 0.241 | 3.43 ± 0.97 | 3.15 ± 0.88 | 0.299 |
| I try not to eat snacks from after dinner until I go to bed | 2.53 ± 1.06 | 2.71 ± 1.18 | 0.611 | 2.73 ± 1.20 | 2.50 ± 1.40 | 0.531 |
| I tend to eat slowly and leisurely | 2.87 ± 1.25 | 2.91 ± 0.92 | 0.881 | 3.47 ± 1.14 | 3.65 ± 0.99 | 0.559 |
| I try to eat evenly without unbalanced meals | 4.13 ± 0.92 | 3.60 ± 1.01 | 0.084 | 3.57 ± 0.97 | 3.75 ± 1.21 | 0.556 |
| When I eat, I think about the combination of food | 2.87 ± 1.13 | 2.43 ± 1.12 | 0.211 | 2.77 ± 1.10 | 2.30 ± 0.80 | 0.111 |
| When I purchase food, I try to check the nutrition label | 3.00 ± 0.93 | 1.77 ± 0.84 | 0.003 | 2.53 ± 1.33 | 2.35 ± 1.35 | 0.637 |
| Average | 3.03 ± 0.56 | 2.65 ± 0.49 | 0.021 | 2.92 ± 0.68 | 2.77 ± 0.48 | 0.391 |
| Eating habits | ||||||
| I eat grain at every meal | 4.53 ± 0.83 | 4.09 ± 0.92 | 0.112 | 4.10 ± 1.03 | 4.15 ± 1.09 | 0.870 |
| I eat meat at every meal | 4.00 ± 0.93 | 3.69 ± 0.90 | 0.267 | 3.73 ± 1.01 | 3.85 ± 1.14 | 0.706 |
| I eat side dishes of vegetables besides Kimchi every day | 3.73 ± 0.96 | 3.57 ± 0.95 | 0.584 | 3.40 ± 0.93 | 3.60 ± 0.75 | 0.428 |
| I eat seaweed at every meal | 2.47 ± 0.99 | 2.31 ± 0.72 | 0.544 | 2.20 ± 0.61 | 2.60 ± 0.94 | 0.103 |
| I do not eat processed food often | 2.20 ± 0.86 | 2.23 ± 0.77 | 0.908 | 2.50 ± 1.04 | 2.15 ± 1.04 | 0.250 |
| I do not eat snacks often | 3.00 ± 1.00 | 2.74 ± 0.98 | 0.402 | 2.50 ± 0.97 | 2.80 ± 1.40 | 0.375 |
| I do not eat out often | 2.13 ± 0.92 | 2.49 ± 1.04 | 0.262 | 2.37 ± 1.10 | 2.20 ± 0.95 | 0.582 |
| Average | 3.15 ± 0.41 | 3.02 ± 0.43 | 0.305 | 2.97 ± 0.45 | 3.05 ± 0.58 | 0.594 |
Table 1. Characteristics and body measurements in OSTEO and normal groups among men and women
Mean ± SD or n (%) OSTEO: osteopenia & osteoporosis, BMI: body mass index, SMM: skeletal muscle mass, BFM: body fat mass, VFA: visceral fat area, BQI: bone quality index
Table 2. Comparison of daily energy and nutrient intake between OSTEO and normal groups in men and women
Mean ± SD Energy-adjusted OSTEO: osteopenia & osteoporosis
Table 3. Comparison of preference and intake frequency of caffeinated beverages between OSTEO and normal groups in men and women
Mean ± SD Preference is scored from 1 (hate) to 5 (like very much). Frequency is scored as 7 (every day), 5.5 (5-6 times/week), 3.5 (3-4 times/week), 1.5 (1-2 times/week), and 0 (rarely). OSTEO: osteopenia & osteoporosis
Table 4. Comparison of eating attitudes and habits between OSTEO and normal groups in men and women
Mean ± SD The score ranges from 1 (strongly disagree) to 5 (strongly agree) on a Likert scale. OSTEO: osteopenia & osteoporosis


