
Articles
- Page Path
- HOME > Korean J Community Nutr > Volume 28(6); 2023 > Article
-
Research Article
커뮤니티케어 대상 노인의 NQ-E 지수 기반 개별영양상담 효과성: 복합만성질환과 삶의 질 개선에 관한 중재 연구 -
최윤정1)
 , 이지현2), 임희숙3), 박유경4),†
 - Effectiveness of NQ-E index-based individual nutrition counseling for community-care elderly: an intervention study on improving nutritional status, complex chronic diseases, and quality of life
-
Yoonjeong Choi1), Jihyun Lee2), Heesook Lim3), Yoo Kyoung Park4),†
-
Korean Journal of Community Nutrition 2023;28(6):480-494.
DOI: https://doi.org/10.5720/kjcn.2023.28.6.480
Published online: December 31, 2023
1)경희대학교 동서의학대학원 의학영양학과 고령서비스-테크 융합전공, 대학원생
2)용인시 수지노인복지관, 영양사
3)경희대학교 동서의학대학원 노인학과 고령서비스-테크 융합전공, 조교수
4)경희대학교 동서의학대학원 의학영양학과, 교수
1)Graduate Student, Dept. of Medical Nutrition (AgeTech-Service Convergence Major), Graduate School of East-West Medical Science, Kyung Hee University, Yongin, Korea
2)Dietitian, Suji Senior Welfare Center, Yongin, Korea
3)Assistant Professor, Dept. of Gerontology (AgeTech-Service Convergence Major), Graduate School of East-West Medical Science, Kyung Hee University, Yongin, Korea
4)Professor, Dept. of Medical Nutrition, Graduate School of East-West Medical Science, Kyung Hee University, Yongin, Korea
- †Corresponding author Yoo Kyoung Park Department of Medical Nutrition, Graduate School of East-West Medical Science, Kyung Hee University, Yongin 17104, Korea. Tel: +82-31-201-3816 Fax: +82-31-2013-3816 E-mail: ypark@khu.ac.kr
• Received: November 9, 2023 • Revised: December 11, 2023 • Accepted: December 29, 2023
© 2023 The Korean Society of Community Nutrition
This is an Open-Access article distributed under the terms of the Creative Commons Attribution Non-Commercial License (http://creativecommons.org/licenses/by-nc/4.0) which permits unrestricted non-commercial use, distribution, and reproduction in any medium, provided the original work is properly cited.
- 2,410 Views
- 79 Download
- 4 Crossref
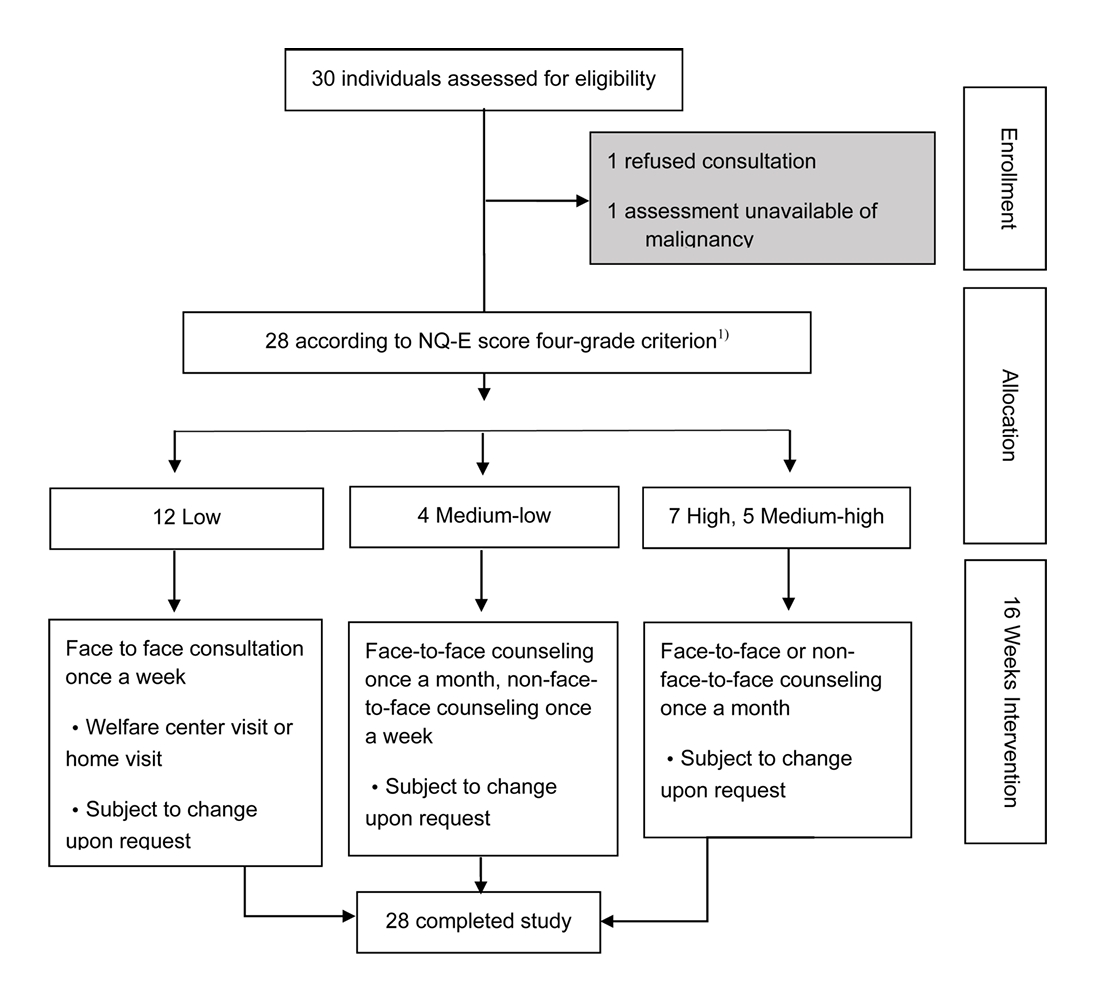
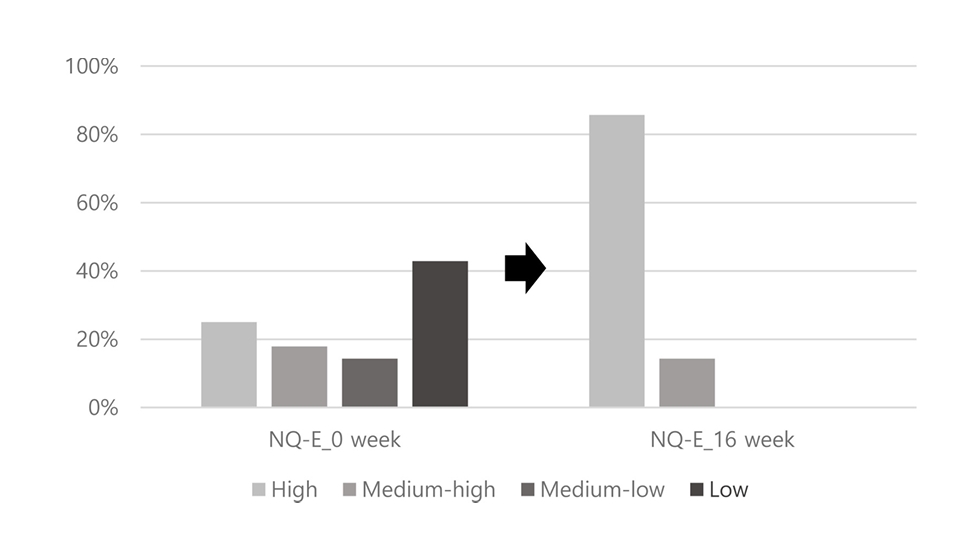
Figure & Data
REFERENCES
Citations
Citations to this article as recorded by 
- A needs assessment for the development of a digital-based self-nutrition management education program for older adults in Korea: a cross-sectional study
Hae-Song Yoo, Jin-Myung Lee, Min-Sun Jeon
Korean Journal of Community Nutrition.2026; 31(2): 178. CrossRef - Health-related Quality of Life in Multimorbid Adults: A Random Forest Cross-sectional Analysis of the Korean National Health and Nutrition Examination Survey
Moonchang You, Geun-Myun Kim
Journal of Korean Academy of psychiatric and Mental Health Nursing.2025; 34(3): 349. CrossRef - A study on the development of nutrition counseling manual and curriculum for the disabled in Korea: a mixed-methods study
Kyoung-Min Lee, Woo-jeong Kim, So-young Kim, Young-mi Park, Hwa-young Yoon, Min-Sun Jeon
Korean Journal of Community Nutrition.2025; 30(5): 376. CrossRef - A Basic Study to Establish a Nutrition Education System for Welfare Facilities for the Elderly at Home Using Body Composition Analysis and Nutritional Management Cards
Sun Hee Lee, Seung-Lim Lee
The Korean Journal of Community Living Science.2024; 35(3): 471. CrossRef
 Cite
CiteEffectiveness of NQ-E index-based individual nutrition counseling for community-care elderly: an intervention study on improving nutritional status, complex chronic diseases, and quality of life


Fig. 1. Diagram of study flow. High (75%-100% NQ-E percentile), Medium-High (50%-<75%), Medium-Low (25%-<50%), Low (0%-<25%)
Fig. 2. Changes of NQ-E score range by the grade criterion from baseline to study end in the participants (n = 28). The grade criterion is following: High (75%-100% NQ-E percentile), Medium-High (50%-<75%), Medium-Low (25%-<50%), and Low (0%-<25%). NQ-E, Nutrition Quotient for Elderly
Fig. 1.
Fig. 2.
Effectiveness of NQ-E index-based individual nutrition counseling for community-care elderly: an intervention study on improving nutritional status, complex chronic diseases, and quality of life
| Group | Session | Contents | Method |
|---|---|---|---|
| 12 Low | session 1 | Understanding Hypertension and Diabetes: A Nutrition Research-Based Guide | 1:1, Pamphlet |
| session 2 | Nutritional Strategies for Managing Complications in Hypertension and Diabetes Patients | 1:1, Pamphlet | |
| session 3 | Nutritional Guidelines for Hypertension and Diabetes Patients: Strategies for Risk Reduction and Management | 1:1, Pamphlet | |
| session 4 | Dietary Recommendations for Hypertension and Diabetes Patients: A Nutrition Research-Based Guide | 1:1, Pamphlet | |
| session 5 | Smart Grocery Shopping for Hypertension and Diabetes Patients: A Nutrition Research-Informed Guide | 1:1, Pamphlet | |
| session 6 | Food Preparation Techniques for Hypertension and Diabetes: A Research-Based Guide | 1:1, Pamphlet | |
| session 7 | Nutrition Research-Based Dietary Guidelines for Hypertension and Diabetes Patients | 1:1, Pamphlet | |
| session 8 | Dietary Management Focus for Hypertension and Diabetes Patients | 1:1, Pamphlet | |
| session 9 | Nutrition Research-Informed Meal Management Strategies for Special Situations | 1:1, Pamphlet | |
| session 10 | Nutrition Research-Based Dietary Implementation Strategies for Hypertension and Diabetes Patients | 1:1, Pamphlet | |
| 4 Medium-low, 5 Medium-high | session 1 | Understanding Hypertension and Diabetes: A Nutrition Research-Based Guide | 1:1, Pamphlet |
| session 2 | Dietary Recommendations for Hypertension and Diabetes Patients: A Nutrition Research-Based Guide | 1:1, Pamphlet | |
| session 3 | Nutrition Research-Based Dietary Guidelines for Hypertension and Diabetes Patients | 1:1, Pamphlet | |
| session 4 | Nutrition Research-Based Dietary Implementation Strategies for Hypertension and Diabetes Patients | 1:1, Pamphlet | |
| 7 High | session 1 | Understanding Hypertension and Diabetes: A Nutrition Research-Based Guide | 1:1, Pamphlet |
| session 2 | Dietary Recommendations for Hypertension and Diabetes Patients: A Nutrition Research-Based Guide | 1:1, Pamphlet | |
| session 3 | Nutrition Research-Based Dietary Guidelines for Hypertension and Diabetes Patients | 1:1, Pamphlet | |
| session 4 | Nutrition Research-Based Dietary Implementation Strategies for Hypertension and Diabetes Patients | 1:1, Pamphlet |
| Characteristics | n | % | |
|---|---|---|---|
| Gender | |||
| Male | 6 | 21.4 | |
| Female | 22 | 78.6 | |
| Age of respondents (year) | |||
| 60-69 | 4 | 14.3 | |
| 70-79 | 15 | 53.6 | |
| 80-89 | 9 | 32.1 | |
| Average age | 76.54 ± 5.28 | ||
| Weight (kg) | 62.70 ± 11.16 | ||
| Height (cm) | 158.61 ± 8.38 | ||
| BMI (kg/m2) | |||
| Underweight | 10 | 35.7 | |
| Normal |
5 | 17.9 | |
| Over weight | 9 | 32.1 | |
| Obesity | 4 | 14.2 | |
| Educational level(year) | |||
| 0-6 | 7 | 25.0 | |
| 7-12 | 19 | 67.9 | |
| > 12 | 2 | 7.1 | |
| Family members | |||
| Alone | 18 | 64.3 | |
| More than two people | 10 | 35.7 | |
| Community care target | 28 | 100.0 |
| Variables | n | % |
|---|---|---|
| Hypertension | 26 | 92.9 |
| Diabetes | 28 | 100.0 |
| Dyslipidemia | 16 | 57.14 |
| Arthritis | 19 | 67.86 |
| Cancer | 3 | 10.71 |
| Coronary artery disease | 16 | 57.14 |
| Cerebrovascular disease | 3 | 10.71 |
| Depressive disorder | 6 | 21.43 |
| Variables | n | Before | After | P-value |
|---|---|---|---|---|
| Anthropometry | ||||
| BMI (kg/m2) | 28 | 25.06 ± 4.32 | 24.76 ± 4.07 | 0.011 |
| SBP (mmHg) | 27 | 137.37 ± 15.10 | 132.19 ± 13.79 | 0.154 |
| DBP (mmHg) | 27 | 70.41±10.28 | 70.15 ± 9.02 | 0.912 |
| Handgrip Strength (kg) | 26 | 19.07 ± 6.30 | 23.74 ± 5.33 | < 0.001 |
| Laboratory Measurements | ||||
| HbA1c (%) | 24 | 6.55 ± 0.87 | 6.40 ± 0.83 | 0.010 |
| Fasting Glc. (mg/dL) | 7 | 141.33 ± 16.92 | 128.33 ± 26.35 | 0.243 |
| Postprandial Glc. (mg/dL) | 20 | 174.18 ± 64.69 | 142.47 ± 40.25 | 0.056 |
| LDL (mg/dL) | 22 | 59.05 ± 24.42 | 64.95 ± 18.69 | 0.170 |
| HDL (mg/dL) | 23 | 58.87 ± 12.42 | 58.96 ± 13.46 | 0.968 |
| Total Chol. (mg/dL) | 23 | 150.70 ± 29.58 | 152.04 ± 27.37 | 0.760 |
| Triglycerides (mg/dL) | 23 | 185.26 ± 87.87 | 148.91 ± 57.29 | 0.106 |
| AI | 22 | 1.64 ± 0.70 | 1.64 ± 0.56 | 0.990 |
| Hemoglobin (g/dL) | 23 | 13.30 ± 2.11 | 12.98 ± 2.13 | 0.593 |
| Subjects (n = 28) |
||||
|---|---|---|---|---|
| Before | After | P-value | ||
| NQ-E |
Low | 12 (42.9) | 0 (0.0) | |
| Medium | 9 (32.1) | 4 (14.3) | ||
| High | 7 (25.0) | 24 (85.7) | ||
| NQ-E score | 59.39 ± 9.66 | 70.49 ± 6.53 | < 0.001 | |
| Balance, n (%) | Low | 9 (32.1) | 0 (0.0) | |
| Medium | 10 (35.7) | 8 (28.6) | ||
| High | 9 (32.1) | 20 (71.4) | ||
| Balance score | 44.44 ± 22.70 | 65.80 ± 16.42 | < 0.001 | |
| Diversity, n (%) | Low | 16 (57.1) | 2 (7.1) | |
| Medium | 10 (35.7) | 16 (57.1) | ||
| High | 2 (7.1) | 10 (35.7) | ||
| Diversity score | 40.49 ± 14.56 | 55.77 ± 13.81 | < 0.001 | |
| Moderation, n (%) | Low | 9 (32.1) | 5 (17.9) | |
| Medium | 9 (32.1) | 12 (42.9) | ||
| High | 10 (35.7) | 11 (39.3) | ||
| Moderation score | 76.60 ± 17.73 | 80.83 ± 15.94 | 0.202 | |
| Behavior, n (%) | Low | 12 (42.9) | 0 (0.0) | |
| Medium | 12 (42.9) | 7 (25.0) | ||
| High | 4 (14.3) | 21 (75.0) | ||
| Behavior score | 51.43 ± 11.92 | 73.06 ± 9.96 | < 0.001 | |
| Subjects (n = 28) |
|||
|---|---|---|---|
| Before | After | P-value | |
| NSI score | 10.86 ± 2.09 | 3.89 ± 0.96 | < 0.001 |
| One meal a day, n (%) | |||
| Yes | 2 (7.1) | 0 (0.0) | |
| No | 26 (92.9) | 28 (100.0) | |
| Excessive alcohol consumption, n (%) | |||
| Yes | 1 (3.6) | 0 (0.0) | |
| No | 27 (96.4) | 28 (100.0) | |
| Eating alone, n (%) | |||
| Yes | 20 (71.4) | 17 (60.7) | |
| No | 8 (28.6) | 11 (39.3) | |
| Multiple medication use, n (%) | |||
| Yes | 28 (100.0) | 24 (85.7) | |
| No | 0 (0.0) | 4 (14.3) | |
| Unintended weight change, n (%) | |||
| Yes | 13 (46.4) | 1 (3.6) | |
| No | 15 (53.6) | 27 (96.4) | |
| Subjects (n = 28) |
|||
|---|---|---|---|
| Before | After | ||
| NSI Score |
Low risk | 0 (0.0) | 0 (0.0) |
| Moderate risk | 0 (0.0) | 25 (89.3) | |
| High risk | 28 (100.0) | 3 (10.7) | |
| Subjects (n = 28) |
|||
|---|---|---|---|
| Before | After | P-value | |
| SF total score |
59.17 ± 11.83 | 86.38 ± 15.00 | < 0.001 |
| Physical Functioning (PF) | 41.93 ± 5.37 | 43.70 ± 3.62 | 0.094 |
| Role-Physical (RP) | 44.00 ± 5.05 | 49.50 ± 1.01 | < 0.001 |
| Bodily Pain (BP) | 49.50 ± 4.38 | 49.35 ± 2.75 | 0.881 |
| General Health (GH) | 55.21 ± 5.56 | 47.40 ± 3.45 | < 0.001 |
| Vitality (VT) | 50.32 ± 4.42 | 51.93 ± 2.05 | 0.085 |
| Social Functioning (SF) | 45.64 ± 2.98 | 49.58 ± 1.78 | < 0.001 |
| Role-Emotional (RE) | 47.61 ± 3.73 | 50.57 ± 1.57 | 0.001 |
| Mental Health (MH) | 54.11 ± 7.35 | 52.28 ± 2.15 | 0.195 |
Table 1. A comprehensive nutrition intervention program for study subjects
The nutrition education materials were edited and used with permission from the Korea Health Promotion Institute, tailored specifically for the elderly population.
Table 2. General characteristics of study subjects (n = 28)
Mean ± SD Underweight: ≤ 18.49 kg/m2, Normal: 18.5-22.99 kg/m2, Overweight: 23-24.99 kg/m2, Obesity: ≥ 25 kg/m2 BMI, Body mass index
Table 3. Chronic disease history by subject (n = 28)
Multiple responses were permitted, allowing for the assessment of subjects' diverse chronic disease histories.
Table 4. Changes of anthropometry and laboratory measurements from baseline to study end in the participants
Mean ± SD SBP, Systolic Blood Pressure; DBP, Diastolic Blood Pressure; LDL, Low-Density Lipoprotein; HDL, High-Density Lipoprotein; AI, Atherogenic Index
Table 5. Changes of the level and scores of NQ-E from baseline to study end in the participants
Mean ± SD NQ-E grade: Low (≥63.5), Medium (51.9-63.4), High (≤51.8) NQ-E, Nutrition Quotient for Elderly
Table 6. Changes in NSI1) checklist results (nutritional risk assessment) before and after the study of research subjects
Mean ± SD NSI, Nutritional Screening Initiative
Table 7. Changes in nutritional score of subjects using the NSI checklist before and after the study
Nutritional Risk Assessment Using the NSI Checklist: Low risk (≤2), Moderate risk (3-5), High risk (≥6)
Table 8. Changes in quality of Life (measured using SF-36K1) health survey) of subjects before and after the study
Mean ± SD Short Form 36-item Health Survey, Korean version Standardized SF-36 scores obtained through scientific calculations, allowing for simplified comparisons across dimensions and individuals in the study.


