
Articles
- Page Path
- HOME > Korean J Community Nutr > Volume 29(4); 2024 > Article
-
Research Article
- Sex differences in health-related quality of life among older Korean adults with type 2 diabetes mellitus: a cross-sectional study
-
Hyeonji Jeong1)
 , Kyong Park2),†
 -
Korean Journal of Community Nutrition 2024;29(4):336-347.
DOI: https://doi.org/10.5720/kjcn.2024.00003
Published online: August 31, 2024
1)Graduate Student, Department of Food and Nutrition, Yeungnam University, Gyeongsan, Korea
2)Professor, Department of Food and Nutrition, Yeungnam University, Gyeongsan, Korea
- †Corresponding author: Kyong Park Department of Food and Nutrition, Yeungnam University, 280 Daehak-ro, Gyeongsan 38541, Korea Tel: +82-53-810-2879 Fax: +82-53-810-4666 Email: kypark@ynu.ac.kr
• Received: May 13, 2024 • Revised: June 14, 2024 • Accepted: June 25, 2024
© 2024 The Korean Society of Community Nutrition
This is an Open-Access article distributed under the terms of the Creative Commons Attribution Non-Commercial License (http://creativecommons.org/licenses/by-nc/4.0) which permits unrestricted non-commercial use, distribution, and reproduction in any medium, provided the original work is properly cited.
- 3,734 Views
- 46 Download
- 2 Crossref


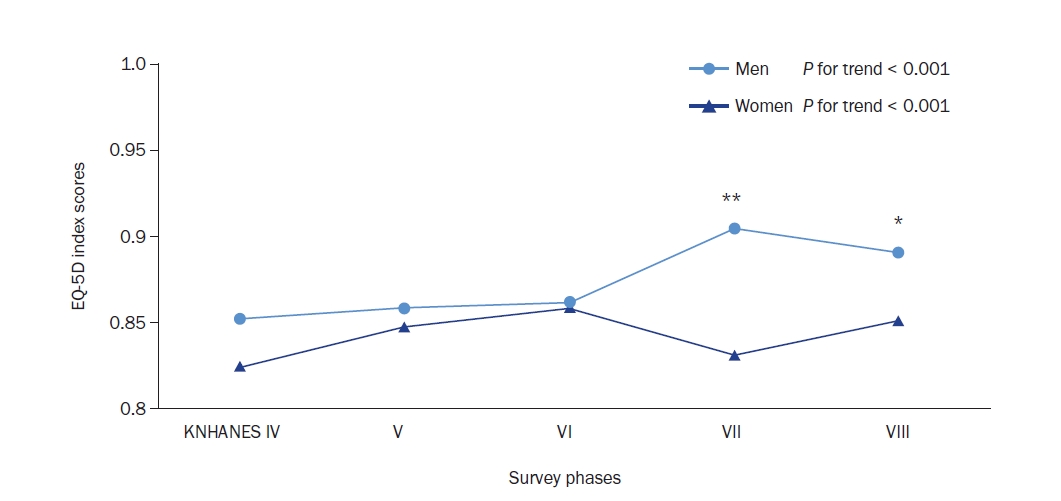
Figure & Data
REFERENCES
Citations
Citations to this article as recorded by 
- Sex Differences in Failure to Achieve Geriatric-Adjusted Glycemic Targets Among Older Adults with Type 2 Diabetes in Vietnam
Thanh Le, Phuc Le, Vien Bang, Huan Nguyen
Diabetes, Metabolic Syndrome and Obesity.2026; Volume 19: 1. CrossRef - Understanding Gender Disparities in Quality of Life Among Patients With Type 2 Diabetes in Ethiopia: An Institutional‐Based Study
Enguday Demeke Gebeyaw, Girma Deshimo Lema
Lifestyle Medicine.2025;[Epub] CrossRef
 Cite
Cite- Figure
-
- We recommend
- Related articles
-
- Sugar intake from processed foods among Koreans and levy on excessive sugar use: a cross-sectional study
- Sex differences in the association between Korean Healthy Eating Index and type 2 diabetes mellitus in Korean adults: a prospective cohort study
- Associations between diet quality and regional factors in Korea vary according to individuals’ characteristics: a cross-sectional study
- Comparison of clinical characteristics and dietary intakes according to phenotypes of type 2 diabetes mellitus in South Korea: a cross-sectional study
- Relationship between self-care and health-related behaviors among Korean adults: a cross-sectional study
Sex differences in health-related quality of life among older Korean adults with type 2 diabetes mellitus: a cross-sectional study
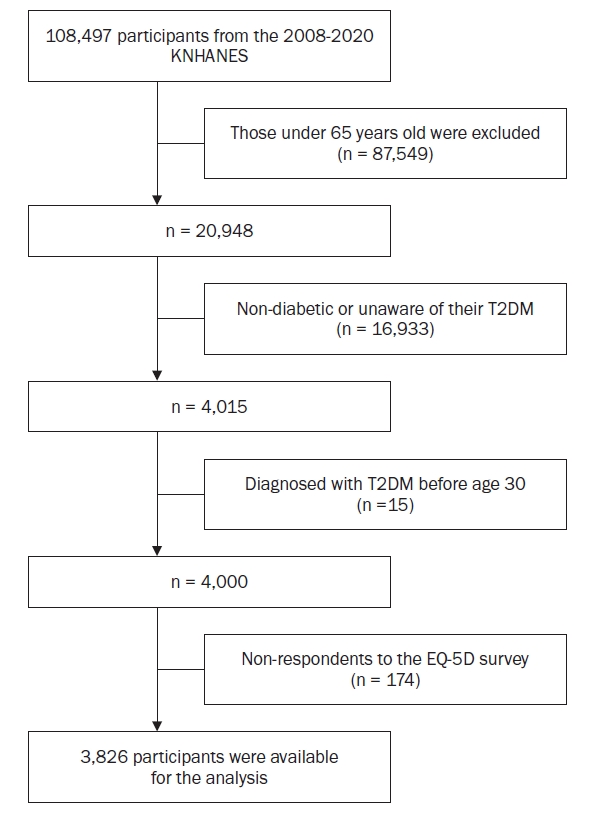
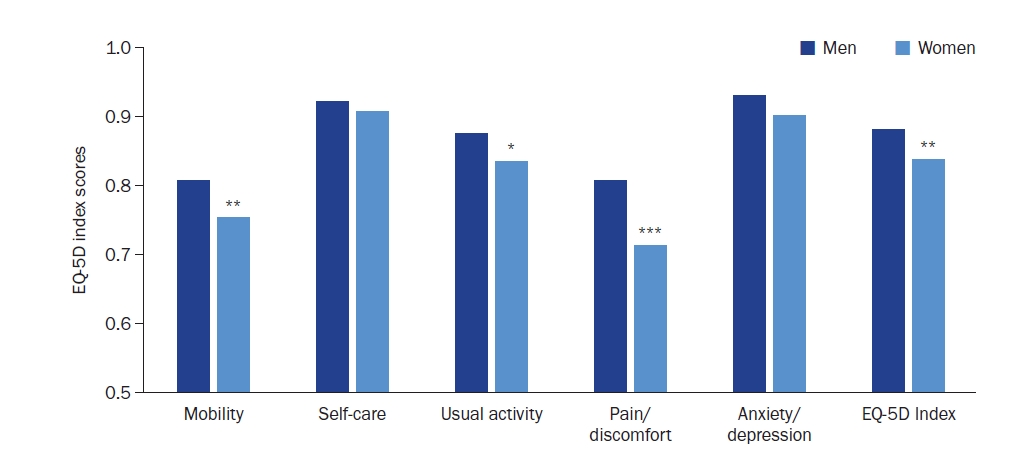

Fig. 1. Flow chart showing participant inclusion and exclusion stepsKNHANES, Korea National Health and Nutrition Examination Survey; T2DM, Type 2 Diabetes Mellitus; EQ-5D, EuroQol-5 Dimensions.
Fig. 2. EQ-5D domains and index scores of participants by sex.Values are adjusted for age, body mass index, physical activity, education level, monthly household income, smoking status and alcohol consumption.EQ-5D, EuroQol-5 Dimensions.*P < 0.05, **P < 0.01, ***P < 0.001 by multivariable linear regression analysis between men and women.
Fig. 3. Sex-specific trends in the EQ-5D Index scores across survey phases (KNHANES IV–VII).
Values are adjusted for age, body mass index, physical activity, education level, monthly household income, smoking status and alcohol consumption.KNHANES, Korea National Health and Nutrition Examination Survey; EQ-5D, EuroQol-5 Dimensions.*P < 0.05, **P < 0.01, indicates significance for sex differences, and P for trend represents significance in linear trends, both assessed by multivariable linear regression analysis.
Fig. 1.
Fig. 2.
Fig. 3.
Sex differences in health-related quality of life among older Korean adults with type 2 diabetes mellitus: a cross-sectional study
| KNHANES (2008–2020) | Men (n = 1,653) | Women (n = 2,173) | P-value | |
|---|---|---|---|---|
| Age (years) | 71.89 ± 0.12 | 73.17 ± 0.10 | < 0.001 | |
| Education level | < 0.001 | |||
| Elementary school graduation or less | 646 (39.32) | 217 (10.05) | ||
| Middle school graduation | 318 (19.35) | 217 (80.78) | ||
| High school graduation or higher | 679 (41.33) | 198 (9.17) | ||
| Monthly household income (KRW) | < 0.001 | |||
| < 1,000,000 | 616 (37.60) | 1,130 (52.93) | ||
| 1,000,000 to < 2,000,000 | 407 (24.85) | 392 (18.36) | ||
| ≥ 2,000,000 | 615 (37.55) | 613 (28.71) | ||
| Employed, yes | 599 (36.39) | 469 (21.70) | < 0.001 | |
| Living status, alone | 194 (11.74) | 690 (31.75) | < 0.001 | |
| Smoking status | < 0.001 | |||
| Non-smoker | 287 (17.46) | 1,951 (91.04) | ||
| Former smoker | 998 (60.70) | 111 (5.18) | ||
| Current smoker | 359 (21.84) | 81 (3.78) | ||
| Diabetes care | 0.065 | |||
| Non-care | 136 (8.23) | 154 (7.09) | ||
| Oral hypoglycemic agents/insulin treatments | 1,268 (76.71) | 1,735 (79.84) | ||
| Diet/exercise or oral agents/insulin treatments combination | 249 (15.06) | 284 (13.07) | ||
| Diabetes duration (year) | 0.836 | |||
| < 5 | 489 (29.76) | 650 (30.29) | ||
| 5–9 | 357 (21.73) | 476 (22.18) | ||
| ≥ 10 | 797 (48.51) | 1,020 (47.53) | ||
| No. of comorbidities1 | < 0.001 | |||
| 0 | 316 (19.12) | 308 (14.17) | ||
| 1 | 666 (40.29) | 863 (39.71) | ||
| 2 | 471 (28.49) | 746 (34.33) | ||
| ≥ 3 | 200 (12.10) | 256 (11.79) | ||
| Alcohol consumption (serving/day) | 0.92 ± 0.03 | 0.07 ± 0.02 | < 0.001 | |
| Body mass index (kg/m2) | 24.16 ± 0.08 | 25.06 ± 0.07 | < 0.001 | |
| Physical activity level (METs-h/week) | 26.78 ± 0.93 | 17.25 ± 0.81 | < 0.001 |
| KNHANES (2008–2020) | Number of comorbidities |
P for trend | |||
|---|---|---|---|---|---|
| 0 | 1 | 2 | ≥ 3 | ||
| Men | |||||
| Mobility | 1 | 1.08 (0.74–1.58) | 1.72 (1.17–2.52) | 1.94 (1.22–3.09) | < 0.001 |
| Self-care | 1 | 1.59 (0.90–2.80) | 2.55 (1.42–4.57) | 2.49 (1.27–4.88) | < 0.001 |
| Usual activity | 1 | 1.78 (0.94–2.31) | 2.74 (1.71–4.39) | 3.64 (2.15–6.18) | < 0.001 |
| Pain/discomfort | 1 | 0.90 (0.63–1.28) | 1.30 (0.88–1.93) | 1.71 (1.08–2.70) | 0.005 |
| Anxiety/depression | 1 | 1.16 (0.71–1.87) | 1.77 (1.03–3.03) | 1.75 (0.96–3.19) | 0.010 |
| Women | |||||
| Mobility | 1 | 0.74 (0.53–1.03) | 0.83 (0.59–1.17) | 1.04 (0.68–1.60) | 0.595 |
| Self-care | 1 | 0.60 (0.40–0.91) | 0.74 (0.5–1.14) | 1.04 (1.62–1.74) | 0.574 |
| Usual activity | 1 | 0.81 (0.56–1.16) | 1.01 (0.70–1.44) | 1.72 (1.11–2.66) | 0.006 |
| Pain/discomfort | 1 | 0.88 (0.64–1.23) | 1.27 (0.91–1.77) | 1.90 (1.24–2.92) | < 0.001 |
| Anxiety/depression | 1 | 1.13 (0.74–1.74) | 1.35 (0.88–2.10) | 1.74 (1.05–2.90) | 0.015 |
| KNHANES (2008–2020) | EQ-5D Index score |
P for trend | ||
|---|---|---|---|---|
| T1 (lowest) | T2 | T3 (highest) | ||
| Food group (% of total energy) | ||||
| Men | ||||
| Refined grains | 55.50 ± 1.03 | 50.10 ± 1.03 | 49.68 ± 0.73 | < 0.001 |
| Whole grains | 1.73 ± 0.24 | 2.18 ± 0.42 | 1.53 ± 0.20 | 0.480 |
| Potatoes and starches | 1.65 ± 0.25 | 1.54 ± 0.23 | 2.02 ± 0.19 | 0.230 |
| Legumes | 3.67 ± 0.30 | 3.85 ± 0.34 | 3.85 ± 0.20 | 0.607 |
| Eggs | 1.39 ± 0.17 | 1.71 ± 0.26 | 1.39 ± 0.11 | 0.947 |
| Meat | 5.68 ± 0.50 | 6.05 ± 0.65 | 5.74 ± 0.33 | 0.894 |
| Fish and shellfish | 2.89 ± 0.24 | 3.10 ± 0.30 | 3.44 ± 0.27 | 0.320 |
| Nuts | 1.01 ± 0.16 | 1.42 ± 0.22 | 1.32 ± 0.13 | 0.196 |
| Fruits | 3.88 ± 0.39 | 4.36 ± 0.35 | 4.44 ± 0.24 | 0.462 |
| Vegetables | 4.88 ± 0.24 | 5.00 ± 0.25 | 5.20 ± 0.16 | 0.252 |
| Kimchi and pickled vegetables | 2.06 ± 0.11 | 2.21 ± 0.14 | 2.05 ± 0.08 | 0.909 |
| Dairy | 1.64 ± 0.19 | 1.59 ± 0.24 | 2.20 ± 0.19 | 0.092 |
| Women | ||||
| Refined grains | 58.07 ± 0.88 | 54.43 ± 0.96 | 53.44 ± 0.85 | < 0.001 |
| Whole grains | 2.98 ± 0.32 | 1.92 ± 0.24 | 2.22 ± 0.28 | 0.074 |
| Potatoes and starches | 2.84 ± 0.32 | 3.04 ± 0.35 | 2.98 ± 0.33 | 0.759 |
| Legumes | 4.45 ± 0.32 | 3.96 ± 0.29 | 3.83 ± 0.23 | 0.118 |
| Eggs | 1.11 ± 0.16 | 1.15 ± 0.15 | 1.51 ± 0.15 | 0.072 |
| Meat | 3.27 ± 0.28 | 3.74 ± 0.30 | 4.40 ± 0.36 | 0.014 |
| Fish and shellfish | 1.88 ± 0.19 | 2.50 ± 0.21 | 1.97 ± 0.14 | 0.664 |
| Nuts | 0.75 ± 0.09 | 1.17 ± 0.17 | 1.35 ± 0.14 | < 0.001 |
| Fruits | 4.47 ± 0.20 | 5.47 ± 0.22 | 5.70 ± 0.20 | 0.697 |
| Vegetables | 4.35 ± 0.18 | 5.41 ± 0.21 | 5.59 ± 0.19 | < 0.001 |
| Kimchi and pickled vegetables | 1.78 ± 0.10 | 1.81 ± 0.10 | 1.84 ± 0.10 | 0.633 |
| Dairy | 3.13 ± 0.32 | 2.71 ± 0.26 | 2.66 ± 0.23 | 0.220 |
Table 1. Demographic and lifestyle characteristics of participants by sex
Educational level: 23 missing values, Monthly household income: 53 missing values, Employed: 19 missing values, Smoking status: 39 missing values, Diabetes duration: 37 missing values, Alcohol consumption: 37 missing values, Body mass index: 28 missing values, Physical activity level: 16 missing values. KNHANES, Korea National Health and Nutrition Examination Survey; KRW, Korea Republic Won; METs-h/week, metabolic equivalent task-hours per week. Comorbidities included hypertension, dyslipidemia, stroke, myocardial infarction/angina, renal failure, and cancer.
Table 2. Odds ratios and 95% confidence intervals for low Health-Related Quality of Life according to the number of comorbidities1, analyzed separately for men and women
Values are adjusted for age, body mass index, physical activity, education level, monthly household income, smoking status, and alcohol consumption. KNHANES, Korea National Health and Nutrition Examination Survey. Comorbidities included hypertension, dyslipidemia, stroke, myocardial infarction/angina, renal failure, and cancer.
Table 3. Food group consumption by EQ-5D Index score tertiles and sex
Mean ± SE. EQ-5D, EuroQol-5 Dimensions; KNHANES, Korea National Health and Nutrition Examination Survey; T, tertile.


