
Articles
- Page Path
- HOME > Korean J Community Nutr > Volume 29(4); 2024 > Article
-
Research Article
- Effects of a nutrition education program on metabolic syndrome risk factors in middle-aged Korean adults: an intervention study
-
Minji Kang1)
 , Young-Hee Park2), Subeen Kim3), Eunyoung Tak3), Hyun Wook Baik4), Hee Young Paik5), Hyojee Joung6),†
 -
Korean Journal of Community Nutrition 2024;29(4):265-277.
DOI: https://doi.org/10.5720/kjcn.2024.00005
Published online: August 31, 2024
1)Assistant Professor, Department of Food and Nutrition, Duksung Women’s University, Seoul, Korea
2)Senior Researcher, Department of Agrofood Resources, National Institue of Agricultural Sciences, Rural Development Administration, Wanju, Korea
3)Master’s Student, Department of Food and Nutrition, Duksung Women’s University, Seoul, Korea
4)Director, Department of Health Promotion, National Center for Mental Health, Seoul, Korea
5)Professor Emeritus, Department of Food and Nutrition, Seoul National University, Seoul, Korea
6)Professor, Graduate School of Public Health, Seoul National University, Seoul, Korea
- †Corresponding author: Hyojee Joung Graduate School of Public Health, Seoul National University, 1 Gwanak-ro, Gwanak-gu, Seoul 08826, Korea Tel: +82-2-880-2736 Fax: +82-2-883-2832 Email: hjjoung@snu.ac.kr
• Received: April 23, 2024 • Revised: July 2, 2024 • Accepted: July 22, 2024
© 2024 The Korean Society of Community Nutrition
This is an Open-Access article distributed under the terms of the Creative Commons Attribution Non-Commercial License (http://creativecommons.org/licenses/by-nc/4.0) which permits unrestricted non-commercial use, distribution, and reproduction in any medium, provided the original work is properly cited.
- 5,204 Views
- 97 Download
- 1 Crossref
Abstract
-
Objectives
- This study was conducted to evaluate the effects of a nutrition education program on metabolic syndrome in middle-aged Korean adults.
-
Methods
- A total of 411 Korean adults 30–59 years of age were allocated randomly into three groups: the nutrition education group for promoting Han-sik consumption (HG), the nutrition education group for eating balanced diet (EG), and the control group (CG). The HG and EG received four face-to-face nutrition education sessions over 16 weeks to improve nutritional problems based on the individual’ usual diet. Effectiveness of the program was evaluated with the differences of self-reported dietary behaviors, dietary intakes, anthropometric measurements and biochemical indices between the baseline and the end of the nutrition education program. The changes within groups were analyzed using paired t-test and McNemar test and effectiveness among three groups was analyzed by repeated analysis of variance.
-
Results
- After the nutrition education, the percentages of participants who achieved the recommended food group consumption in the Korean Food Guidance Systems significantly increased in HG (P = 0.022). Body weight (P = 0.007), body mass index (P = 0.002), and triglycerides (P = 0.002) significantly decreased in HG. Waist circumference and diastolic blood pressure decreased in all three groups (P < 0.05).
-
Conclusions
- This study found that tailored nutrition education program for middle aged Korean adults showed beneficial effects on improving dietary behaviors and metabolic syndrome risk factors. Further studies are needed to assess the long-term effects of the nutrition education programs on metabolic syndrome risks.
INTRODUCTION
METHODS
1) First session - Setting dietary goals
2) Remaining sessions - Tailored nutrition education
1) Dietary behaviors
2) Dietary intake
3) Anthropometric and biochemical measurements
4) Sociodemographic and lifestyle factors
RESULTS
DISCUSSION
CONCLUSIONS
-
Conflict of Interest
There are no financial or other issues that might lead to conflict of interest.
-
Funding
This work is carried out with the support of ‘Cooperative Research Program for Agricultural Science and Technology Development’, National Academy of Agricultural Science, Rural Development Administration, Republic of Korea (Projects No. PJ007211).
-
Data Availability
Data sharing is not applicable.
NOTES
Fig. 1.
Flow of the study process.
CG, control group with no intervention; HG, the nutrition education group for promoting the Han-sik consumption; EG, the nutrition education group for balanced diet.
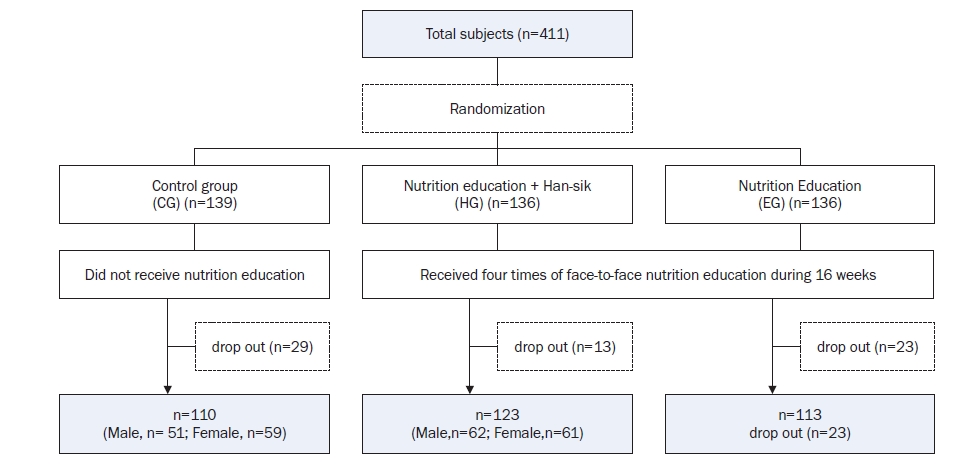
Fig. 2.
Example of menu planning and presentation of single-serving sizes per meal for representative foods from both groups.
HG, the nutrition education group for promoting Han-sik consumption; EG, the nutrition education group for balanced diet.
Reproduced from Kang et al. (Korean J Nutr 2012; 2024-08-2645(6):552-561) [18].
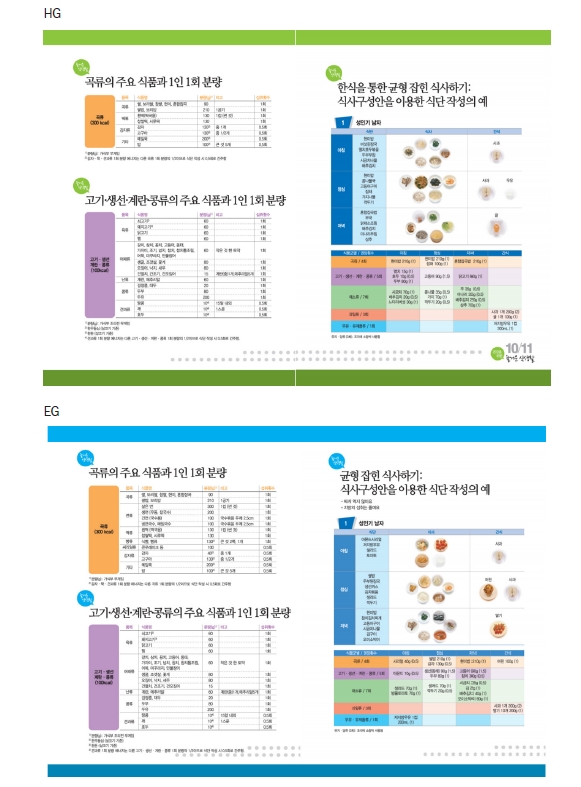
Fig. 3.
The changes of prevalence of metabolic syndrome and its factors among three groups after nutrition education.
CG, control group with no intervention; HG, the nutrition education group for promoting the Han-sik consumption; EG, the nutrition education group for balanced diet; MS, metabolic syndrome; FBS, fasting blood glucose; BP, blood pressure; HDL-c, high-density lipoprotein-cholesterol; TG, triglyceride; WC, waist circumference.
MS, those who had three or more of the following five components; FBS (impaired blood glucose), fasting blood glucose ≥ 100 mg/dL; BP (elevated blood pressure) ≥ 130/85 mmHg; HDL-c (low HDL-cholesterol) < 50 mg/dL for women < 40 mg/dL for men; TG (hypertriglyceridemia) ≥ 150 mg/dL; WC (abdominal obesity) ≥ 85 cm for women ≥ 90 cm for men.
*P < 0.05, **P < 0.01, ***P < 0.001.

Table 1.Baseline characteristics of participants in three groups
| CG (n = 110) | HG (n = 123) | EG (n = 113) | P-value1) | |
|---|---|---|---|---|
| Age (year) | 46.2 ± 7.9 | 45.6 ± 7.7 | 47.8 ± 7.3 | 0.083 |
| Sex | ||||
| Men | 51 (46.4) | 62 (50.4) | 55 (48.7) | 0.827 |
| Women | 59 (53.6) | 61 (49.6) | 58 (51.3) | |
| Smoking status | ||||
| Never smoked | 62 (56.4) | 67 (54.5) | 61 (54.0) | 0.832 |
| Former smoking | 25 (22.7) | 33 (26.8) | 25 (22.1) | |
| Currently smoking | 23 (20.9) | 23 (18.7) | 27 (23.9) | |
| Alcohol intake at one time | ||||
| Do not drink | 8 (7.3) | 12 (9.8) | 8 (7.1) | 0.927 |
| 1–2 glasses | 38 (34.5) | 37 (30.1) | 38 (33.6) | |
| 3–6 glasses | 31 (28.2) | 41 (33.3) | 33 (29.2) | |
| 7 glasses and more | 33 (30.0) | 33 (26.8) | 34 (30.1) | |
| Physical activity | ||||
| Regular2) | 23 (20.9) | 23 (18.7) | 22 (19.5) | 0.913 |
| Dietary supplement use | ||||
| User | 50 (45.5) | 53 (43.1) | 48 (42.5) | 0.894 |
| Metabolic syndrome3) | 66 (60.0) | 64 (52.0) | 63 (55.8) | 0.474 |
| Metabolic syndrome components4) | ||||
| Impaired blood glucose | 47 (42.7) | 53 (43.1) | 56 (49.6) | 0.507 |
| Elevated blood pressure | 77 (70.0) | 89 (72.4) | 93 (82.3) | 0.078 |
| Low HDL-cholesterol | 47 (42.7) | 43 (35.0) | 35 (31.0) | 0.178 |
| Hypertriglyceridemia | 77 (70.0) | 66 (53.7) | 54 (47.8) | 0.002 |
| Abdominal obesity | 75 (68.2) | 87 (70.7) | 72 (63.7) | 0.510 |
Mean ± SD or n (%).
CG, control group with no intervention; HG, the nutrition education group for promoting the Han-sik consumption; EG, the nutrition education group for balanced diet; HDL, high-density lipoprotein.
1)P from chi-square test in categorical variables and ANOVA in continuous variables (duncan’s grouping).
2)Moderate physical activity of at least 30 min at a time for 5 or more days per week or intense physical activity of at least 20 min at a time of 3 or more days per week.
3)Metabolic syndrome, those who had three or more of the following five components.
4)Impaired blood glucose (fasting blood glucose ≥ 100 mg/dL), elevated blood pressure (≥ 130/85 mmHg), low HDL-cholesterol (< 50 mg/dL for women, < 40 mg/dL for men), hypertriglyceridemia (≥ 150 mg/dL), and abdominal obesity (waist circumference ≥ 85 cm for women, ≥ 90 cm for men).
Table 2.Self-reported changes in dietary behaviors during nutrition education1)
|
CG (n = 110) |
HG (n = 123) |
EG (n = 113) |
P3) | ||||||||||
|---|---|---|---|---|---|---|---|---|---|---|---|---|---|
| Before | After | Difference | P2) | Before | After | Difference | P2) | Before | After | Difference | P2) | ||
| Adequate intake of various whole grains | 3.2 ± 0.9 | 3.4 ± 0.9 | 0.2 ± 1.0 | 0.107 | 3.1 ± 1.0 | 3.2 ± 0.8 | 0.1 ± 1.0 | 0.129 | 3.2 ± 1.0 | 3.4 ± 0.9 | 0.2 ± 0.9 | 0.010 | 0.749 |
| Adequate intake of green/orange vegetables | 3.0 ± 0.8 | 3.0 ± 0.9 | 0.1 ± 0.9 | 0.460 | 2.6 ± 0.8 | 2.9 ± 0.7 | 0.3 ± 0.8 | 0.001 | 2.8 ± 0.9 | 3.0 ± 0.7 | 0.2 ± 0.9 | 0.019 | 0.242 |
| Adequate intake of fruits | 2.9 ± 0.9 | 3.0 ± 0.9 | 0.1 ± 0.9 | 0.534 | 3.0 ± 0.8 | 3.1 ± 0.8 | 0.1 ± 0.9 | 0.289 | 3.1 ± 0.9 | 3.1 ± 0.8 | 0.0 ± 1.0 | 0.844 | 0.672 |
| Adequate intake of milk and dairy products | 2.6 ± 1.0 | 2.7 ± 1.0 | 0.1 ± 1.1 | 0.335 | 2.6 ± 1.2 | 3.1 ± 0.9 | 0.5 ± 1.2 | < 0.0001 | 2.6 ± 1.0 | 3.1 ± 0.9 | 0.5 ± 1.0 | < 0.0001 | 0.005 |
| Regular intake of three meals a day | 3.0 ± 1.1 | 3.2 ± 1.0 | 0.2 ± 0.8 | 0.008 | 3.0 ± 1.2 | 3.3 ± 1.0 | 0.3 ± 0.9 | 0.001 | 3.0 ± 1.0 | 3.5 ± 1.0 | 0.5 ± 0.8 | < 0.0001 | 0.042 |
| Meals are composed of variety of side-dishes | 3.0 ± 0.8 | 3.0 ± 0.8 | 0.1 ± 0.8 | 0.247 | 3.0 ± 0.9 | 3.0 ± 0.8 | 0.1 ± 0.9 | 0.412 | 2.9 ± 0.8 | 3.2 ± 0.7 | 0.3 ± 0.8 | 0.0002 | 0.082 |
| Appropriate caloric intake needed for energy balance | 3.0 ± 0.9 | 3.2 ± 0.9 | 0.2 ± 1.0 | 0.044 | 3.2 ± 1.0 | 3.2 ± 0.8 | 0.1 ± 1.0 | 0.441 | 3.0 ± 0.9 | 3.2 ± 0.8 | 0.2 ± 1.1 | 0.082 | 0.633 |
| Do not add extra salt or soy sauce | 3.5 ± 0.9 | 3.5 ± 1.0 | 0.1 ± 1.0 | 0.516 | 3.4 ± 1.0 | 3.6 ± 0.9 | 0.2 ± 1.1 | 0.023 | 3.3 ± 1.0 | 3.6 ± 0.9 | 0.3 ± 1.1 | 0.012 | 0.317 |
| Make Kimchi as low salty | 2.9 ± 0.8 | 3.1 ± 0.8 | 0.1 ± 0.9 | 0.085 | 2.9 ± 0.8 | 3.1 ± 0.8 | 0.2 ± 0.7 | 0.003 | 3.0 ± 1.0 | 3.3 ± 0.7 | 0.3 ± 0.9 | 0.0002 | 0.324 |
| Eat less fatty meat | 3.1 ± 1.1 | 3.3 ± 1.1 | 0.2 ± 0.9 | 0.043 | 3.0 ± 1.1 | 3.3 ± 1.0 | 0.3 ± 0.9 | < 0.0001 | 3.2 ± 1.0 | 3.5 ± 0.9 | 0.4 ± 0.9 | < 0.0001 | 0.286 |
| Eat less fried foods | 3.4 ± 1.0 | 3.5 ± 0.9 | 0.1 ± 0.9 | 0.326 | 3.2 ± 1.0 | 3.6 ± 0.9 | 0.4 ± 0.9 | < 0.0001 | 3.2 ± 1.0 | 3.6 ± 0.8 | 0.4 ± 0.9 | < 0.0001 | 0.009 |
| Reduce the amount of oil when cooking | 3.3 ± 0.8 | 3.4 ± 0.8 | 0.1 ± 0.8 | 0.181 | 3.1 ± 0.9 | 3.5 ± 0.7 | 0.4 ± 0.7 | < 0.0001 | 3.2 ± 0.8 | 3.6 ± 0.7 | 0.4 ± 0.8 | < 0.0001 | 0.011 |
Mean ± SD.
CG, control group; HG, the education to increase Han-sik consumption group; EG, the education to promote a balanced diet group.
1)The score was answered as follows keeping the guideline: always = 5, frequently = 4, modestly = 3, seldom = 2, never = 1.
2)P from paired t-test in each three groups.
3)P from repeated ANOVA, group-by-time.
Table 3.The changes of nutrients and food group intakes among three groups after nutrition education
| CG (n = 110) | HG (n = 123) | EG (n = 113) | P2) | ||||||||||
|---|---|---|---|---|---|---|---|---|---|---|---|---|---|
| Before | After | Difference | P1) | Before | After | Difference | P1) | Before | After | Difference | P1) | ||
| Nutrient intakes | |||||||||||||
| Energy (kcal) | 1,789.1 ± 569.5 | 1,683.3 ± 555.0 | –105.8 ± 575.4 | 0.164 | 1,802.0 ± 605.1 | 1,686.9 ± 475.6 | –115.1 ± 608.8 | 0.099 | 1,752.7 ± 516.1 | 1,582.7 ± 356.3 | –170.0 ± 471.5 | 0.004 | 0.644 |
| Carbohydrate (g) | 258.5 ± 91.3 | 239.0 ± 71.0 | –19.5 ± 83.7 | 0.079 | 260.4 ± 83.6 | 249.7 ± 68.7 | –10.7 ± 84.5 | 0.276 | 255.8 ± 67.4 | 238.6 ± 54.2 | –17.2 ± 62.6 | 0.035 | 0.662 |
| Protein (g) | 68.2 ± 25.7 | 63.5 ± 26.1 | –4.7 ± 26.4 | 0.182 | 69.6 ± 27.3 | 68.1 ± 26.4 | –1.5 ± 32.3 | 0.656 | 66.5 ± 27.0 | 61.8 ± 18.5 | –4.7 ± 28.3 | 0.124 | 0.625 |
| Fat (g) | 41.8 ± 18.6 | 40.0 ± 21.5 | –1.8 ± 25.1 | 0.515 | 44.0 ± 20.8 | 40.0 ± 17.4 | –4.0 ± 22.4 | 0.104 | 43.0 ± 19.7 | 35.8 ± 14.3 | –7.2 ± 22.0 | 0.002 | 0.218 |
| % CHO | 61.9 ± 8.2 | 61.7 ± 9.1 | –0.1 ± 10.3 | 0.914 | 61.2 ± 8.6 | 61.7 ± 7.5 | 0.5 ± 10.5 | 0.613 | 61.8 ± 7.9 | 62.8 ± 7.3 | 0.9 ± 9.9 | 0.350 | 0.733 |
| % protein | 16.2 ± 3.5 | 16.1 ± 3.7 | –0.1 ± 4.3 | 0.796 | 16.2 ± 4.2 | 16.6 ± 3.6 | 0.3 ± 5.2 | 0.508 | 15.7 ± 3.4 | 16.3 ± 3.7 | 0.6 ± 4.6 | 0.204 | 0.509 |
| % lipid | 21.9 ± 6.4 | 22.2 ± 7.4 | 0.3 ± 8.9 | 0.788 | 22.6 ± 6.4 | 21.7 ± 6.3 | –0.8 ± 7.8 | 0.292 | 22.5 ± 6.4 | 21.0 ± 6.1 | –1.6 ± 8.1 | 0.064 | 0.260 |
| Dietary fiber (g) | 22.8 ± 8.4 | 22.3 ± 9.2 | –0.5 ± 7.8 | 0.645 | 23.9 ± 9.8 | 22.6 ± 8.7 | –1.4 ± 11.5 | 0.253 | 23.9 ± 9.2 | 23.3 ± 8.4 | –0.6 ± 9.2 | 0.590 | 0.780 |
| Sodium (g) | 3.5 ± 1.4 | 3.2 ± 1.3 | –0.3 ± 1.4 | 0.158 | 3.5 ± 1.5 | 3.2 ± 1.0 | –0.3 ± 1.6 | 0.094 | 3.6 ± 1.7 | 3.1 ± 1.0 | –0.5 ± 1.5 | 0.011 | 0.505 |
| Cholesterol (mg) | 160.9 ± 96.0 | 155.0 ± 108.3 | –5.9 ± 130.3 | 0.670 | 171.1 ± 106.2 | 160.9 ± 95.4 | –10.1 ± 137.9 | 0.432 | 166.8 ± 104.8 | 143.8 ± 93.3 | –22.9 ± 145.8 | 0.084 | 0.630 |
| % Han-sik intake3) | 77.5 ± 13.1 | 77.9 ± 12.7 | 0.3 ± 11.8 | 0.762 | 76.1 ± 12.0 | 77.2 ± 11.3 | 1.1 ± 12.4 | 0.311 | 76.0 ± 11.0 | 76.4 ± 13.5 | 0.4 ± 12.2 | 0.743 | 0.850 |
| Adherence score to the Korean Food Guidance System4) | |||||||||||||
| Grains (%) | 82.3 ± 35.9 | 73.6 ± 27.5 | –8.8 ± 33.1 | 0.007 | 80.3 ± 28.4 | 78.6 ± 24.5 | –1.7 ± 28.0 | 0.507 | 77.8 ± 24.7 | 73.3 ± 21.0 | –4.5 ± 23.3 | 0.044 | 0.162 |
| Meat·fish·eggs·beans (%) | 93.8 ± 43.4 | 83.1 ± 44.7 | –10.7 ± 52.7 | 0.035 | 93.4 ± 50.6 | 84.0 ± 45.1 | –9.4 ± 60.0 | 0.085 | 88.9 ± 47.2 | 82.7 ± 37.0 | –6.2 ± 55.6 | 0.238 | 0.827 |
| Vegetables (%) | 94.3 ± 45.1 | 94.8 ± 44.7 | 0.5 ± 47.2 | 0.912 | 98.8 ± 47.1 | 106.8 ± 124.4 | 7.9 ± 135.4 | 0.517 | 100.6 ± 51.3 | 87.3 ± 33.9 | –13.2 ± 46.0 | 0.003 | 0.184 |
| Fruits (%) | 57.3 ± 53.9 | 56.9 ± 70.2 | –0.4 ± 68.7 | 0.954 | 56.9 ± 56.0 | 49.3 ± 48.2 | –7.6 ± 61.1 | 0.169 | 68.0 ± 71.7 | 62.6 ± 63.0 | –5.4 ± 74.4 | 0.442 | 0.711 |
| Milk·dairy products (%) | 44.0 ± 64.2 | 44.3 ± 54.5 | 0.3 ± 68.0 | 0.966 | 51.0 ± 74.6 | 73.6 ± 60.2 | 22.6 ± 76.1 | 0.001 | 55.2 ± 66.4 | 55.4 ± 45.9 | 0.1 ± 71.9 | 0.983 | 0.023 |
| Oils·fats·sugars (%) | 123.6 ± 71.5 | 108.3 ± 71.7 | –15.3 ± 70.8 | 0.025 | 133.6 ± 70.8 | 102.1 ± 65.6 | –31.5 ± 68.5 | < 0.0001 | 124.0 ± 64.6 | 93.7 ± 51.7 | –30.3 ± 68.3 | < 0.0001 | 0.149 |
| Overall5) | 42 (38.2) | 30 (27.3) | –12 (–10.9) | 0.0706) | 40 (32.5) | 57 (46.3) | 17 (13.8) | 0.0226) | 44 (38.9) | 57 (50.4) | 13 (11.5) | 0.0586) | 0.0017) |
Mean ± SD or n (%).
CG, control group with no intervention; HG, the nutrition education group for promoting the Han-sik consumption; EG, the nutrition education group for balanced diet; CHO, carbohydrate.
1)P from paired t-test in each three groups.
2)P from repeated ANOVA, group-by-time.
3)The percentage of Han-sik items of all consumed dish items using Han-sik database.
4)Adherence score to the Korean Food Guidance System (KFGS) was defined as the percentage of consumed daily servings from each food groups to the recommended servings of the KFGS for each age group by sex.
5)The number of participants whose intakes of food group meet three or more in the KFGS: 80% ≤ the adherence score of ‘grains’ and ‘meat, fish, eggs, beans’ < 120%, 80% ≤ the adherence score of ‘vegetables’, ‘fruits’, and ‘milk, dairy products’, and the adherence score of ‘oils, fats, sugars’ < 120%.
6)P from McNemar test.
7)P from chi-square test at the end of the nutrition education program.
Table 4.The changes in anthropometric and serum biochemistry among three groups after nutrition education
|
CG (n = 110) |
HG (n = 123) |
EG (n = 113) |
P2) | ||||||||||
|---|---|---|---|---|---|---|---|---|---|---|---|---|---|
| Before | After | Difference | P1) | Before | After | Difference | P1) | Before | After | Difference | P1) | ||
| Anthropometry | |||||||||||||
| Weight (kg) | 72.4 ± 12.5 | 72.0 ± 12.5 | –0.3 ± 2.6 | 0.204 | 72.7 ± 13.0 | 72.2 ± 12.7 | –0.5 ± 2.1 | 0.007 | 69.7 ± 11.6 | 69.8 ± 11.5 | 0.1 ± 1.7 | 0.592 | 0.097 |
| Body mass index (kg/m2) | 26.7 ± 3.6 | 26.6 ± 3.7 | –0.2 ± 0.9 | 0.080 | 26.3 ± 2.9 | 26.1 ± 2.7 | –0.2 ± 0.8 | 0.002 | 25.9 ± 2.8 | 25.9 ± 2.9 | 0.0 ± 0.7 | 0.929 | 0.084 |
| Waist circumference (cm) | 90.3 ± 9.0 | 89.1 ± 8.9 | –1.3 ± 2.8 | < 0.0001 | 89.4 ± 8.0 | 88.0 ± 7.7 | –1.3 ± 2.2 | < 0.0001 | 88.4 ± 7.1 | 86.8 ± 6.6 | –1.6 ± 2.8 | < 0.0001 | 0.632 |
| Lipid profile | |||||||||||||
| HDL cholesterol (mg/dL) | 48.5 ± 11.7 | 48.9 ± 11.1 | 0.4 ± 7.6 | 0.600 | 51.6 ± 12.1 | 51.3 ± 12.4 | –0.2 ± 8.5 | 0.751 | 50.9 ± 10.9 | 49.2 ± 10.4 | –1.7 ± 8.3 | 0.037 | 0.162 |
| LDL cholesterol (mg/dL) | 130.3 ± 33.7 | 131.7 ± 34.9 | 1.4 ± 22.5 | 0.515 | 134.0 ± 40.9 | 132.4 ± 32.1 | –1.6 ± 35.7 | 0.618 | 126.1 ± 33.4 | 126.9 ± 34.2 | 0.7 ± 28.6 | 0.785 | 0.715 |
| Triglycerides (mg/dL) | 219.1 ± 144.0 | 204.9 ± 152.8 | –14.2 ± 139.8 | 0.290 | 175.0 ± 95.0 | 153.4 ± 75.8 | –21.6 ± 76.2 | 0.002 | 182.6 ± 123.7 | 183.3 ± 121.9 | 0.7 ± 103.1 | 0.943 | 0.281 |
| Blood pressure | |||||||||||||
| Systolic blood pressure (mmHg) | 133.2 ± 18.1 | 132.4 ± 17.9 | –0.8 ± 14.6 | 0.553 | 132.9 ± 17.1 | 129.5 ± 17.2 | –3.4 ± 15.3 | 0.016 | 135.8 ± 16.4 | 130.8 ± 16.0 | –5.0 ± 14.3 | < 0.0001 | 0.106 |
| Diastolic blood pressure (mmHg) | 89.0 ± 12.0 | 86.9 ± 11.8 | –2.2 ± 11.1 | 0.044 | 86.6 ± 12.3 | 84.0 ± 11.7 | –2.6 ± 10.9 | 0.009 | 89.1 ± 11.3 | 84.8 ± 12.2 | –4.3 ± 10.4 | < 0.0001 | 0.277 |
| Glucose homeostasis | |||||||||||||
| Fasting blood glucose (mg/dL) | 101.4 ± 17.1 | 100.8 ± 17.6 | –0.6 ± 10.2 | 0.539 | 101.7 ± 18.6 | 100.7 ± 14.3 | –1.0 ± 10.5 | 0.289 | 102.4 ± 14.9 | 103.3 ± 19.2 | 1.0 ± 9.9 | 0.296 | 0.297 |
| Insulin (μU/mL) | 8.3 ± 7.6 | 8.5 ± 6.5 | 0.3 ± 9.1 | 0.753 | 7.5 ± 4.1 | 8.3 ± 7.3 | 0.8 ± 6.7 | 0.170 | 7.5 ± 7.0 | 8.0 ± 5.5 | 0.6 ± 8.8 | 0.488 | 0.873 |
| HbA1c (%) | 5.7 ± 0.8 | 5.6 ± 0.7 | 0.0 ± 0.3 | 0.189 | 5.6 ± 0.7 | 5.6 ± 0.6 | 0.0 ± 0.3 | 0.404 | 5.7 ± 0.6 | 5.7 ± 0.6 | 0.0 ± 0.3 | 0.403 | 0.256 |
Mean ± SD.
CG, control group with no intervention; HG, the nutrition education group for promoting the Han-sik consumption; EG, the nutrition education group for balanced diet, HDL, high-density lipoprotein; LDL, low-density lipoprotein; HbA1c, hemoglobin A1c.
1)P from paired t-test in each three groups.
2)P from repeated ANOVA, group-by-time.
- 1. National Cholesterol Education Program (NCEP) Expert Panel on Detection, Evaluation, and Treatment of High Blood Cholesterol in Adults (Adult Treatment Panel III). Third Report of the National Cholesterol Education Program (NCEP) Expert Panel on Detection, Evaluation, and Treatment of High Blood Cholesterol in Adults (Adult Treatment Panel III) final report. Circulation 2002; 106(25): 3143-3421.ArticlePubMed
- 2. Grundy SM, Cleeman JI, Daniels SR, Donato KA, Eckel RH, Franklin BA, et al.; American Heart Association; National Heart, Lung, and Blood Institute. Diagnosis and management of the metabolic syndrome: an American Heart Association/National Heart, Lung, and Blood Institute scientific statement. Circulation 2005; 112(17): 2735-2752.ArticlePubMed
- 3. Huh JH, Kang DR, Kim JY, Koh KK; on behalf of the Taskforce Team of the Metabolic Syndrome Fact Sheet of the Korean Society of Cardiometabolic Syndrome. Metabolic syndrome fact sheet 2021: executive report. Cardiometab Syndr J 2021; 1(2): 125-134.ArticleLink
- 4. Ham D, Cho Y, Park MS, Park YS, Kim SY, Seol HM, et al. Inverse association of improved adherence to dietary guidelines with metabolic syndrome: the Seoul Metabolic Syndrome Management program. Nutr Res Pract 2020; 14(6): 621-636.ArticlePubMedPMCLink
- 5. Thuita AW, Kiage BN, Onyango AN, Makokha AO. Effect of a nutrition education programme on the metabolic syndrome in type 2 diabetes mellitus patients at a level 5 Hospital in Kenya: “a randomized controlled trial”. BMC Nutr 2020; 6: 30.ArticlePubMedPMCPDF
- 6. Tejera C, Porca C, Rodriguez-Carnero G, Andújar P, Casanueva FF, Bellido D, et al. Reducing metabolic syndrome through a group educational intervention program in adults with obesity: IGOBE program. Nutrients 2022; 14(5): 1066.ArticlePubMedPMC
- 7. Eyles HC, Mhurchu CN. Does tailoring make a difference? A systematic review of the long-term effectiveness of tailored nutrition education for adults. Nutr Rev 2009; 67(8): 464-480.ArticlePubMed
- 8. Kim SH, Kim MS, Lee MS, Park YS, Lee HJ, Kang S, et al. Korean diet: characteristics and historical background. J Ethn Foods 2016; 3(1): 26-31.Article
- 9. Kwon DY, Kim SH, Chung KR, Daily JW, Park S. Science and philosophy of Korea traditional foods (K-food). J Ethn Food 2023; 10: 26.ArticlePDF
- 10. Moon HJ, Cha YS. Sustainability of K-Food: focused on the change in the health values of K-Food. J Ethn Food 2023; 10: 23.ArticlePDF
- 11. Schroeder N, Park YH, Kang MS, Kim Y, Ha GK, Kim HR, et al. A randomized trial on the effects of 2010 Dietary Guidelines for Americans and Korean diet patterns on cardiovascular risk factors in overweight and obese adults. J Acad Nutr Diet 2015; 115(7): 1083-1092.ArticlePubMed
- 12. Cena H, Calder PC. Defining a healthy diet: evidence for the role of contemporary dietary patterns in health and disease. Nutrients 2020; 12(2): 334.ArticlePubMedPMC
- 13. Anderssen SA, Carroll S, Urdal P, Holme I. Combined diet and exercise intervention reverses the metabolic syndrome in middle-aged males: results from the Oslo Diet and Exercise Study. Scand J Med Sci Sports 2007; 17(6): 687-695.ArticlePubMed
- 14. Lindahl B, Nilssön TK, Borch-Johnsen K, Røder ME, Söderberg S, Widman L, et al. A randomized lifestyle intervention with 5-year follow-up in subjects with impaired glucose tolerance: pronounced short-term impact but long-term adherence problems. Scand J Public Health 2009; 37(4): 434-442.ArticlePubMedLink
- 15. Faul F, Erdfelder E, Lang AG, Buchner A. G*Power 3: a flexible statistical power analysis program for the social, behavioral, and biomedical sciences. Behav Res Methods 2007; 39(2): 175-191.ArticlePubMedPDF
- 16. Faul F, Erdfelder E, Buchner A, Lang AG. Statistical power analyses using G*Power 3.1: tests for correlation and regression analyses. Behav Res Methods 2009; 41(4): 1149-1160.ArticlePubMedPDF
- 17. Lee S, Park HS, Kim SM, Kwon HS, Kim DY, Kim DJ, et al. Cut-off points of waist circumference for defining abdominal obesity in the Korean population. Korean J Obes 2006; 15(1): 1-9.
- 18. Kang M, Paik HY, Wie GA, Joung H. Development of healthy Han-sik nutrition education program featuring consumption of Korean foods for prevention of metabolic syndrome in Korean adults. Korean J Nutr 2012; 45(6): 552-561.Article
- 19. Kang M, Jung HJ, Joung H, Shim JE, Lee SE, Park YH, et al. Development of Han-sik database utilizing an expert focus group and assessment of Han-sik effects on diet quality. J Korean Soc Food Cult 2014; 29(1): 9-17.Article
- 20. The Korean Nutrition Society. Dietary reference intakes for Koreans. 1st revision. The Korean Nutrition Society; 2010.
- 21. Jung HJ, Han SN, Song S, Paik HY, Baik HW, Joung H. Association between adherence to the Korean Food Guidance System and the risk of metabolic abnormalities in Koreans. Nutr Res Pract 2011; 5(6): 560-568.ArticlePubMedPMC
- 22. Hoyas I, Leon-Sanz M. Nutritional challenges in metabolic syndrome. J Clin Med 2019; 8(9): 1301.ArticlePubMedPMC
- 23. Park D, Shin MJ, Després JP, Eckel RH, Tuomilehto J, Lim S. 20-year trends in metabolic syndrome among Korean adults from 2001 to 2020. JACC Asia 2023; 3(3): 491-502.ArticlePubMedPMC
- 24. Kwon HT, Lee CM, Park JH, Ko JA, Seong EJ, Park MS, et al. Milk intake and its association with metabolic syndrome in Korean: analysis of the third Korea National Health and Nutrition Examination Survey (KNHANES III). J Korean Med Sci 2010; 25(10): 1473-1479.ArticlePubMedPMC
- 25. Lee CJ, Joung H. Milk intake is associated with metabolic syndrome - using data from the Korea National Health and Nutrition Examination Survey 2007-2010. Korean J Community Nutr 2012; 17(6): 795-804.Article
- 26. Kim J. Dairy food consumption is inversely associated with the risk of the metabolic syndrome in Korean adults. J Hum Nutr Diet 2013; 26 Suppl 1: 171-179.ArticlePubMedLink
- 27. Elwood PC, Pickering JE, Fehily AM. Milk and dairy consumption, diabetes and the metabolic syndrome: the Caerphilly prospective study. J Epidemiol Community Health 2007; 61(8): 695-698.ArticlePubMedPMC
- 28. Beydoun MA, Gary TL, Caballero BH, Lawrence RS, Cheskin LJ, Wang Y. Ethnic differences in dairy and related nutrient consumption among US adults and their association with obesity, central obesity, and the metabolic syndrome. Am J Clin Nutr 2008; 87(6): 1914-1925.ArticlePubMedPMC
- 29. Azadbakht L, Mirmiran P, Esmaillzadeh A, Azizi F. Dairy consumption is inversely associated with the prevalence of the metabolic syndrome in Tehranian adults. Am J Clin Nutr 2005; 82(3): 523-530.ArticlePubMed
- 30. Shin PK, Kim MS, Park SJ, Kwon DY, Kim MJ, Yang HJ, et al. A traditional Korean diet alters the expression of circulating microRNAs linked to diabetes mellitus in a pilot trial. Nutrients 2020; 12(9): 2558.ArticlePubMedPMC
- 31. Hur YI. Study of Korean food and obesity related to metabolic diseases. Food Ind Nutr 2011; 16(2): 34-44.
REFERENCES
Figure & Data
REFERENCES
Citations
Citations to this article as recorded by 
- Multicomponent intervention increases nutrition knowledge scores in rural China
Zhifan He, Ming Feng, Lu Li, Jing Li, Xiaohui Li
Scientific Reports.2025;[Epub] CrossRef
 Cite
Cite- Figure
-
- We recommend
- Related articles
-
- Development and applicability evaluation of a nutrition education program for residents and users of disability social welfare facilities in Korea: a mixed-methods study
- Impact of a public health center nutrition education program on patients with type 2 diabetes in a primary care-based chronic disease management project: a pilot intervention study
Effects of a nutrition education program on metabolic syndrome risk factors in middle-aged Korean adults: an intervention study


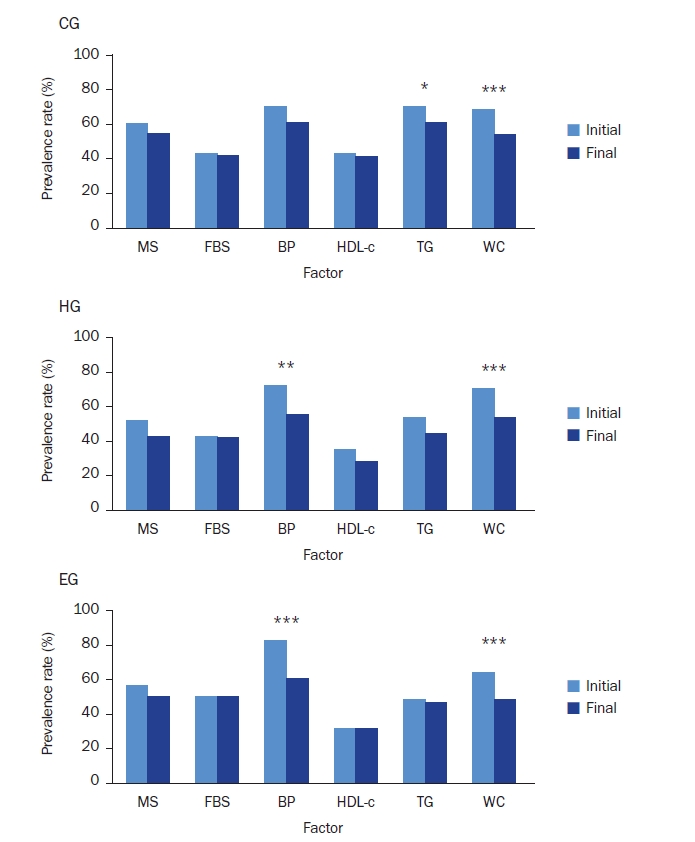
Fig. 1. Flow of the study process.CG, control group with no intervention; HG, the nutrition education group for promoting the Han-sik consumption; EG, the nutrition education group for balanced diet.
Fig. 2. Example of menu planning and presentation of single-serving sizes per meal for representative foods from both groups.HG, the nutrition education group for promoting Han-sik consumption; EG, the nutrition education group for balanced diet.Reproduced from Kang et al. (Korean J Nutr 2012; 2024-08-2645(6):552-561) [18].
Fig. 3. The changes of prevalence of metabolic syndrome and its factors among three groups after nutrition education.CG, control group with no intervention; HG, the nutrition education group for promoting the Han-sik consumption; EG, the nutrition education group for balanced diet; MS, metabolic syndrome; FBS, fasting blood glucose; BP, blood pressure; HDL-c, high-density lipoprotein-cholesterol; TG, triglyceride; WC, waist circumference.MS, those who had three or more of the following five components; FBS (impaired blood glucose), fasting blood glucose ≥ 100 mg/dL; BP (elevated blood pressure) ≥ 130/85 mmHg; HDL-c (low HDL-cholesterol) < 50 mg/dL for women < 40 mg/dL for men; TG (hypertriglyceridemia) ≥ 150 mg/dL; WC (abdominal obesity) ≥ 85 cm for women ≥ 90 cm for men.*P < 0.05, **P < 0.01, ***P < 0.001.
Fig. 1.
Fig. 2.
Fig. 3.
Effects of a nutrition education program on metabolic syndrome risk factors in middle-aged Korean adults: an intervention study
| CG (n = 110) | HG (n = 123) | EG (n = 113) | P-value |
|
|---|---|---|---|---|
| Age (year) | 46.2 ± 7.9 | 45.6 ± 7.7 | 47.8 ± 7.3 | 0.083 |
| Sex | ||||
| Men | 51 (46.4) | 62 (50.4) | 55 (48.7) | 0.827 |
| Women | 59 (53.6) | 61 (49.6) | 58 (51.3) | |
| Smoking status | ||||
| Never smoked | 62 (56.4) | 67 (54.5) | 61 (54.0) | 0.832 |
| Former smoking | 25 (22.7) | 33 (26.8) | 25 (22.1) | |
| Currently smoking | 23 (20.9) | 23 (18.7) | 27 (23.9) | |
| Alcohol intake at one time | ||||
| Do not drink | 8 (7.3) | 12 (9.8) | 8 (7.1) | 0.927 |
| 1–2 glasses | 38 (34.5) | 37 (30.1) | 38 (33.6) | |
| 3–6 glasses | 31 (28.2) | 41 (33.3) | 33 (29.2) | |
| 7 glasses and more | 33 (30.0) | 33 (26.8) | 34 (30.1) | |
| Physical activity | ||||
| Regular |
23 (20.9) | 23 (18.7) | 22 (19.5) | 0.913 |
| Dietary supplement use | ||||
| User | 50 (45.5) | 53 (43.1) | 48 (42.5) | 0.894 |
| Metabolic syndrome |
66 (60.0) | 64 (52.0) | 63 (55.8) | 0.474 |
| Metabolic syndrome components |
||||
| Impaired blood glucose | 47 (42.7) | 53 (43.1) | 56 (49.6) | 0.507 |
| Elevated blood pressure | 77 (70.0) | 89 (72.4) | 93 (82.3) | 0.078 |
| Low HDL-cholesterol | 47 (42.7) | 43 (35.0) | 35 (31.0) | 0.178 |
| Hypertriglyceridemia | 77 (70.0) | 66 (53.7) | 54 (47.8) | 0.002 |
| Abdominal obesity | 75 (68.2) | 87 (70.7) | 72 (63.7) | 0.510 |
| CG (n = 110) |
HG (n = 123) |
EG (n = 113) |
P |
||||||||||
|---|---|---|---|---|---|---|---|---|---|---|---|---|---|
| Before | After | Difference | P |
Before | After | Difference | P |
Before | After | Difference | P |
||
| Adequate intake of various whole grains | 3.2 ± 0.9 | 3.4 ± 0.9 | 0.2 ± 1.0 | 0.107 | 3.1 ± 1.0 | 3.2 ± 0.8 | 0.1 ± 1.0 | 0.129 | 3.2 ± 1.0 | 3.4 ± 0.9 | 0.2 ± 0.9 | 0.010 | 0.749 |
| Adequate intake of green/orange vegetables | 3.0 ± 0.8 | 3.0 ± 0.9 | 0.1 ± 0.9 | 0.460 | 2.6 ± 0.8 | 2.9 ± 0.7 | 0.3 ± 0.8 | 0.001 | 2.8 ± 0.9 | 3.0 ± 0.7 | 0.2 ± 0.9 | 0.019 | 0.242 |
| Adequate intake of fruits | 2.9 ± 0.9 | 3.0 ± 0.9 | 0.1 ± 0.9 | 0.534 | 3.0 ± 0.8 | 3.1 ± 0.8 | 0.1 ± 0.9 | 0.289 | 3.1 ± 0.9 | 3.1 ± 0.8 | 0.0 ± 1.0 | 0.844 | 0.672 |
| Adequate intake of milk and dairy products | 2.6 ± 1.0 | 2.7 ± 1.0 | 0.1 ± 1.1 | 0.335 | 2.6 ± 1.2 | 3.1 ± 0.9 | 0.5 ± 1.2 | < 0.0001 | 2.6 ± 1.0 | 3.1 ± 0.9 | 0.5 ± 1.0 | < 0.0001 | 0.005 |
| Regular intake of three meals a day | 3.0 ± 1.1 | 3.2 ± 1.0 | 0.2 ± 0.8 | 0.008 | 3.0 ± 1.2 | 3.3 ± 1.0 | 0.3 ± 0.9 | 0.001 | 3.0 ± 1.0 | 3.5 ± 1.0 | 0.5 ± 0.8 | < 0.0001 | 0.042 |
| Meals are composed of variety of side-dishes | 3.0 ± 0.8 | 3.0 ± 0.8 | 0.1 ± 0.8 | 0.247 | 3.0 ± 0.9 | 3.0 ± 0.8 | 0.1 ± 0.9 | 0.412 | 2.9 ± 0.8 | 3.2 ± 0.7 | 0.3 ± 0.8 | 0.0002 | 0.082 |
| Appropriate caloric intake needed for energy balance | 3.0 ± 0.9 | 3.2 ± 0.9 | 0.2 ± 1.0 | 0.044 | 3.2 ± 1.0 | 3.2 ± 0.8 | 0.1 ± 1.0 | 0.441 | 3.0 ± 0.9 | 3.2 ± 0.8 | 0.2 ± 1.1 | 0.082 | 0.633 |
| Do not add extra salt or soy sauce | 3.5 ± 0.9 | 3.5 ± 1.0 | 0.1 ± 1.0 | 0.516 | 3.4 ± 1.0 | 3.6 ± 0.9 | 0.2 ± 1.1 | 0.023 | 3.3 ± 1.0 | 3.6 ± 0.9 | 0.3 ± 1.1 | 0.012 | 0.317 |
| Make Kimchi as low salty | 2.9 ± 0.8 | 3.1 ± 0.8 | 0.1 ± 0.9 | 0.085 | 2.9 ± 0.8 | 3.1 ± 0.8 | 0.2 ± 0.7 | 0.003 | 3.0 ± 1.0 | 3.3 ± 0.7 | 0.3 ± 0.9 | 0.0002 | 0.324 |
| Eat less fatty meat | 3.1 ± 1.1 | 3.3 ± 1.1 | 0.2 ± 0.9 | 0.043 | 3.0 ± 1.1 | 3.3 ± 1.0 | 0.3 ± 0.9 | < 0.0001 | 3.2 ± 1.0 | 3.5 ± 0.9 | 0.4 ± 0.9 | < 0.0001 | 0.286 |
| Eat less fried foods | 3.4 ± 1.0 | 3.5 ± 0.9 | 0.1 ± 0.9 | 0.326 | 3.2 ± 1.0 | 3.6 ± 0.9 | 0.4 ± 0.9 | < 0.0001 | 3.2 ± 1.0 | 3.6 ± 0.8 | 0.4 ± 0.9 | < 0.0001 | 0.009 |
| Reduce the amount of oil when cooking | 3.3 ± 0.8 | 3.4 ± 0.8 | 0.1 ± 0.8 | 0.181 | 3.1 ± 0.9 | 3.5 ± 0.7 | 0.4 ± 0.7 | < 0.0001 | 3.2 ± 0.8 | 3.6 ± 0.7 | 0.4 ± 0.8 | < 0.0001 | 0.011 |
| CG (n = 110) | HG (n = 123) | EG (n = 113) | P |
||||||||||
|---|---|---|---|---|---|---|---|---|---|---|---|---|---|
| Before | After | Difference | P |
Before | After | Difference | P |
Before | After | Difference | P |
||
| Nutrient intakes | |||||||||||||
| Energy (kcal) | 1,789.1 ± 569.5 | 1,683.3 ± 555.0 | –105.8 ± 575.4 | 0.164 | 1,802.0 ± 605.1 | 1,686.9 ± 475.6 | –115.1 ± 608.8 | 0.099 | 1,752.7 ± 516.1 | 1,582.7 ± 356.3 | –170.0 ± 471.5 | 0.004 | 0.644 |
| Carbohydrate (g) | 258.5 ± 91.3 | 239.0 ± 71.0 | –19.5 ± 83.7 | 0.079 | 260.4 ± 83.6 | 249.7 ± 68.7 | –10.7 ± 84.5 | 0.276 | 255.8 ± 67.4 | 238.6 ± 54.2 | –17.2 ± 62.6 | 0.035 | 0.662 |
| Protein (g) | 68.2 ± 25.7 | 63.5 ± 26.1 | –4.7 ± 26.4 | 0.182 | 69.6 ± 27.3 | 68.1 ± 26.4 | –1.5 ± 32.3 | 0.656 | 66.5 ± 27.0 | 61.8 ± 18.5 | –4.7 ± 28.3 | 0.124 | 0.625 |
| Fat (g) | 41.8 ± 18.6 | 40.0 ± 21.5 | –1.8 ± 25.1 | 0.515 | 44.0 ± 20.8 | 40.0 ± 17.4 | –4.0 ± 22.4 | 0.104 | 43.0 ± 19.7 | 35.8 ± 14.3 | –7.2 ± 22.0 | 0.002 | 0.218 |
| % CHO | 61.9 ± 8.2 | 61.7 ± 9.1 | –0.1 ± 10.3 | 0.914 | 61.2 ± 8.6 | 61.7 ± 7.5 | 0.5 ± 10.5 | 0.613 | 61.8 ± 7.9 | 62.8 ± 7.3 | 0.9 ± 9.9 | 0.350 | 0.733 |
| % protein | 16.2 ± 3.5 | 16.1 ± 3.7 | –0.1 ± 4.3 | 0.796 | 16.2 ± 4.2 | 16.6 ± 3.6 | 0.3 ± 5.2 | 0.508 | 15.7 ± 3.4 | 16.3 ± 3.7 | 0.6 ± 4.6 | 0.204 | 0.509 |
| % lipid | 21.9 ± 6.4 | 22.2 ± 7.4 | 0.3 ± 8.9 | 0.788 | 22.6 ± 6.4 | 21.7 ± 6.3 | –0.8 ± 7.8 | 0.292 | 22.5 ± 6.4 | 21.0 ± 6.1 | –1.6 ± 8.1 | 0.064 | 0.260 |
| Dietary fiber (g) | 22.8 ± 8.4 | 22.3 ± 9.2 | –0.5 ± 7.8 | 0.645 | 23.9 ± 9.8 | 22.6 ± 8.7 | –1.4 ± 11.5 | 0.253 | 23.9 ± 9.2 | 23.3 ± 8.4 | –0.6 ± 9.2 | 0.590 | 0.780 |
| Sodium (g) | 3.5 ± 1.4 | 3.2 ± 1.3 | –0.3 ± 1.4 | 0.158 | 3.5 ± 1.5 | 3.2 ± 1.0 | –0.3 ± 1.6 | 0.094 | 3.6 ± 1.7 | 3.1 ± 1.0 | –0.5 ± 1.5 | 0.011 | 0.505 |
| Cholesterol (mg) | 160.9 ± 96.0 | 155.0 ± 108.3 | –5.9 ± 130.3 | 0.670 | 171.1 ± 106.2 | 160.9 ± 95.4 | –10.1 ± 137.9 | 0.432 | 166.8 ± 104.8 | 143.8 ± 93.3 | –22.9 ± 145.8 | 0.084 | 0.630 |
| % Han-sik intake |
77.5 ± 13.1 | 77.9 ± 12.7 | 0.3 ± 11.8 | 0.762 | 76.1 ± 12.0 | 77.2 ± 11.3 | 1.1 ± 12.4 | 0.311 | 76.0 ± 11.0 | 76.4 ± 13.5 | 0.4 ± 12.2 | 0.743 | 0.850 |
| Adherence score to the Korean Food Guidance System |
|||||||||||||
| Grains (%) | 82.3 ± 35.9 | 73.6 ± 27.5 | –8.8 ± 33.1 | 0.007 | 80.3 ± 28.4 | 78.6 ± 24.5 | –1.7 ± 28.0 | 0.507 | 77.8 ± 24.7 | 73.3 ± 21.0 | –4.5 ± 23.3 | 0.044 | 0.162 |
| Meat·fish·eggs·beans (%) | 93.8 ± 43.4 | 83.1 ± 44.7 | –10.7 ± 52.7 | 0.035 | 93.4 ± 50.6 | 84.0 ± 45.1 | –9.4 ± 60.0 | 0.085 | 88.9 ± 47.2 | 82.7 ± 37.0 | –6.2 ± 55.6 | 0.238 | 0.827 |
| Vegetables (%) | 94.3 ± 45.1 | 94.8 ± 44.7 | 0.5 ± 47.2 | 0.912 | 98.8 ± 47.1 | 106.8 ± 124.4 | 7.9 ± 135.4 | 0.517 | 100.6 ± 51.3 | 87.3 ± 33.9 | –13.2 ± 46.0 | 0.003 | 0.184 |
| Fruits (%) | 57.3 ± 53.9 | 56.9 ± 70.2 | –0.4 ± 68.7 | 0.954 | 56.9 ± 56.0 | 49.3 ± 48.2 | –7.6 ± 61.1 | 0.169 | 68.0 ± 71.7 | 62.6 ± 63.0 | –5.4 ± 74.4 | 0.442 | 0.711 |
| Milk·dairy products (%) | 44.0 ± 64.2 | 44.3 ± 54.5 | 0.3 ± 68.0 | 0.966 | 51.0 ± 74.6 | 73.6 ± 60.2 | 22.6 ± 76.1 | 0.001 | 55.2 ± 66.4 | 55.4 ± 45.9 | 0.1 ± 71.9 | 0.983 | 0.023 |
| Oils·fats·sugars (%) | 123.6 ± 71.5 | 108.3 ± 71.7 | –15.3 ± 70.8 | 0.025 | 133.6 ± 70.8 | 102.1 ± 65.6 | –31.5 ± 68.5 | < 0.0001 | 124.0 ± 64.6 | 93.7 ± 51.7 | –30.3 ± 68.3 | < 0.0001 | 0.149 |
| Overall |
42 (38.2) | 30 (27.3) | –12 (–10.9) | 0.070 |
40 (32.5) | 57 (46.3) | 17 (13.8) | 0.022 |
44 (38.9) | 57 (50.4) | 13 (11.5) | 0.058 |
0.001 |
| CG (n = 110) |
HG (n = 123) |
EG (n = 113) |
P |
||||||||||
|---|---|---|---|---|---|---|---|---|---|---|---|---|---|
| Before | After | Difference | P |
Before | After | Difference | P |
Before | After | Difference | P |
||
| Anthropometry | |||||||||||||
| Weight (kg) | 72.4 ± 12.5 | 72.0 ± 12.5 | –0.3 ± 2.6 | 0.204 | 72.7 ± 13.0 | 72.2 ± 12.7 | –0.5 ± 2.1 | 0.007 | 69.7 ± 11.6 | 69.8 ± 11.5 | 0.1 ± 1.7 | 0.592 | 0.097 |
| Body mass index (kg/m2) | 26.7 ± 3.6 | 26.6 ± 3.7 | –0.2 ± 0.9 | 0.080 | 26.3 ± 2.9 | 26.1 ± 2.7 | –0.2 ± 0.8 | 0.002 | 25.9 ± 2.8 | 25.9 ± 2.9 | 0.0 ± 0.7 | 0.929 | 0.084 |
| Waist circumference (cm) | 90.3 ± 9.0 | 89.1 ± 8.9 | –1.3 ± 2.8 | < 0.0001 | 89.4 ± 8.0 | 88.0 ± 7.7 | –1.3 ± 2.2 | < 0.0001 | 88.4 ± 7.1 | 86.8 ± 6.6 | –1.6 ± 2.8 | < 0.0001 | 0.632 |
| Lipid profile | |||||||||||||
| HDL cholesterol (mg/dL) | 48.5 ± 11.7 | 48.9 ± 11.1 | 0.4 ± 7.6 | 0.600 | 51.6 ± 12.1 | 51.3 ± 12.4 | –0.2 ± 8.5 | 0.751 | 50.9 ± 10.9 | 49.2 ± 10.4 | –1.7 ± 8.3 | 0.037 | 0.162 |
| LDL cholesterol (mg/dL) | 130.3 ± 33.7 | 131.7 ± 34.9 | 1.4 ± 22.5 | 0.515 | 134.0 ± 40.9 | 132.4 ± 32.1 | –1.6 ± 35.7 | 0.618 | 126.1 ± 33.4 | 126.9 ± 34.2 | 0.7 ± 28.6 | 0.785 | 0.715 |
| Triglycerides (mg/dL) | 219.1 ± 144.0 | 204.9 ± 152.8 | –14.2 ± 139.8 | 0.290 | 175.0 ± 95.0 | 153.4 ± 75.8 | –21.6 ± 76.2 | 0.002 | 182.6 ± 123.7 | 183.3 ± 121.9 | 0.7 ± 103.1 | 0.943 | 0.281 |
| Blood pressure | |||||||||||||
| Systolic blood pressure (mmHg) | 133.2 ± 18.1 | 132.4 ± 17.9 | –0.8 ± 14.6 | 0.553 | 132.9 ± 17.1 | 129.5 ± 17.2 | –3.4 ± 15.3 | 0.016 | 135.8 ± 16.4 | 130.8 ± 16.0 | –5.0 ± 14.3 | < 0.0001 | 0.106 |
| Diastolic blood pressure (mmHg) | 89.0 ± 12.0 | 86.9 ± 11.8 | –2.2 ± 11.1 | 0.044 | 86.6 ± 12.3 | 84.0 ± 11.7 | –2.6 ± 10.9 | 0.009 | 89.1 ± 11.3 | 84.8 ± 12.2 | –4.3 ± 10.4 | < 0.0001 | 0.277 |
| Glucose homeostasis | |||||||||||||
| Fasting blood glucose (mg/dL) | 101.4 ± 17.1 | 100.8 ± 17.6 | –0.6 ± 10.2 | 0.539 | 101.7 ± 18.6 | 100.7 ± 14.3 | –1.0 ± 10.5 | 0.289 | 102.4 ± 14.9 | 103.3 ± 19.2 | 1.0 ± 9.9 | 0.296 | 0.297 |
| Insulin (μU/mL) | 8.3 ± 7.6 | 8.5 ± 6.5 | 0.3 ± 9.1 | 0.753 | 7.5 ± 4.1 | 8.3 ± 7.3 | 0.8 ± 6.7 | 0.170 | 7.5 ± 7.0 | 8.0 ± 5.5 | 0.6 ± 8.8 | 0.488 | 0.873 |
| HbA1c (%) | 5.7 ± 0.8 | 5.6 ± 0.7 | 0.0 ± 0.3 | 0.189 | 5.6 ± 0.7 | 5.6 ± 0.6 | 0.0 ± 0.3 | 0.404 | 5.7 ± 0.6 | 5.7 ± 0.6 | 0.0 ± 0.3 | 0.403 | 0.256 |
Table 1. Baseline characteristics of participants in three groups
Mean ± SD or n (%). CG, control group with no intervention; HG, the nutrition education group for promoting the Han-sik consumption; EG, the nutrition education group for balanced diet; HDL, high-density lipoprotein. Moderate physical activity of at least 30 min at a time for 5 or more days per week or intense physical activity of at least 20 min at a time of 3 or more days per week. Metabolic syndrome, those who had three or more of the following five components. Impaired blood glucose (fasting blood glucose ≥ 100 mg/dL), elevated blood pressure (≥ 130/85 mmHg), low HDL-cholesterol (< 50 mg/dL for women, < 40 mg/dL for men), hypertriglyceridemia (≥ 150 mg/dL), and abdominal obesity (waist circumference ≥ 85 cm for women, ≥ 90 cm for men).
Table 2. Self-reported changes in dietary behaviors during nutrition education1)
Mean ± SD. CG, control group; HG, the education to increase Han-sik consumption group; EG, the education to promote a balanced diet group. The score was answered as follows keeping the guideline: always = 5, frequently = 4, modestly = 3, seldom = 2, never = 1.
Table 3. The changes of nutrients and food group intakes among three groups after nutrition education
Mean ± SD or n (%). CG, control group with no intervention; HG, the nutrition education group for promoting the Han-sik consumption; EG, the nutrition education group for balanced diet; CHO, carbohydrate. The percentage of Han-sik items of all consumed dish items using Han-sik database. Adherence score to the Korean Food Guidance System (KFGS) was defined as the percentage of consumed daily servings from each food groups to the recommended servings of the KFGS for each age group by sex. The number of participants whose intakes of food group meet three or more in the KFGS: 80% ≤ the adherence score of ‘grains’ and ‘meat, fish, eggs, beans’ < 120%, 80% ≤ the adherence score of ‘vegetables’, ‘fruits’, and ‘milk, dairy products’, and the adherence score of ‘oils, fats, sugars’ < 120%.
Table 4. The changes in anthropometric and serum biochemistry among three groups after nutrition education
Mean ± SD. CG, control group with no intervention; HG, the nutrition education group for promoting the Han-sik consumption; EG, the nutrition education group for balanced diet, HDL, high-density lipoprotein; LDL, low-density lipoprotein; HbA1c, hemoglobin A1c.


