
Articles
- Page Path
- HOME > Korean J Community Nutr > Volume 30(1); 2025 > Article
-
Research Article
근거 기반 나트륨 저감 건강 식생활 프로그램의 리빙랩 모델 적용 -
김정현1)
 , 심유진2),†, 경민숙3), 권수연4), 박형수5), 강재헌6)
 - Application of a living lab model to an evidence-based reduced-sodium healthy eating practice program in Korea: a pre-post study
-
Jung-Hyun Kim1), Eugene Shim2),†, Min Sook Kyung3), Sooyoun Kwon4), Hyoung Su Park5), Jae-Heon Kang6)
-
Korean Journal of Community Nutrition 2025;30(1):53-63.
DOI: https://doi.org/10.5720/kjcn.2024.00346
Published online: February 28, 2025
1)배재대학교 식품영양학과 교수
2)숭의여자대학교 식품영양과 조교수
3)대전광역시 서구 어린이•사회복지급식관리지원센터 부센터장
4)신구대학교 식품영양학과 조교수
5)매일헬스뉴트리션(주) R&D group, 차장
6)성균관대학교 강북삼성병원 가정의학과 교수
1)Professor, Department of Food and Nutrition, Pai Chai University, Daejeon, Korea
2)Assistant Professor, Department of Food and Nutrition, Soongeui Women’s University, Seoul, Korea
3)Associate Director, Daejeon-Seogu Children and Social Welfare Meal Management Support Center, Daejeon, Korea
4)Assistant Professor, Department of Food and Nutrition, Shingu University, Seongnam, Korea
5)Associate Director, R&D group, Maeil Health Nutrition Co., Ltd, Korea
6)Professor, Department of Family Medicine, Kangbuk Samsung Hospital, Sungkyunkwan University, Seoul, Korea
- †Corresponding author: Eugene Shim Department of Food and Nutrition, Soongeui Women’s University, 10 Sopa-ro 2-gil, Jung-gu, Seoul 04628, Korea Tel: +82-2-3708-9263 Fax: +82-2-773-2625 Email: eugeneshim@sewu.ac.kr
• Received: December 22, 2024 • Revised: January 16, 2025 • Accepted: February 6, 2025
© 2025 The Korean Society of Community Nutrition
This is an Open-Access article distributed under the terms of the Creative Commons Attribution Non-Commercial License (http://creativecommons.org/licenses/by-nc/4.0) which permits unrestricted non-commercial use, distribution, and reproduction in any medium, provided the original work is properly cited.
- 2,804 Views
- 75 Download
- 1 Crossref

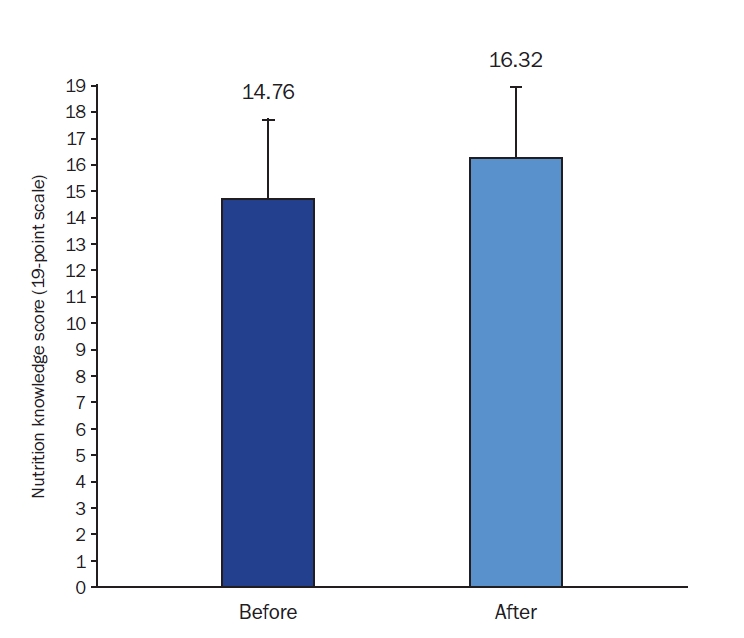
Figure & Data
REFERENCES
Citations
Citations to this article as recorded by 
- Influence of food literacy on short- and long-term healthy eating intentions among adolescent and adult convenience store users: An application of the extended theory of planned behavior
Wonyeong Park, Hae Jin Park, Suah Moon, Jieun Oh
Nutrition Research and Practice.2025; 19(6): 917. CrossRef
 Cite
CiteApplication of a living lab model to an evidence-based reduced-sodium healthy eating practice program in Korea: a pre-post study
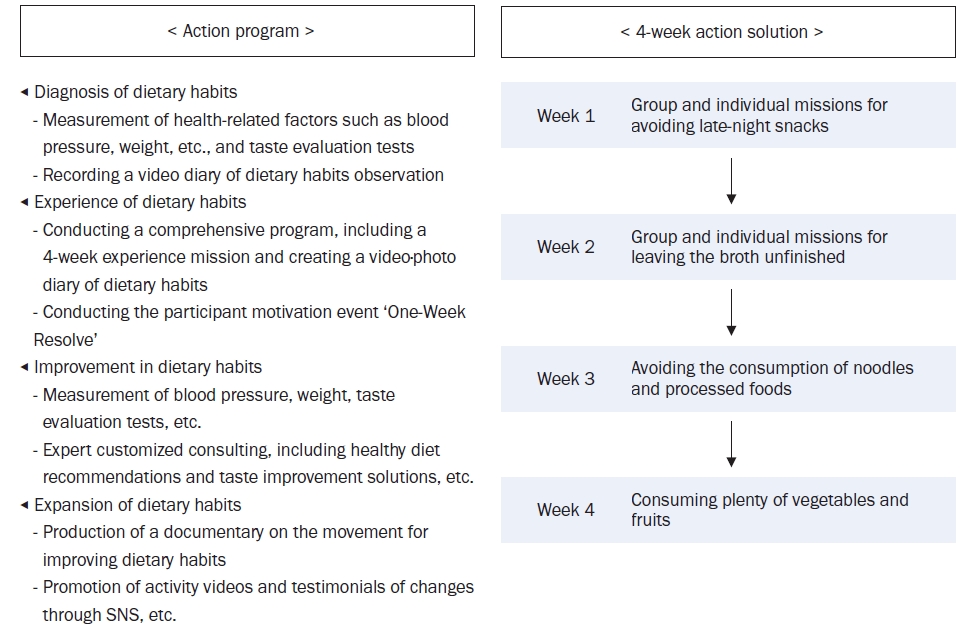

Fig. 1. Structure and practical steps of the reduced-sodium healthy eating practice program.
Fig. 2. Change in nutrition knowledge before and after the reduced-sodium healthy eating practice program (n = 38). Mean ± SD; paired t-test; **P < 0.01.
Fig. 1.
Fig. 2.
Application of a living lab model to an evidence-based reduced-sodium healthy eating practice program in Korea: a pre-post study
| Characteristics | Classification | Frequency |
|---|---|---|
| Sex | Male | 8 (20.0) |
| Female | 32 (80.0) | |
| Age group (year) | 10s | 4 (10.0) |
| 20s | 26 (65.0) | |
| 30s | 2 (5.0) | |
| 40s | 3 (7.5) | |
| 50+ | 5 (12.5) | |
| Family size | 1 | 6 (15.0) |
| 2 | 1 (2.5) | |
| 3 | 7 (17.5) | |
| 4 | 17 (42.5) | |
| ≥ 5 | 8 (20.0) | |
| N/A | 1 (2.5) | |
| Occupation | Service and sales | 1 (2.5) |
| Clerical | 6 (15.0) | |
| Self-employed | 1 (2.5) | |
| Professionals | 2 (5.0) | |
| Others | 15 (37.5) | |
| None | 15 (37.5) | |
| Income range (million KRW) | < 1 | 6 (15.0) |
| 1–2 | 4 (10.0) | |
| 2–3 | 0 (0.0) | |
| 3–4 | 9 (22.5) | |
| 4–5 | 8 (20.0) | |
| ≥ 5 | 12 (30.0) | |
| N/A | 1 (2.5) | |
| Education level | Elementary school graduate | 3 (7.5) |
| Middle school graduate | 0 (0.0) | |
| High school graduate | 21 (52.5) | |
| University graduate | 11 (27.5) | |
| Graduate school or higher | 3 (7.5) | |
| N/A | 2 (5.0) | |
| Obesity degree | Underweight |
4 (10.0) |
| Normal weight |
23 (57.5) | |
| Overweight |
8 (20.0) | |
| Obese |
5 (12.5) |
| Goal 1: ‘Literacy’ enhancement for sodium reduction |
| ◀ Emphasize balanced meal intake centered on breakfast |
| ◀ Intend to improve fruit and vegetable consumption |
| ◀ Intend to reduce the frequency of eating out |
| Goal 2: ‘Competency’ strengthening for sodium reduction |
| ◀ Choose ingredients to reduce sodium intake |
| ◀ Practice your own recipes and methods |
| ◀ Practice healthier menus today than those from yesterday |
| Classification | Before |
After |
t-value |
P-value |
|---|---|---|---|---|
| I will be interested in the amount of sodium in foods and ingredients. | 3.78 ± 0.92 | 4.43 ± 0.68 | –4.106 | < 0.001 |
| I will practice a low-sodium diet to improve my health. | 4.53 ± 0.64 | 4.73 ± 0.55 | –2.243 | 0.031 |
| I will purchase fresh foods rather than processed and instant foods. | 4.18 ± 0.68 | 4.43 ± 0.84 | –1.706 | 0.096 |
| I will ask for food to be prepared with less salt when dining out. | 2.90 ± 1.06 | 3.60 ± 1.03 | –4.149 | < 0.001 |
| I will choose dishes that preserve the natural flavors of ingredients rather than spicy and salty foods. | 3.75 ± 0.67 | 4.30 ± 0.61 | –5.135 | < 0.001 |
| I will pay attention to cooking methods that support a low-sodium diet. | 4.33 ± 0.66 | 4.28 ± 0.72 | 0.361 | 0.720 |
| I will believe that attempts and interest in reducing sodium intake can lead to social change. | 4.28 ± 0.72 | 4.50 ± 0.55 | –1.940 | 0.060 |
| I will choose low-sodium versions of pickled foods and kimchi. | 3.85 ± 0.77 | 4.18 ± 0.87 | –2.010 | 0.051 |
| I will opt for steamed or grilled dishes instead of braised dishes. | 4.20 ± 0.65 | 4.30 ± 0.72 | –0.752 | 0.457 |
| I will leave the broth and focus on the solid ingredients when eating soup, stew, or ramen. | 4.50 ± 0.75 | 4.68 ± 0.62 | –1.639 | 0.109 |
| I will reduce the amount of gochujang or seasoning in bibimbap by half. | 4.03 ± 0.86 | 4.33 ± 0.83 | –1.669 | 0.103 |
| I will gradually reduce the amount of soup base in ramen and cook with half the recommended amount. | 3.75 ± 1.19 | 3.93 ± 1.23 | –0.943 | 0.352 |
| I will consume fresh vegetables and fruits. | 4.83 ± 0.38 | 4.80 ± 0.52 | 0.274 | 0.785 |
| I will not use table salt separately. | 4.60 ± 0.59 | 4.65 ± 0.62 | –0.467 | 0.643 |
| I will consciously try to eat food with less seasoning and sauces. | 4.60 ± 0.55 | 4.68 ± 0.57 | –0.684 | 0.498 |
| I will check the nutrition labels of processed foods to choose products with lower sodium content. | 4.40 ± 0.63 | 4.43 ± 0.64 | –0.206 | 0.838 |
| I will refer to “low-sodium recipes” for guidance when cooking. | 4.05 ± 0.93 | 4.23 ± 0.73 | –1.267 | 0.213 |
| Classification | Before |
After |
t-value |
P-value |
|---|---|---|---|---|
| I eat all the broth in soups, stews, noodles, and ramen. | 3.30 ± 1.29 | 4.00 ± 0.88 | –3.264 | 0.002 |
| I feel that if food is bland, something is missing, and I am not satisfied. | 2.57 ± 1.12 | 3.43 ± 0.93 | –5.237 | < 0.001 |
| I enjoy dishes like donburi, fried rice, bibimbap, and curry rice. | 2.05 ± 0.88 | 2.59 ± 0.90 | –3.651 | 0.001 |
| I like simmered dishes that are seasoned just right with soy sauce. | 2.25 ± 0.94 | 2.86 ± 0.90 | –3.588 | 0.001 |
| I prefer Japanese or Chinese food over Western food. | 2.81 ± 0.91 | 3.22 ± 0.92 | –2.852 | 0.007 |
| I like kimchi more than fresh vegetables. | 2.95 ± 1.27 | 3.16 ± 1.14 | –1.091 | 0.282 |
| I enjoy snacks with a salty taste, like potato chips and crackers. | 2.73 ± 1.37 | 3.27 ± 1.07 | –3.424 | 0.002 |
| I dine out or order takeout at least twice a week. | 2.49 ± 1.15 | 3.32 ± 1.20 | –3.484 | 0.001 |
| I like dried fish or salted mackerel. | 3.14 ± 1.11 | 3.57 ± 1.01 | –2.665 | 0.011 |
| I feel incomplete if there are no fermented fish products, like salted cod roe, on the table. | 4.08 ± 1.12 | 4.38 ± 0.86 | –1.766 | 0.086 |
| I enjoy spicy and salty foods as snacks while drinking alcoholic. | 2.70 ± 1.33 | 3.49 ± 1.19 | –4.886 | < 0.001 |
| I like spreading butter or margarine generously (100% of the bread surface) on bread. | 2.53 ± 1.42 | 3.58 ± 1.32 | –7.666 | < 0.001 |
| I usually use homemade soy sauce rather than regular soy sauce. | 3.51 ± 1.26 | 3.24 ± 1.21 | 1.822 | 0.077 |
| I habitually add salt or soy sauce before meals. | 3.97 ± 1.26 | 4.38 ± 0.76 | –2.579 | 0.014 |
| I immediately add salt or soy sauce at the table if dishes like vegetables or soups are bland. | 3.19 ± 1.49 | 4.19 ± 0.89 | –4.743 | < 0.001 |
| I feel that if there is less salt in food, it doesn’t taste good. | 2.69 ± 1.12 | 3.53 ± 1.03 | –5.916 | < 0.001 |
| I often use mayonnaise or salad dressing when cooking. | 3.19 ± 1.17 | 3.47 ± 1.06 | –1.303 | 0.201 |
| I frequently eat soybean paste soup. | 2.95 ± 1.05 | 3.49 ± 1.02 | –2.941 | 0.006 |
| I dip pancakes, fried foods, or sashimi generously in soy sauce (enough to submerge the food). | 3.15 ± 1.25 | 3.92 ± 0.98 | –4.629 | < 0.001 |
| I like instant foods (like ham and sausages) or ready-to-eat foods (like 3-minute meals), and ramen. | 2.61 ± 1.24 | 3.08 ± 0.91 | –3.070 | 0.004 |
| I eat vegetables with every meal. |
2.97 ± 0.96 | 3.46 ± 0.97 | –2.714 | 0.010 |
| I eat fruit more than twice a day. |
2.54 ± 1.17 | 3.00 ± 1.05 | –2.471 | 0.018 |
| I usually check the sodium content on nutrition labels when purchasing food or dining out. |
2.44 ± 1.41 | 3.33 ± 1.08 | –4.634 | < 0.001 |
| Classification | Before (n = 40) | After (n = 40) | t-value |
P-value |
|---|---|---|---|---|
| Energy (kcal) | 2,000.71 ± 912.59 | 1,450.27 ± 711.18 | 4.286 | < 0.001 |
| Carbohydrate (g) | 271.44 ± 113.51 | 205.04 ± 107.31 | 4.025 | < 0.001 |
| Lipid (g) | 58.45 ± 29.66 | 41.55 ± 21.48 | 4.059 | < 0.001 |
| Protein (g) | 72.35 ± 34.47 | 53.21 ± 26.44 | 3.999 | < 0.001 |
| Dietary fiber (g) | 23.39 ± 12.11 | 18.20 ± 10.03 | 2.826 | 0.007 |
| Vitamin A (ugRAE) | 307.18 ± 118.17 | 233.63 ± 109.61 | 4.012 | < 0.001 |
| Vitamin D (ug) | 3.64 ± 2.97 | 2.52 ± 2.27 | 2.278 | 0.028 |
| Vitamin E (mg) | 15.89 ± 8.13 | 12.46 ± 7.84 | 3.400 | 0.002 |
| Vitamin K (ug) | 113.65 ± 67.20 | 113.47 ± 88.82 | 0.013 | 0.990 |
| Vitamin C (mg) | 87.91 ± 41.89 | 87.58 ± 50.86 | 0.047 | 0.963 |
| Thiamin (mg) | 1.95 ± 0.92 | 1.39 ± 0.69 | 4.315 | < 0.001 |
| Riboflavin (mg) | 1.63 ± 0.69 | 1.18 ± 0.56 | 4.988 | < 0.001 |
| Niacin (mg) | 9.99 ± 5.28 | 7.52 ± 3.73 | 3.365 | 0.002 |
| Ca (mg) | 549.32 ± 209.32 | 401.47 ± 216.09 | 4.801 | < 0.001 |
| P (mg) | 1,107.18 ± 482.17 | 822.28 ± 414.82 | 4.285 | < 0.001 |
| Na (mg) | 3,382.37 ± 2,345.57 | 2,119.05 ± 1,326.63 | 4.082 | < 0.001 |
| K (mg) | 2,301.83 ± 1,021.15 | 1,845.01 ± 898.53 | 2.956 | 0.005 |
| Fe (mg) | 13.44 ± 6.28 | 10.72 ± 5.23 | 3.035 | 0.004 |
| Zn (mg) | 12.26 ± 8.74 | 8.03 ± 3.78 | 3.211 | 0.003 |
| Cholesterol (mg) | 334.06 ± 186.12 | 236.38 ± 132.69 | 4.283 | < 0.001 |
Table 1. General characteristics of the participants (n = 40)
n (%). N/A, not available. Body mass index (BMI) of <18.5 kg/m2. 18.5 ≤ BMI <23 kg/m2. 23 ≤ BMI <25 kg/m2. BMI of ≥ 25 kg/m2.
Table 2. Goals and content structure of the evidence-based reduced-sodium healthy eating practice program
Table 3. Intentions to reduce sodium before and after the reduced-sodium healthy eating practice program (n = 40)
Mean ± SD. 1 = Strongly disagree; 2 = disagree; 3 = neutral; 4 = agree; 5 = strongly agree. Paired t-test.
Table 4. Dietary behaviors for reducing sodium before and after the reduced-sodium healthy eating practice program (n = 40)
Mean ± SD. 1 = Strongly agree; 2 = agree; 3 = neutral; 4 = disagree; 5 = strongly disagree. Paired t-test. Reversed scale (1 = strongly disagree; 2 = disagree; 4 = agree; 5 = strongly agree).
Table 5. Nutrient intake levels before and after the reduced-sodium healthy eating practice program (n = 40)
Mean ± SD. Paired t-test.


