
Articles
- Page Path
- HOME > Korean J Community Nutr > Volume 30(5); 2025 > Article
-
Research Article
한국 장애인의 영양 위험 관련 요인: 장애인삶 패널조사 자료를 이용하여 -
김성아1)
 , 최슬기2),†
 - Factors associated with nutritional risk among disabled persons in the Republic of Korea: a cross-sectional study using 2020 Disability and Life Dynamics Panel
-
Seong-Ah Kim1), Seul Ki Choi2),†
-
Korean Journal of Community Nutrition 2025;30(5):364-375.
DOI: https://doi.org/10.5720/kjcn.2025.00262
Published online: October 31, 2025
1)서울연구원 포용도시연구실 연구위원
2)서울시립대학교 도시보건대학원 조교수
1)Research Fellow, Urban Society Research Division, The Seoul Institute, Seoul, Korea
2)Assistant Professor, Graduate School of Urban Public Health, University of Seoul, Seoul, Korea
- †Corresponding author: Seul Ki Choi Graduate School of Urban Public Health, University of Seoul, 163 Seoulsiripdae-ro, Dongdaemun-gu, Seoul 02504, Korea Tel: +82-2-6490-6757 Fax: +82-2-6790-6754 Email: skchoi@uos.ac.kr
• Received: September 18, 2025 • Revised: October 13, 2025 • Accepted: October 22, 2025
© 2025 The Korean Society of Community Nutrition
This is an Open-Access article distributed under the terms of the Creative Commons Attribution Non-Commercial License (http://creativecommons.org/licenses/by-nc/4.0) which permits unrestricted non-commercial use, distribution, and reproduction in any medium, provided the original work is properly cited.
- 1,141 Views
- 48 Download
Abstract
-
Objectives
- Persons with disabilities face heightened nutritional risks due to barriers in dietary management, yet research remains limited. This study examined the nutritional health status and associated risk factors among disabled adults in Korea.
-
Methods
- Data were drawn from the 2020 Disability and Life Dynamics Panel, a nationally representative survey of registered disabled Koreans aged ≥ 20 years. Nutritional health was assessed using the Nutrition Screening Initiative checklist and categorized as low, moderate, or high risk. Multivariate multinomial logistic regression was applied to identify predictors of nutritional risk.
-
Results
- Among adults with disabilities aged 20–64 years, the prevalence of low, moderate, and high nutritional risk was 62.6%, 19.8%, and 17.5%, respectively. In the ≥ 65 years group, the distribution was 56.8% (low), 22.0% (moderate), and 21.2% (high). Moderate to high nutritional risk was most prevalent among individuals with facial deformity or internal organ disability (51.2%) in the 20–64 years group, and those with mental disabilities (61.7%) in the ≥ 65 years group. Significant predictors of high nutritional risk included living alone, lowest income quartile, chronic disease, depressive symptoms, and perceived underweight for both age groups. Compared with visual or speech impairments, facial deformity or internal organ disability (in the 20–64 years group) and physical disability (in the ≥ 65 years group) were significantly associated with moderate or high nutritional risk.
-
Conclusion
- Nearly 40% of disabled Koreans are at nutritional risk. Tailored dietary interventions that address disability type, socioeconomic status, and health conditions are required to reduce disparities in nutritional health.
INTRODUCTION
METHODS
RESULTS
DISCUSSION
-
CONFLICT OF INTEREST
There are no financial or other issues that might lead to conflict of interest.
-
FUNDING
None.
-
DATA AVAILABILITY
The data that support the findings of this study are openly available through the data portal of statistics for disabled people, operated by the Korea Disabled people’s Development Institute (https://koddi.or.kr/stat).
NOTES
Fig. 1.Distribution of nutritional risk by disability type and age among the study population. (A) Participants aged 20–64 years. (B) Participants aged ≥ 65 years. Values are presented as weighted %. Rao-Scott Chi-square tests were used to analyze differences in nutritional risk by disability type.
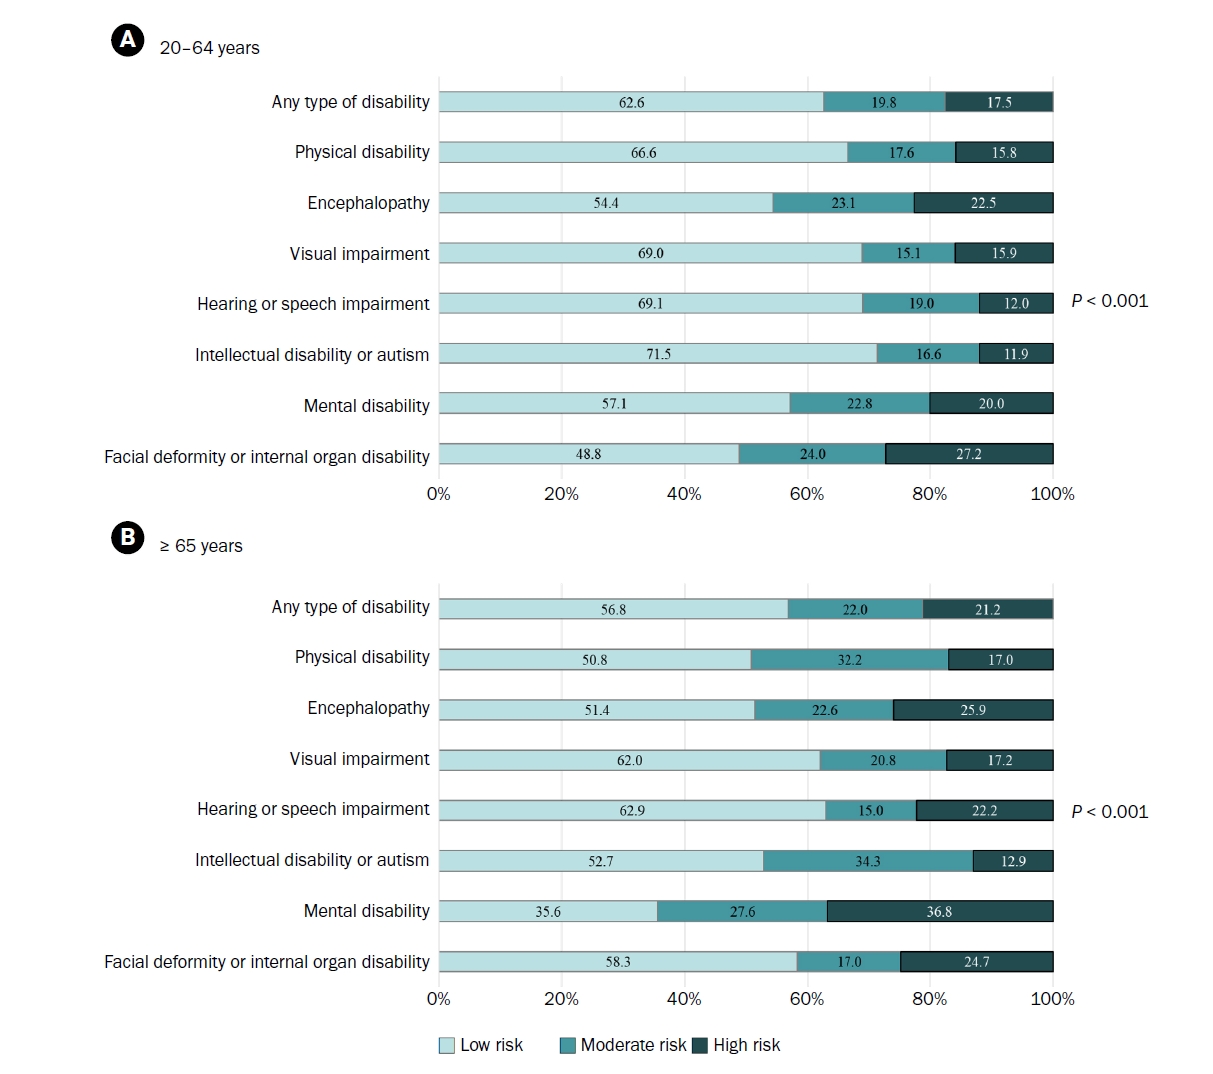
Table 1.Characteristics of study participants aged 20–64 years by nutritional risk
| Total | Nutritional risk | P-values1) | |||||||
|---|---|---|---|---|---|---|---|---|---|
| Low | Moderate | High | |||||||
| n | Weighted % | n | Weighted % | n | Weighted % | n | Weighted % | ||
| Total | 3,255 | 100 | 2,014 | 62.6 | 649 | 19.8 | 592 | 17.5 | - |
| Sex | |||||||||
| Male | 1,804 | 57.0 | 1,139 | 56.6 | 352 | 55.9 | 313 | 59.6 | 0.587 |
| Female | 1,451 | 43.0 | 875 | 43.4 | 297 | 44.1 | 279 | 40.4 | |
| Living arrangement | |||||||||
| Living alone | 661 | 21.9 | 305 | 16.7 | 148 | 26.5 | 208 | 35.4 | < 0.001 |
| Living with other members | 2,594 | 78.1 | 1,709 | 83.3 | 501 | 73.5 | 384 | 64.6 | |
| Household income | |||||||||
| Q1 (the lowest) | 728 | 21.5 | 355 | 16.7 | 152 | 22.8 | 221 | 36.9 | < 0.001 |
| Q2 | 790 | 23.3 | 452 | 21.7 | 164 | 24.9 | 174 | 27.1 | |
| Q3 | 849 | 27.2 | 568 | 29.9 | 182 | 28.9 | 99 | 15.4 | |
| Q4 (the highest) | 888 | 28.1 | 639 | 31.7 | 151 | 23.4 | 98 | 20.7 | |
| Education | |||||||||
| Middle school graduate or less | 968 | 34.4 | 537 | 32.0 | 205 | 35.6 | 226 | 41.5 | 0.013 |
| High school graduate or higher | 2,287 | 65.6 | 1,477 | 68.0 | 444 | 64.4 | 366 | 58.5 | |
| Multiple disabilities | |||||||||
| Yes | 187 | 4.5 | 98 | 3.5 | 40 | 4.4 | 49 | 8.1 | 0.001 |
| No | 3,068 | 95.5 | 1,916 | 96.5 | 609 | 95.6 | 543 | 91.9 | |
| Chronic disease | |||||||||
| Yes | 1,877 | 59.3 | 948 | 48.9 | 459 | 74.2 | 470 | 79.9 | < 0.001 |
| No | 1,378 | 40.7 | 1,066 | 51.1 | 190 | 25.8 | 122 | 20.1 | |
| Depression | |||||||||
| Yes | 1,551 | 44.8 | 748 | 34.5 | 359 | 51.6 | 444 | 73.8 | < 0.001 |
| No | 1,704 | 55.2 | 1,266 | 65.5 | 290 | 48.4 | 148 | 26.2 | |
| Perceived body weight | |||||||||
| Underweight | 421 | 12.4 | 204 | 10.1 | 84 | 12.0 | 284 | 49.5 | < 0.001 |
| Normal | 2,185 | 68.2 | 1,508 | 75.7 | 393 | 61.0 | 133 | 21.1 | |
| Overweight | 649 | 19.4 | 302 | 14.3 | 172 | 27.0 | 175 | 29.4 | |
| Smoking | |||||||||
| Current smoker2) | 376 | 12.4 | 191 | 10.4 | 82 | 13.8 | 103 | 17.9 | 0.001 |
| Non-smoker | 2,879 | 87.6 | 1,823 | 89.6 | 567 | 86.2 | 489 | 82.1 | |
Table 2.Characteristics of study participants aged ≥ 65 years by nutritional risk
| Total | Nutritional risk | P-values1) | |||||||
|---|---|---|---|---|---|---|---|---|---|
| Low | Moderate | High | |||||||
| n | Weighted % | n | Weighted % | n | Weighted % | n | Weighted % | ||
| Total | 1,146 | 100 | 638 | 56.8 | 249 | 22.0 | 259 | 21.2 | |
| Sex | |||||||||
| Male | 596 | 54.1 | 350 | 54.1 | 121 | 57.6 | 125 | 50.6 | 0.568 |
| Female | 550 | 45.9 | 288 | 45.9 | 128 | 42.4 | 134 | 49.4 | |
| Living arrangement | |||||||||
| Living alone | 294 | 27.9 | 133 | 22.5 | 59 | 24.1 | 102 | 46.3 | < 0.001 |
| Living with other members | 852 | 72.1 | 505 | 77.5 | 190 | 75.9 | 157 | 53.7 | |
| Household income | |||||||||
| Q1 (the lowest) | 368 | 32.8 | 169 | 25.7 | 68 | 28.9 | 131 | 56.0 | < 0.001 |
| Q2 | 316 | 26.5 | 186 | 28.5 | 77 | 28.2 | 53 | 19.3 | |
| Q3 | 263 | 23.1 | 160 | 26.0 | 59 | 24.2 | 44 | 14.0 | |
| Q4 (the highest) | 199 | 17.6 | 123 | 19.7 | 45 | 18.8 | 31 | 10.8 | |
| Education | |||||||||
| Middle school graduate or less | 736 | 67.3 | 385 | 65.6 | 174 | 69.8 | 177 | 69.6 | 0.601 |
| High school graduate or higher | 410 | 32.7 | 253 | 34.4 | 75 | 30.2 | 82 | 30.4 | |
| Multiple disabilities | |||||||||
| Yes | 79 | 5.5 | 37 | 4.2 | 24 | 9.5 | 18 | 4.8 | 0.052 |
| No | 1,067 | 94.5 | 601 | 95.8 | 225 | 90.5 | 241 | 95.2 | |
| Chronic disease | |||||||||
| Yes | 891 | 77.5 | 446 | 69.6 | 215 | 88.3 | 230 | 87.3 | < 0.001 |
| No | 255 | 22.5 | 192 | 30.4 | 34 | 11.7 | 29 | 12.7 | |
| Depression | |||||||||
| Yes | 597 | 47.4 | 258 | 35.1 | 140 | 50.8 | 199 | 77.0 | < 0.001 |
| No | 549 | 52.6 | 380 | 64.9 | 109 | 49.2 | 60 | 23.0 | |
| Perceived body weight | |||||||||
| Underweight | 207 | 16.1 | 82 | 11.5 | 51 | 20.5 | 74 | 24.2 | < 0.001 |
| Normal | 761 | 69.3 | 479 | 77.4 | 146 | 60.4 | 136 | 57.0 | |
| Overweight | 178 | 14.5 | 77 | 11.2 | 52 | 19.0 | 49 | 18.8 | |
| Smoking | |||||||||
| Current smoker2) | 80 | 8.9 | 37 | 7.9 | 16 | 8.7 | 27 | 11.6 | 0.531 |
| Non-smoker | 1,066 | 91.1 | 601 | 92.1 | 233 | 91.3 | 232 | 88.4 | |
Table 3.Affirmative responses of Nutrition Screening Initiative checklist items among disabled persons by age and nutritional risk
| Item | 20–64 years | ≥ 65 years | ||||||||
|---|---|---|---|---|---|---|---|---|---|---|
| Total (n = 3,255) | Low risk (n = 2,014) | Moderate risk (n = 649) | High risk (n = 592) | P-values | Total (n = 1,146) | Low risk (n = 638) | Moderate risk (n=249) | High risk (n = 259) | P-values1) | |
| I eat fewer than two meals per day | 1.0 | 0.0 | 0.6 | 5.1 | -2) | 0.2 | 0.0 | 0.2 | 0.8 | -2) |
| I have an illness or condition that made me change the kind and /or amount of food I eat | 18.7 | 6.3 | 35.9 | 43.6 | < 0.001 | 20.9 | 7.7 | 29.2 | 47.9 | < 0.001 |
| I eat few fruits or vegetables, or milk products | 20.7 | 6.4 | 36.3 | 54.2 | < 0.001 | 23.4 | 4.3 | 41.9 | 55.3 | < 0.001 |
| I have tooth or mouth problems that make it hard for me to eat | 8.5 | 0.9 | 8.2 | 36.0 | < 0.001 | 15.1 | 0.5 | 20.2 | 49.0 | < 0.001 |
| I don’t always have enough money to buy the food I need | 11.8 | 0.0 | 5.7 | 61.0 | -a | 12.4 | 0.0 | 2.9 | 55.2 | -2) |
| I eat alone most of the time | 34.5 | 14.1 | 62.9 | 75.5 | < 0.001 | 35.2 | 17.0 | 49.6 | 69.0 | < 0.001 |
| I take three or more different prescribed or over-the-counter drugs a day | 21.4 | 5.3 | 36.5 | 62.1 | < 0.001 | 29.7 | 11.5 | 42.8 | 65.0 | < 0.001 |
| Without wanting to, I have lost or gained 5 kg or more in the last six months | 7.4 | 0.8 | 9.3 | 28.7 | < 0.001 | 4.9 | 1.1 | 2.2 | 17.7 | < 0.001 |
| I am not always physically able to shop, cook and/or feed myself | 21.1 | 2.7 | 34.6 | 71.5 | < 0.001 | 26.3 | 3.7 | 40.5 | 72.0 | < 0.001 |
| I have three or more drinks of beer, liquor or wine almost every day | 1.3 | 0.8 | 2.4 | 1.7 | 0.053 | 1.5 | 0.9 | 2.1 | 2.5 | 0.271 |
Table 4.Multivariate multinomial logistic regression models estimating predictors of moderate and high nutritional risk among disabled persons by age
- 1. Kim SY, Park JH. Disability epidemiology and health policy in Korea. J Korean Med Assoc 2022; 65(10): 655-661. ArticlePDF
- 2. Korean Law Information Center. Act on welfare of persons with disabilities [Internet]. Ministry of Government; 2025 [updated 2025 Apr 22; cited 2025 Oct 13]. Available from: https://www.law.go.kr/lsInfoP.do?lsId=000187&ancYnChk=0#0000
- 3. An R, Chiu CY, Zhang Z, Burd NA. Nutrient intake among US adults with disabilities. J Hum Nutr Diet 2015; 28(5): 465-475. PubMed
- 4. Bertoli S, Battezzati A, Merati G, Margonato V, Maggioni M, Testolin G, et al. Nutritional status and dietary patterns in disabled people. Nutr Metab Cardiovasc Dis 2006; 16(2): 100-112. ArticlePubMed
- 5. An R, Chiu CY, Andrade F. Nutrient intake and use of dietary supplements among US adults with disabilities. Disabil Health J 2015; 8(2): 240-249. ArticlePubMed
- 6. Park JE, Kim SY, Park JH. Inadequate nutrient intake in people with disabilities: national representative sample in Korea. Eur J Public Health 2023; 33(Suppl 2): ckad160.767.ArticlePMCPDF
- 7. Schwartz N, Buliung R, Wilson K. Disability and food access and insecurity: a scoping review of the literature. Health Place 2019; 57: 107-121. ArticlePubMed
- 8. Moore R, Dada S, Emmambux MN, Samuels A. Food and nutrition security in persons with disabilities. A scoping review. Glob Food Secur 2021; 31: 100581.Article
- 9. Schwartz N, Buliung R, Wilson K. Experiences of food access among disabled adults in Toronto, Canada. Disabil Soc 2021; 38(4): 610-634. Article
- 10. Park JE, Kim SY, Kim SH, Jeoung EJ, Park JH. Household food insecurity: comparison between families with and without members with disabilities. Int J Environ Res Public Health 2020; 17(17): 6149.ArticlePubMedPMC
- 11. Kolset SO, Nordstrøm M, Hope S, Retterstøl K, Iversen PO. Securing rights and nutritional health for persons with intellectual disabilities - a pressing challenge. Food Nutr Res 2018; 62: 1268.ArticleLink
- 12. Ptomey LT, Wittenbrook W. Position of the Academy of Nutrition and Dietetics: nutrition services for individuals with intellectual and developmental disabilities and special health care needs. J Acad Nutr Diet 2015; 115(4): 593-608. ArticlePubMed
- 13. Humphries K, Traci MA, Seekins T. Nutrition and adults with intellectual or developmental disabilities: systematic literature review results. Intellect Dev Disabil 2009; 47(3): 163-185. ArticlePubMedPDF
- 14. Koritsas S, Iacono T. Weight, nutrition, food choice, and physical activity in adults with intellectual disability. J Intellect Disabil Res 2016; 60(4): 355-364. ArticlePubMedLink
- 15. Hoey E, Staines A, Walsh D, Corby D, Bowers K, Belton S, et al. An examination of the nutritional intake and anthropometric status of individuals with intellectual disabilities: results from the SOPHIE study. J Intellect Disabil 2017; 21(4): 346-365. ArticlePubMedLink
- 16. Jung CS, Kim DW. Assessment of nutritional status and annual changes in biochemical indicators according to long-term food intake in individuals with intellectual disabilities living in welfare facilities. Culin Sci Hospitality Res 2018; 24(4): 52-62.
- 17. Ahn MY, Moon HW, Chung HY, Park YK. Nutrient and carotenoid intakes and dietary habits in mentally disabled adults. Korean J Community Nutr 2015; 20(3): 208-219. Article
- 18. Park JE, Kim YJ, Kim SY, Park JH. The needs and prioritization of nutrition and dietary support for individuals with disabilities: an exploratory study. Korean J Community Nutr 2024; 29(5): 431-443. ArticlePubMedPMCPDF
- 19. Kim HJ, Kim TY, Lee HS. User guide for the Disability and Life Dynamics Panel (1st-3rd waves). Korea Disabled People’s Development Institute; 2022.
- 20. Hoe M. Exploring latent trajectory classes of change in depression measured using CES-D. Korean J Soc Welf 2014; 66(1): 307-331. Article
- 21. White JV, Dwyer JT, Posner BM, Ham RJ, Lipschitz DA, Wellman NS. Nutrition screening initiative: development and implementation of the public awareness checklist and screening tools. J Am Diet Assoc 1992; 92(2): 163-167. ArticlePubMed
- 22. Posner BM, Jette AM, Smith KW, Miller DR. Nutrition and health risks in the elderly: the nutrition screening initiative. Am J Public Health 1993; 83(7): 972-978. ArticlePubMedPMC
- 23. Moon HK, Kong JE. Reliability of nutritional screening using DETERMINE checklist for elderly in Korean rural areas by season. Korean J Commun Nutr 2009; 14(3): 340-353.
- 24. Park JH, Hwang HY, Chun YE. Factors associaated with nutritional risk in the elderly: focusing on ADL/IADL. Asia-Pac J Converg Res Interchange 2023; 9(11): 549-562. Article
- 25. Lee SE. Nutritional risk factors in community-dwelling older living alone: a comparison between young-old and old-old. J Korea Acad Ind Coop Soc 2024; 25(7): 194-202. Article
- 26. Groce N, Challenger E, Berman-Bieler R, Farkas A, Yilmaz N, Schultink W, et al. Malnutrition and disability: unexplored opportunities for collaboration. Paediatr Int Child Health 2014; 34(4): 308-314. ArticlePubMedPMC
- 27. Nishioka S, Wakabayashi H. Interaction between malnutrition and physical disability in older adults: is there a malnutrition-disability cycle? Nutr Rev 2023; 81(2): 191-205. ArticlePubMedPDF
- 28. Kalantar-Zadeh K, Fouque D. Nutritional management of chronic kidney disease. N Engl J Med 2017; 377(18): 1765-1776. ArticlePubMed
- 29. Kida K, Miyajima I, Suzuki N, Greenberg BH, Akashi YJ. Nutritional management of heart failure. J Cardiol 2023; 81(3): 283-291. ArticlePubMed
- 30. Michońska I, Polak-Szczybyło E, Sokal A, Jarmakiewicz-Czaja S, Stępień AE, Dereń K. Nutritional issues faced by patients with intestinal stoma: a narrative review. J Clin Med 2023; 12(2): 510.ArticlePubMedPMC
- 31. Kim G, Hwang M, Lee S, Park YH. Malnutrition and its associated factors among community-dwelling older men living alone. Nutr Res Pract 2024; 18(3): 400-411. ArticlePubMedPMCLink
- 32. Ramón-Arbués E, Granada-López JM, Martínez-Abadía B, Echániz-Serrano E, Antón-Solanas I, Jerue BA. Factors related to diet quality: a cross-sectional study of 1055 university students. Nutrients 2021; 13(10): 3512.ArticlePubMedPMC
- 33. Alem AZ, Yeshaw Y, Liyew AM, Tessema ZT, Worku MG, Tesema GA, et al. Double burden of malnutrition and its associated factors among women in low and middle income countries: findings from 52 nationally representative data. BMC Public Health 2023; 23(1): 1479.ArticlePubMedPMCPDF
- 34. Jeon H. A study on longitudinal relationship between income and health among the individuals with disabilities: focusing on age differences. Disabil Employ 2014; 24(4): 50-70. Article
REFERENCES
Figure & Data
REFERENCES
Citations
Citations to this article as recorded by 
 Cite
Cite- Figure
-
- We recommend
- Related articles
-
- Association between nutrient intake and frailty status in Korean older adults: a cross-sectional study using the 9th (2022–2023) Korea National Health and Nutrition Examination Survey
- The dietary factors associated with sleep duration in postmenopausal middle-aged women: a cross-sectional study using 2019–2023 Korea National Health and Nutrition Examination Survey data
- Trends in growth and nutritional status of Korean toddlers and preschoolers: a cross-sectional study using 2010–2021 Korea National Health and Nutrition Examination Survey data
- Factors associated with malnutrition in demented and non-demented elderly residing in the community of Korea: a cross-sectional descriptive and analytical study
Factors associated with nutritional risk among disabled persons in the Republic of Korea: a cross-sectional study using 2020 Disability and Life Dynamics Panel

Fig. 1. Distribution of nutritional risk by disability type and age among the study population. (A) Participants aged 20–64 years. (B) Participants aged ≥ 65 years. Values are presented as weighted %. Rao-Scott Chi-square tests were used to analyze differences in nutritional risk by disability type.
Fig. 1.
Factors associated with nutritional risk among disabled persons in the Republic of Korea: a cross-sectional study using 2020 Disability and Life Dynamics Panel
| Total | Nutritional risk | P-values |
|||||||
|---|---|---|---|---|---|---|---|---|---|
| Low | Moderate | High | |||||||
| n | Weighted % | n | Weighted % | n | Weighted % | n | Weighted % | ||
| Total | 3,255 | 100 | 2,014 | 62.6 | 649 | 19.8 | 592 | 17.5 | - |
| Sex | |||||||||
| Male | 1,804 | 57.0 | 1,139 | 56.6 | 352 | 55.9 | 313 | 59.6 | 0.587 |
| Female | 1,451 | 43.0 | 875 | 43.4 | 297 | 44.1 | 279 | 40.4 | |
| Living arrangement | |||||||||
| Living alone | 661 | 21.9 | 305 | 16.7 | 148 | 26.5 | 208 | 35.4 | < 0.001 |
| Living with other members | 2,594 | 78.1 | 1,709 | 83.3 | 501 | 73.5 | 384 | 64.6 | |
| Household income | |||||||||
| Q1 (the lowest) | 728 | 21.5 | 355 | 16.7 | 152 | 22.8 | 221 | 36.9 | < 0.001 |
| Q2 | 790 | 23.3 | 452 | 21.7 | 164 | 24.9 | 174 | 27.1 | |
| Q3 | 849 | 27.2 | 568 | 29.9 | 182 | 28.9 | 99 | 15.4 | |
| Q4 (the highest) | 888 | 28.1 | 639 | 31.7 | 151 | 23.4 | 98 | 20.7 | |
| Education | |||||||||
| Middle school graduate or less | 968 | 34.4 | 537 | 32.0 | 205 | 35.6 | 226 | 41.5 | 0.013 |
| High school graduate or higher | 2,287 | 65.6 | 1,477 | 68.0 | 444 | 64.4 | 366 | 58.5 | |
| Multiple disabilities | |||||||||
| Yes | 187 | 4.5 | 98 | 3.5 | 40 | 4.4 | 49 | 8.1 | 0.001 |
| No | 3,068 | 95.5 | 1,916 | 96.5 | 609 | 95.6 | 543 | 91.9 | |
| Chronic disease | |||||||||
| Yes | 1,877 | 59.3 | 948 | 48.9 | 459 | 74.2 | 470 | 79.9 | < 0.001 |
| No | 1,378 | 40.7 | 1,066 | 51.1 | 190 | 25.8 | 122 | 20.1 | |
| Depression | |||||||||
| Yes | 1,551 | 44.8 | 748 | 34.5 | 359 | 51.6 | 444 | 73.8 | < 0.001 |
| No | 1,704 | 55.2 | 1,266 | 65.5 | 290 | 48.4 | 148 | 26.2 | |
| Perceived body weight | |||||||||
| Underweight | 421 | 12.4 | 204 | 10.1 | 84 | 12.0 | 284 | 49.5 | < 0.001 |
| Normal | 2,185 | 68.2 | 1,508 | 75.7 | 393 | 61.0 | 133 | 21.1 | |
| Overweight | 649 | 19.4 | 302 | 14.3 | 172 | 27.0 | 175 | 29.4 | |
| Smoking | |||||||||
| Current smoker |
376 | 12.4 | 191 | 10.4 | 82 | 13.8 | 103 | 17.9 | 0.001 |
| Non-smoker | 2,879 | 87.6 | 1,823 | 89.6 | 567 | 86.2 | 489 | 82.1 | |
| Total | Nutritional risk | P-values |
|||||||
|---|---|---|---|---|---|---|---|---|---|
| Low | Moderate | High | |||||||
| n | Weighted % | n | Weighted % | n | Weighted % | n | Weighted % | ||
| Total | 1,146 | 100 | 638 | 56.8 | 249 | 22.0 | 259 | 21.2 | |
| Sex | |||||||||
| Male | 596 | 54.1 | 350 | 54.1 | 121 | 57.6 | 125 | 50.6 | 0.568 |
| Female | 550 | 45.9 | 288 | 45.9 | 128 | 42.4 | 134 | 49.4 | |
| Living arrangement | |||||||||
| Living alone | 294 | 27.9 | 133 | 22.5 | 59 | 24.1 | 102 | 46.3 | < 0.001 |
| Living with other members | 852 | 72.1 | 505 | 77.5 | 190 | 75.9 | 157 | 53.7 | |
| Household income | |||||||||
| Q1 (the lowest) | 368 | 32.8 | 169 | 25.7 | 68 | 28.9 | 131 | 56.0 | < 0.001 |
| Q2 | 316 | 26.5 | 186 | 28.5 | 77 | 28.2 | 53 | 19.3 | |
| Q3 | 263 | 23.1 | 160 | 26.0 | 59 | 24.2 | 44 | 14.0 | |
| Q4 (the highest) | 199 | 17.6 | 123 | 19.7 | 45 | 18.8 | 31 | 10.8 | |
| Education | |||||||||
| Middle school graduate or less | 736 | 67.3 | 385 | 65.6 | 174 | 69.8 | 177 | 69.6 | 0.601 |
| High school graduate or higher | 410 | 32.7 | 253 | 34.4 | 75 | 30.2 | 82 | 30.4 | |
| Multiple disabilities | |||||||||
| Yes | 79 | 5.5 | 37 | 4.2 | 24 | 9.5 | 18 | 4.8 | 0.052 |
| No | 1,067 | 94.5 | 601 | 95.8 | 225 | 90.5 | 241 | 95.2 | |
| Chronic disease | |||||||||
| Yes | 891 | 77.5 | 446 | 69.6 | 215 | 88.3 | 230 | 87.3 | < 0.001 |
| No | 255 | 22.5 | 192 | 30.4 | 34 | 11.7 | 29 | 12.7 | |
| Depression | |||||||||
| Yes | 597 | 47.4 | 258 | 35.1 | 140 | 50.8 | 199 | 77.0 | < 0.001 |
| No | 549 | 52.6 | 380 | 64.9 | 109 | 49.2 | 60 | 23.0 | |
| Perceived body weight | |||||||||
| Underweight | 207 | 16.1 | 82 | 11.5 | 51 | 20.5 | 74 | 24.2 | < 0.001 |
| Normal | 761 | 69.3 | 479 | 77.4 | 146 | 60.4 | 136 | 57.0 | |
| Overweight | 178 | 14.5 | 77 | 11.2 | 52 | 19.0 | 49 | 18.8 | |
| Smoking | |||||||||
| Current smoker |
80 | 8.9 | 37 | 7.9 | 16 | 8.7 | 27 | 11.6 | 0.531 |
| Non-smoker | 1,066 | 91.1 | 601 | 92.1 | 233 | 91.3 | 232 | 88.4 | |
| Item | 20–64 years | ≥ 65 years | ||||||||
|---|---|---|---|---|---|---|---|---|---|---|
| Total (n = 3,255) | Low risk (n = 2,014) | Moderate risk (n = 649) | High risk (n = 592) | P-values | Total (n = 1,146) | Low risk (n = 638) | Moderate risk (n=249) | High risk (n = 259) | P-values |
|
| I eat fewer than two meals per day | 1.0 | 0.0 | 0.6 | 5.1 | - |
0.2 | 0.0 | 0.2 | 0.8 | - |
| I have an illness or condition that made me change the kind and /or amount of food I eat | 18.7 | 6.3 | 35.9 | 43.6 | < 0.001 | 20.9 | 7.7 | 29.2 | 47.9 | < 0.001 |
| I eat few fruits or vegetables, or milk products | 20.7 | 6.4 | 36.3 | 54.2 | < 0.001 | 23.4 | 4.3 | 41.9 | 55.3 | < 0.001 |
| I have tooth or mouth problems that make it hard for me to eat | 8.5 | 0.9 | 8.2 | 36.0 | < 0.001 | 15.1 | 0.5 | 20.2 | 49.0 | < 0.001 |
| I don’t always have enough money to buy the food I need | 11.8 | 0.0 | 5.7 | 61.0 | -a | 12.4 | 0.0 | 2.9 | 55.2 | - |
| I eat alone most of the time | 34.5 | 14.1 | 62.9 | 75.5 | < 0.001 | 35.2 | 17.0 | 49.6 | 69.0 | < 0.001 |
| I take three or more different prescribed or over-the-counter drugs a day | 21.4 | 5.3 | 36.5 | 62.1 | < 0.001 | 29.7 | 11.5 | 42.8 | 65.0 | < 0.001 |
| Without wanting to, I have lost or gained 5 kg or more in the last six months | 7.4 | 0.8 | 9.3 | 28.7 | < 0.001 | 4.9 | 1.1 | 2.2 | 17.7 | < 0.001 |
| I am not always physically able to shop, cook and/or feed myself | 21.1 | 2.7 | 34.6 | 71.5 | < 0.001 | 26.3 | 3.7 | 40.5 | 72.0 | < 0.001 |
| I have three or more drinks of beer, liquor or wine almost every day | 1.3 | 0.8 | 2.4 | 1.7 | 0.053 | 1.5 | 0.9 | 2.1 | 2.5 | 0.271 |
| Characteristic | Category | 20–64 years | ≥ 65 years | ||||||
|---|---|---|---|---|---|---|---|---|---|
| Moderate risk vs. low risk | High risk vs. low risk | Moderate risk vs. low risk | High risk vs. low risk | ||||||
| OR | 95% CI | OR | 95% CI | OR | 95% CI | OR | 95% CI | ||
| Sex (ref: male) | Female | 0.95 | (0.71–1.26) | 0.83 | (0.60–1.16) | 0.76 | (0.47–1.23) | 0.96 | (0.59–1.56) |
| Living arrangement (ref: living with others) | Living alone | 1.73 | (1.21–2.47) | 2.09 | (1.49–2.94) | 1.15 | (0.68–1.95) | 2.06 | (1.23–3.44) |
| Household income (ref: Q4) | Q1 | 1.29 | (0.85–1.98) | 1.87 | (1.18–2.95) | 0.90 | (0.45–1.82) | 2.21 | (1.12–4.34) |
| Q2 | 1.24 | (0.83–1.84) | 1.20 | (0.76–1.89) | 0.82 | (0.42–1.59) | 0.86 | (0.42–1.76) | |
| Q3 | 1.12 | (0.78–1.62) | 0.61 | (0.38–0.97) | 0.90 | (0.44–1.83) | 0.80 | (0.40–1.60) | |
| Education (ref: high school graduate or higher) | Middle school graduate or less | 0.96 | (0.72–1.29) | 1.11 | (0.81–1.52) | 1.08 | (0.64–1.81) | 0.95 | (0.60–1.50) |
| Disability type (ref: hearing or speech impairment) | Physical disability | 0.85 | (0.56–1.30) | 1.09 | (0.62–1.93) | 2.60 | (1.37–4.93) | 0.84 | (0.43–1.65) |
| Encephalopathy | 1.21 | (0.78–1.87) | 1.46 | (0.85–2.50) | 1.41 | (0.71–2.79) | 1.02 | (0.51–2.03) | |
| Visual impairment | 0.73 | (0.43–1.25) | 1.02 | (0.58–1.81) | 1.35 | (0.67–2.73) | 0.61 | (0.29–1.26) | |
| Intellectual disability or autism | 0.87 | (0.49–1.56) | 0.82 | (0.42–1.63) | 1.66 | (0.32–8.57) | 0.38 | (0.10–1.42) | |
| Mental disability | 0.99 | (0.58–1.67) | 0.91 | (0.46–1.79) | 2.29 | (0.88–5.97) | 1.50 | (0.56–4.02) | |
| Facial deformity or internal organ disability | 1.52 | (1.02–2.27) | 2.21 | (1.31–3.72) | 1.03 | (0.54–1.95) | 0.99 | (0.49–2.01) | |
| Multiple disabilities (ref: no) | Yes | 0.99 | (0.57–1.72) | 1.46 | (0.86–2.50) | 2.15 | (0.90–5.11) | 0.75 | (0.30–1.91) |
| Chronic disease (ref: no) | Yes | 2.53 | (1.89–3.38) | 2.77 | (1.94–3.97) | 2.96 | (1.55–5.62) | 2.82 | (1.51–5.25) |
| Depression (ref: no) | Yes | 1.68 | (1.28–2.21) | 3.93 | (2.84–5.44) | 1.70 | (1.08–2.69) | 5.36 | (3.30–8.70) |
| Perceived body weight (ref: normal) | Underweight | 1.22 | (0.83–1.79) | 2.20 | (1.50–3.24) | 2.46 | (1.36–4.43) | 2.79 | (1.58–4.92) |
| Overweight | 2.24 | (1.58–3.18) | 3.45 | (2.30–5.15) | 1.79 | (1.00–3.19) | 1.52 | (0.80–2.89) | |
| Smoking (ref: no smoker) | Current smoker | 1.32 | (0.88–1.97) | 1.53 | (0.99–2.38) | 1.22 | (0.50–2.97) | 1.71 | (0.82–3.57) |
Table 1. Characteristics of study participants aged 20–64 years by nutritional risk
Including smokers of electronic cigarette.
Table 2. Characteristics of study participants aged ≥ 65 years by nutritional risk
Including smokers of electronic cigarette.
Table 3. Affirmative responses of Nutrition Screening Initiative checklist items among disabled persons by age and nutritional risk
Weighted %. The weighted percentage of people who responded “Yes” for each item.
Table 4. Multivariate multinomial logistic regression models estimating predictors of moderate and high nutritional risk among disabled persons by age
OR, odds ratio; 95% CI, 95% confidence interval.


