
 KSCN
KSCN
Articles
- Page Path
- HOME > Korean J Community Nutr > Volume 31(3); 2026 > Article
-
Research Note
우리 국민의 당류 섭취 양상과 설탕 과다 사용 부담금 -
권성옥1)
 , 김초일2),†
 - Sugar intake from processed foods among Koreans and levy on excessive sugar use: a cross-sectional study
-
Sung Ok Kwon1), Cho-il Kim2),†
-
Korean Journal of Community Nutrition 2026;31(3):287-296.
DOI: https://doi.org/10.5720/kjcn.2026.00199
Published online: June 30, 2026
1)서울대학교 생활과학연구소 연구부교수
2)서울대학교 식품영양학과 특임교수
1)Associate Research Professor, Research Institute of Human Ecology, Seoul National University, Seoul, Korea
2)Invited Professor, Department of Food and Nutrition, Seoul National University, Seoul, Korea
- †Corresponding Author: Cho-il Kim Department of Food and Nutrition, Seoul National University, 1 Gwanak-ro, Gwanak-gu, Seoul 08826, Korea Tel: +82-2-880-9098 Fax: +82-2-884-0305 Email: kimchoil@snu.ac.kr
• Received: June 1, 2026 • Revised: June 23, 2026 • Accepted: June 26, 2026
© 2026 The Korean Society of Community Nutrition
This is an Open-Access article distributed under the terms of the Creative Commons Attribution Non-Commercial License (https://creativecommons.org/licenses/by-nc/4.0) which permits unrestricted non-commercial use, distribution, and reproduction in any medium, provided the original work is properly cited.
- 526 Views
- 28 Download
- 1 Crossref


Abstract
-
Objectives
- Although reduced mean sugar intakes have been reported recently, proportion changes in the Korean population with a sugar intake higher than the World Health Organization (WHO) sugar intake recommendation (WSIR) remain unknown. Therefore, in this study, we analyzed the sugar intake of Koreans to identify trends and prioritize target groups for relevant policy interventions.
-
Methods
- We used dietary intake data from the 8th and 9th Korea National Health and Nutrition Examination Surveys (KNHANES VIII and IX) to derive sugar intake from processed foods (SIPF) in the Korean population. We classified, aggregated and calculated sugar intake from individual foods at the tertiary-level food codes, and assessed SIPF adequacy based on whether it met the WSIR of less than 10% of the total energy intake.
-
Results
- The proportion of the Korean population with an SIPF exceeding the WSIR was 22.7% and 22.4% in KNHANES VIII and IX, respectively. Nevertheless, more than one-third of children, adolescents, and young adults (34.6%–39.1%) showed SIPF higher than the WSIR with the highest proportion of 41.4% registered among school-age girls in KNHANES IX.
-
Conclusion
- While the mean sugar intake of Koreans has decreased slightly since 2019, the proportion of people with SIPF exceeding WSIR is on the rise in school-age children, adolescents, and young adults, implying the necessity of proactive policy responses. As the Korean government discusses fiscal policy design and implementation to moderate the sugar intake of the population in order to promote public health and prevent chronic diseases, it should bear in mind the point emphasized in the WHO guideline as follows: “Changes in health-related outcomes as a result of a fiscal policy are likely to occur in the long term and should therefore be evaluated over a longer term than outcomes such as purchasing and consumption of foods and beverages.”
INTRODUCTION
METHODS
RESULTS
DISCUSSION
-
CONFLICT OF INTEREST
There are no financial or other issues that might lead to conflict of interest.
-
FUNDING
None.
-
DATA AVAILABILITY
Publicly Accessible Repository. The original data presented in the study are openly available in the KNHANES, Korea Disease Control and Prevention at https://knhanes.kdca.go.kr/knhanes/eng/main.do (accessed on 13 January 2026).
NOTES
Fig. 1.Categorization of sugars. Adapted from EFSA Panel on Nutrition, Novel Foods and Food Allergens. (EFSA J 2022; 20(2): e07074) [9].
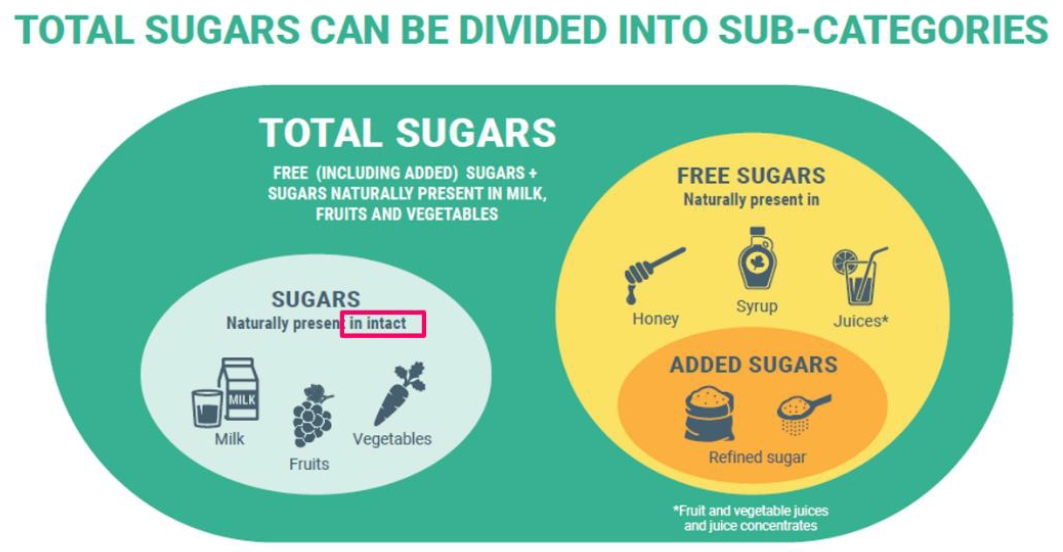
Fig. 2.Proportion (%) of population with sugar intake from processed foods exceeding the World Health Organization recommendation. (A) Comparison by year and KNHANES round in total population. (B) Comparison by age group and KNHANES round in total population. (C) Comparison by age group and KNHANES round in the male population. (D) Comparison by age group and KNHANES round in the female population. KNHANES, Korea National Health and Nutrition Examination Survey.
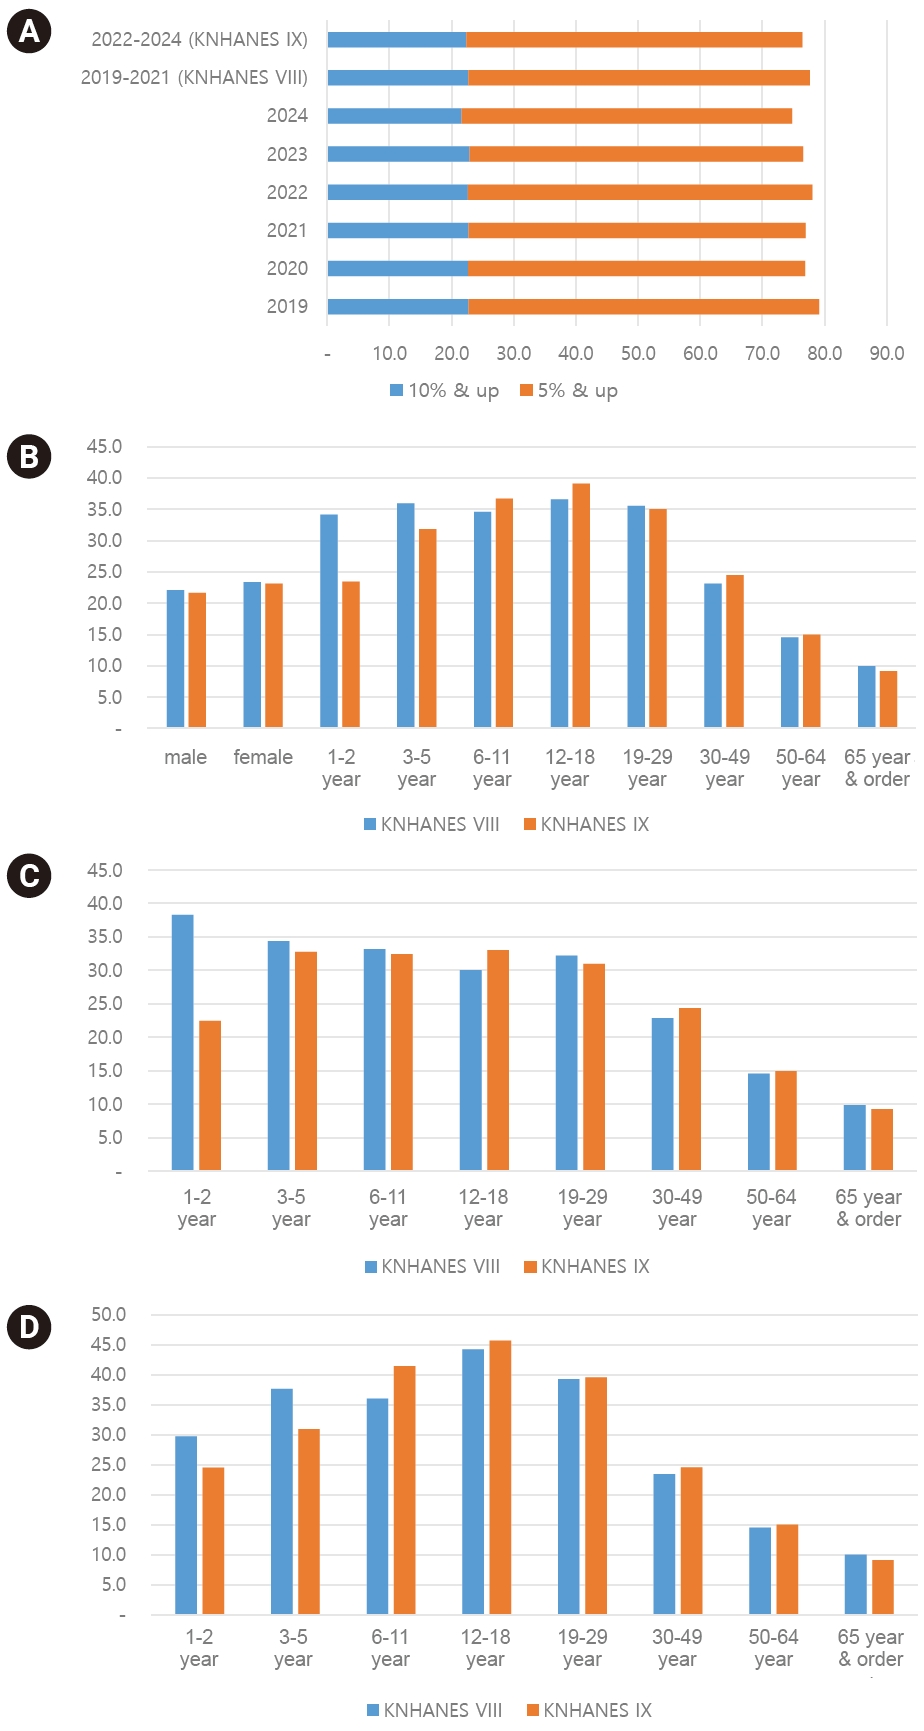
Table 1.Sugar intake among adolescent boys and school-age girls sourced from the KNHANES survey round: mean and distribution
Table 2.Proportion (%) of children with sugar intake from processed foods exceeding the WHO recommendation (2019–2024)
| Group | KNHANES 2019–2024 (year) | Annual percent change (95% CI) | P-value1) | |||||
|---|---|---|---|---|---|---|---|---|
| 2019 | 2020 | 2021 | 2022 | 2023 | 2024 | |||
| 6–11 year, boys | 34.0 | 33.9 | 31.6 | 32.8 | 33.0 | 31.5 | –1.16 (–2.37, –0.06) | 0.036 |
| 6–11 year, girls | 36.8 | 32.1 | 39.1 | 39.5 | 40.5 | 44.5 | 4.43 (1.10, 7.85) | 0.003 |
| 12–18 year, boys | 30.2 | 34.9 | 24.6 | 34.7 | 32.5 | 32.0 | 0.92 (–6.13, 8.93) | 0.769 |
| 12–18 year, girls | 42.3 | 41.0 | 49.3 | 43.8 | 43.6 | 49.1 | 2.20 (–2.38, 7.81) | 0.285 |
Table 3.Sugar intake from top 10 processed foods in school-age children and adolescents
| Rank | 2019–2021 (KNHANES VIII) | 2022–2024 (KNHANES IX) | 2019–2021 (KNHANES VIII) | 2022–2024 (KNHANES IX) | ||||||||||||
|---|---|---|---|---|---|---|---|---|---|---|---|---|---|---|---|---|
| Food1) | Mean (g) | Proportion (%) | Cumulative proportion (%) | Food1) | Mean (g) | Proportion (%) | Cumulative proportion (%) | Food1) | Mean (g) | Proportion (%) | Cumulative proportion (%) | Food1) | Mean (g) | Proportion (%) | Cumulative proportion (%) | |
| School-age boys (6–11 year) | School-age girls (6–11 year) | |||||||||||||||
| 1 | Carbonated beverages | 6.4 | 16.8 | 16.8 | Carbonated beverages | 5.2 | 12.7 | 12.7 | Carbonated beverages | 3.7 | 9.8 | 9.8 | Carbonated beverages | 4.8 | 12.4 | 12.4 |
| 2 | Sherbets | 2.6 | 6.7 | 23.4 | Breads & rolls | 3.2 | 7.9 | 20.6 | Fruit drinks | 2.8 | 7.4 | 17.2 | Breads & rolls | 2.8 | 7.3 | 19.6 |
| 3 | Breads & rolls | 2.5 | 6.6 | 30.0 | Fruit drinks | 3.2 | 7.9 | 28.6 | Ice cream | 2.7 | 7.0 | 24.2 | Jellies | 2.4 | 6.2 | 25.8 |
| 4 | Fruit drinks | 2.4 | 6.2 | 36.3 | Jellies | 2.7 | 6.5 | 35.1 | Sherbets | 2.3 | 6.1 | 30.4 | Fruit drinks | 2.4 | 6.1 | 32.0 |
| 5 | Cookies | 2.1 | 5.6 | 41.9 | Cookies | 2.2 | 5.5 | 40.6 | Cookies | 2.1 | 5.7 | 36.0 | Cookies | 2.1 | 5.3 | 37.3 |
| 6 | Ice cream | 1.8 | 4.7 | 46.5 | Yogurt (curd) | 2.1 | 5.2 | 45.8 | Breads & rolls | 2.1 | 5.5 | 41.6 | Yogurt (curd) | 1.9 | 4.9 | 42.3 |
| 7 | Yogurt (curd) | 1.5 | 3.9 | 50.5 | Yogurt (liquid) | 2.1 | 5.2 | 50.9 | Jellies | 2.0 | 5.4 | 46.9 | Cakes | 1.9 | 4.7 | 47.0 |
| 8 | Jellies | 1.4 | 3.7 | 54.2 | Cakes | 1.7 | 4.2 | 55.2 | Ice milk | 1.8 | 4.7 | 51.6 | Milk | 1.7 | 4.5 | 51.5 |
| 9 | Ice milk | 1.4 | 3.6 | 57.7 | Milk | 1.6 | 3.9 | 59.0 | Yogurt (curd) | 1.7 | 4.6 | 56.2 | Ice cream | 1.5 | 3.9 | 55.4 |
| 10 | Yogurt (liquid) | 1.3 | 3.5 | 61.2 | Ice cream | 1.5 | 3.7 | 62.7 | Milk | 1.5 | 4.0 | 60.2 | Sherbets | 1.4 | 3.6 | 59.0 |
| Adolescent boys (12–18 year) | Adolescent girls (12–18 year) | |||||||||||||||
| 1 | Carbonated beverages | 13.1 | 27.6 | 27.6 | Carbonated beverages | 10.4 | 21.6 | 21.6 | Carbonated beverages | 8.3 | 18.7 | 18.7 | Carbonated beverages | 6.4 | 14.6 | 14.6 |
| 2 | Fruit drinks | 2.7 | 5.7 | 33.3 | Fruit drinks | 3.3 | 6.8 | 28.4 | Fruit drinks | 4.0 | 9.0 | 27.6 | Fruit drinks | 3.9 | 8.9 | 23.4 |
| 3 | Breads & rolls | 2.6 | 5.5 | 38.8 | Breads & rolls | 3.0 | 6.3 | 34.7 | Breads & rolls | 2.7 | 6.0 | 33.7 | Milk | 2.6 | 5.9 | 29.4 |
| 4 | Other sugar-sweetened beverages | 2.1 | 4.4 | 43.2 | Cookies | 2.7 | 5.7 | 40.4 | Yogurt (curd) | 1.9 | 4.2 | 37.9 | Other sugar-sweetened beverages | 2.6 | 5.8 | 35.2 |
| 5 | Kimchi | 1.8 | 3.8 | 47.0 | Other sugar-sweetened beverages | 2.4 | 5.0 | 45.4 | Cookies | 1.8 | 4.1 | 42.0 | Breads & rolls | 2.3 | 5.2 | 40.4 |
| 6 | Cookies | 1.7 | 3.7 | 50.7 | Cakes | 2.3 | 4.9 | 50.2 | Milk | 1.8 | 4.0 | 46.1 | Cakes | 2.2 | 4.9 | 45.3 |
| 7 | Red pepper paste | 1.6 | 3.3 | 54.0 | Milk | 1.7 | 3.6 | 53.8 | Cakes | 1.8 | 4.0 | 50.0 | Cookies | 2.0 | 4.4 | 49.7 |
| 8 | Ice cream | 1.6 | 3.3 | 57.2 | Yogurt (liquid) | 1.5 | 3.1 | 56.9 | Sherbets | 1.8 | 3.9 | 54.0 | Jellies | 1.8 | 4.2 | 53.9 |
| 9 | Yogurt (curd) | 1.5 | 3.2 | 60.4 | Kimchi | 1.4 | 2.9 | 59.8 | Other sugar-sweetened beverages | 1.7 | 3.9 | 57.9 | Yogurt (curd) | 1.6 | 3.6 | 57.5 |
| 10 | Milk | 1.5 | 3.1 | 63.5 | Red pepper paste | 1.3 | 2.6 | 62.4 | Jellies | 1.7 | 3.8 | 61.6 | Ice cream | 1.5 | 3.5 | 61.0 |
Table 4.Sugar intake from top 10 processed foods in older adults
| Rank | 2019–2021 (KNHANES VIII) | 2022–2024 (KNHANES IX) | 2019–2021 (KNHANES VIII) | 2022–2024 (KNHANES IX) | ||||||||||||
|---|---|---|---|---|---|---|---|---|---|---|---|---|---|---|---|---|
| Food1) | Mean (g) | Proportion (%) | Cumulative proportion (%) | Food1) | Mean (g) | Proportion (%) | Cumulative proportion (%) | Food1) | Mean (g) | Proportion (%) | Cumulative proportion (%) | Food1) | Mean (g) | Proportion (%) | Cumulative proportion (%) | |
| Elderly men (65 year & older) | Elderly women (65 year & older) | |||||||||||||||
| 1 | Coffee, with sugar & creamer | 5.3 | 24.2 | 24.2 | Coffee, with sugar & creamer | 4.5 | 19.7 | 19.7 | Coffee, with sugar & creamer | 2.8 | 17.2 | 17.2 | Coffee, with sugar & creamer | 2.5 | 15.4 | 15.4 |
| 2 | Kimchi | 2.2 | 10.1 | 34.3 | Kimchi | 2.6 | 11.5 | 31.2 | Yogurt (curd) | 1.3 | 8.3 | 25.5 | Kimchi | 1.5 | 9.6 | 24.9 |
| 3 | Breads & rolls | 1.6 | 7.5 | 41.8 | Breads & rolls | 1.8 | 8.0 | 39.2 | Kimchi | 1.3 | 8.2 | 33.7 | Yogurt (curd) | 1.2 | 7.6 | 32.5 |
| 4 | Red pepper paste | 1.2 | 5.7 | 47.5 | Red pepper paste | 1.2 | 5.3 | 44.5 | Breads & rolls | 1.2 | 7.5 | 41.2 | Breads & rolls | 1.1 | 7.1 | 39.6 |
| 5 | Carbonated beverages | 1.0 | 4.7 | 52.2 | Yogurt (curd) | 1.1 | 4.7 | 49.1 | Red pepper paste | 0.8 | 4.7 | 45.9 | Soy milk | 1.0 | 6.2 | 45.9 |
| 6 | Yogurt (curd) | 0.9 | 4.3 | 56.5 | Soy milk | 0.9 | 4.1 | 53.3 | Soy milk | 0.7 | 4.5 | 50.4 | Fruit drinks | 0.9 | 5.5 | 51.4 |
| 7 | Cookies | 0.7 | 3.1 | 59.6 | Fruit drinks | 0.8 | 3.6 | 56.9 | Fruit drinks | 0.7 | 4.2 | 54.6 | Red pepper paste | 0.7 | 4.6 | 56.0 |
| 8 | Soy milk | 0.6 | 2.9 | 62.5 | Cookies | 0.7 | 3.2 | 60.1 | Yogurt (liquid) | 0.6 | 3.6 | 58.1 | Carbonated beverages | 0.6 | 3.5 | 59.5 |
| 9 | Fruit drinks | 0.6 | 2.6 | 65.1 | Seasoned soybean paste | 0.6 | 2.8 | 62.9 | Cookies | 0.6 | 3.4 | 61.5 | Yogurt (liquid) | 0.5 | 2.9 | 62.3 |
| 10 | Yogurt (liquid) | 0.5 | 2.4 | 67.5 | Carbonated beverages | 0.6 | 2.5 | 65.5 | Carbonated beverages | 0.5 | 3.0 | 64.5 | Cookies | 0.5 | 2.8 | 65.2 |
- 1. Seoul National University Healthy Culture Project Unit. Brief report (issue 5) [Internet]. Seoul National University Healthy Culture Project Unit; 2026 [cited 2026 May 21]. Available from: https://snu-health.kr/homo100/5
- 2. Korean Law Information Center. National health promotion act [Internet]. Ministry of Government Legislation; 2026 [cited 2026 Mar 11]. Available from: https://www.law.go.kr/%EB%B2%95%EB%A0%B9/%EA%B5%AD%EB%AF%BC%EA%B1%B4%EA%B0%95%EC%A6%9D%EC%A7%84%EB%B2%95
- 3. World Health Organization (WHO). Global report on the use of sugar-sweetened beverage taxes, 2025. WHO; 2025.
- 4. World Health Organization (WHO). Guideline: sugars intake for adults and children. WHO; 2015.
- 5. World Health Organization (WHO). WHO manual on sugar-sweetened beverage taxation policies to promote healthy diets. WHO; 2022.
- 6. World Health Organization (WHO). Fiscal policies to promote healthy diets: WHO guideline. WHO; 2024.
- 7. Ministry of Health and Welfare, The Korean Nutrition Society. Dietary reference intakes for Koreans 2025: energy and macronutrients. Ministry of Health and Welfare; 2025.
- 8. Committee on Medical Aspects of Food Policy. Dietary sugars and human disease: report of the panel on dietary sugars. Her Majesty’s Stationery Office; 1989.
- 9. EFSA Panel on Nutrition, Novel Foods and Food Allergens (NDA), Turck D, Bohn T, Castenmiller J, de Henauw S, Hirsch-Ernst KI, et al. Tolerable upper intake level for dietary sugars. EFSA J 2022; 20(2): e07074. ArticlePubMedPMC
- 10. Yeon S, Kweon S, Oh K. The daily dietary sugar intake in Korea, 2018. Public Health Wkly Rep 2020; 13(7): 359-366.
- 11. Park HK, Lee Y, Kang BW, Kwon KI, Kim JW, Kwon OS, et al. Progress on sodium reduction in South Korea. BMJ Glob Health 2020; 5(5): e002028. ArticlePubMedPMC
- 12. Yoon EK. Current status of Korean sugar intake and reduction policy. Food Ind Nutr 2018; 23(2): 10-13.
- 13. National Institute of Food and Drug Safety Evaluation. 2025 Report on intake of nutrients with possible health hazard (sodium and sugars): focusing on 2019-2023 Korea National Health and Nutrition Examination Survey. National Institute of Food and Drug Safety Evaluation; 2025 June. Report No. 11-1471057-100013-10.
- 14. Ministry of Food and Drug Safety (MFDS). Notice on “Food Standards and Specifications” (No. 2026-40, May 19, 2026) [Internet]. MFDS; 2026 [cited 2026 May 21]. Available from: https://www.mfds.go.kr/brd/m_211/view.do?seq=14971
- 15. Kim CI. Sugar tax? Levy on excessive sugar use? Soda tax? ... What really matters? [Internet]. Korean Society of Community Nutrition; 2026 [cited 2026 May 21]. Available from: https://koscom.or.kr/main/sub.html?Mode=view&boardID=www67&num=1179&page=&keyfield=&key=&bCate=
- 16. Yeon S, Lee J, Yun S, Oh K. Intake of dietary sugar in the Republic of Korea: data from the Korea National Health and Nutrition Examination Survey. Public Health Wkly Rep 2026; 19(5): 253-267.
- 17. Lee HS, Kwon SO, Yon M, Kim D, Lee JY, Nam J, et al. Dietary total sugar intake of Koreans: based on the Korea National Health and Nutrition Examination Survey (KNHANES), 2008-2011. J Nutr Health 2014; 47(4): 268-276. Article
- 18. National Cancer Institute: Division of Cancer Control & Population Sciences. Joinpoint trend analysis software: desktop version, version 6.0.1 [Internet]. National Cancer Institute; 2026 [cited 2026 May 28]. Available from: https://surveillance.cancer.gov/joinpoint/
- 19. World Health Organization (WHO). Use of non-sugar sweeteners: WHO guideline. WHO; 2023.
- 20. Korean Statistical Information Service. Projected population by age group (Korea) [Internet]. Ministry of Data and Statistics; 2023 [cited 2026 May 21]. Available from: https://kosis.kr/statHtml/statHtml.do?sso=ok&returnurl=https%3A%2F%2Fkosis.kr%3A443%2FstatHtml%2FstatHtml.do%3Flist_id%3DA41_10%26obj_var_id%3D%26seqNo%3D%26tblId%3DDT_1BPA003%26vw_cd%3DMT_ETITLE%26language%3Den%26orgId%3D101%26path%3D%252Feng%252FstatisticsList%252FstatisticsListIndex.do%26conn_path%3DMT_ETITLE%26itm_id%3D%26lang_mode%3Den%26scrId%3D%26
- 21. World Health Organization (WHO). Policies to protect children from the harmful impact of food marketing: WHO guideline. WHO; 2023.
- 22. Korean Law Information Center. Special act on safety management of children’s dietary lifestyle [Internet]. Ministry of Government Legislation; 2024 [cited 2026 May 21]. Available from: https://www.law.go.kr/%EB%B2%95%EB%A0%B9/%EC%96%B4%EB%A6%B0%EC%9D%B4%EC%8B%9D%EC%83%9D%ED%99%9C%EC%95%88%EC%A0%84%EA%B4%80%EB%A6%AC%ED%8A%B9%EB%B3%84%EB%B2%95
- 23. Korean Law Information Center. Enforcement decree of the special act on safety management of children’s dietary lifestyle [Internet]. Ministry of Government Legislation; 2010 [cited 2026 May 21]. Available from: https://www.law.go.kr/LSW/lsInfoP.do?lsiSeq=103263&ancYd=20100315&ancNo=22075&efYd=20100319&nwJoYnInfo=N&efGubun=Y&chrClsCd=010202&ancYnChk=0#0000
REFERENCES
Figure & Data
REFERENCES
Citations
Citations to this article as recorded by 
- Estimating added sugars intake among South Koreans: results from the 2023 Korea National Health and Nutrition Examination Survey
Youngmin Nam, Linxi Huang, Cho-il Kim, Jihyun Yoon
Clinical Nutrition Research.2026; 15(3): 139. CrossRef
 Cite
Cite XML Download
- Figure
-
- We recommend
- Related articles
-
- Development of a simplified NOVA-based scoring tool for assessing ultra-processed food consumption among Korean young adults: a cross-sectional study
- The association between sodium index and the risk of obesity in Korean and Chinese university students: a cross-sectional study
- Relationship between self-care and health-related behaviors among Korean adults: a cross-sectional study
- Association of ultra-processed food with diabetes and impaired fasting glucose in elderly populations (urban and rural): a cross-sectional study
- Dietary intake and food sources of essential fatty acids among Korean adolescents: a cross-sectional study based on the 2016–2021 KNHANES data
Sugar intake from processed foods among Koreans and levy on excessive sugar use: a cross-sectional study
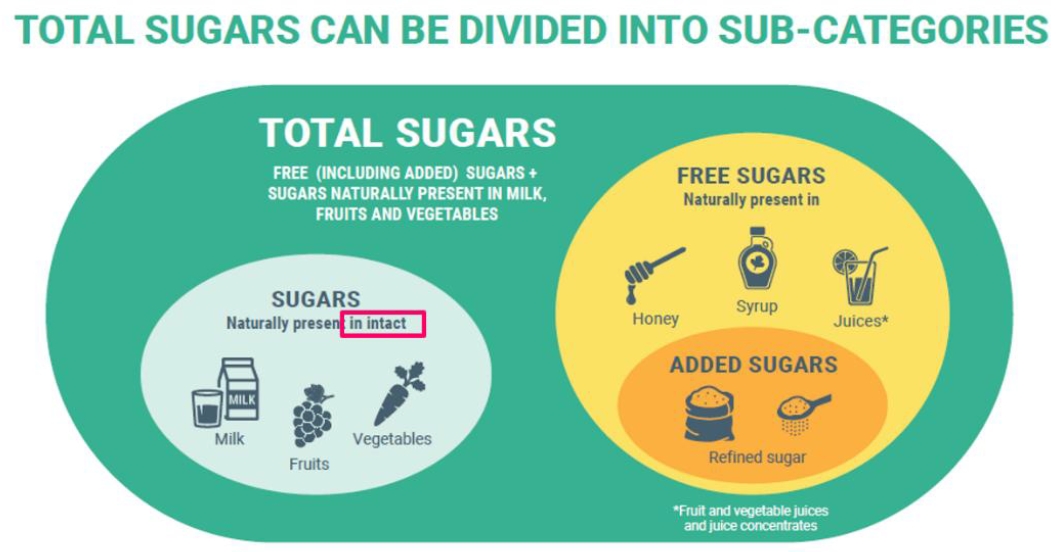
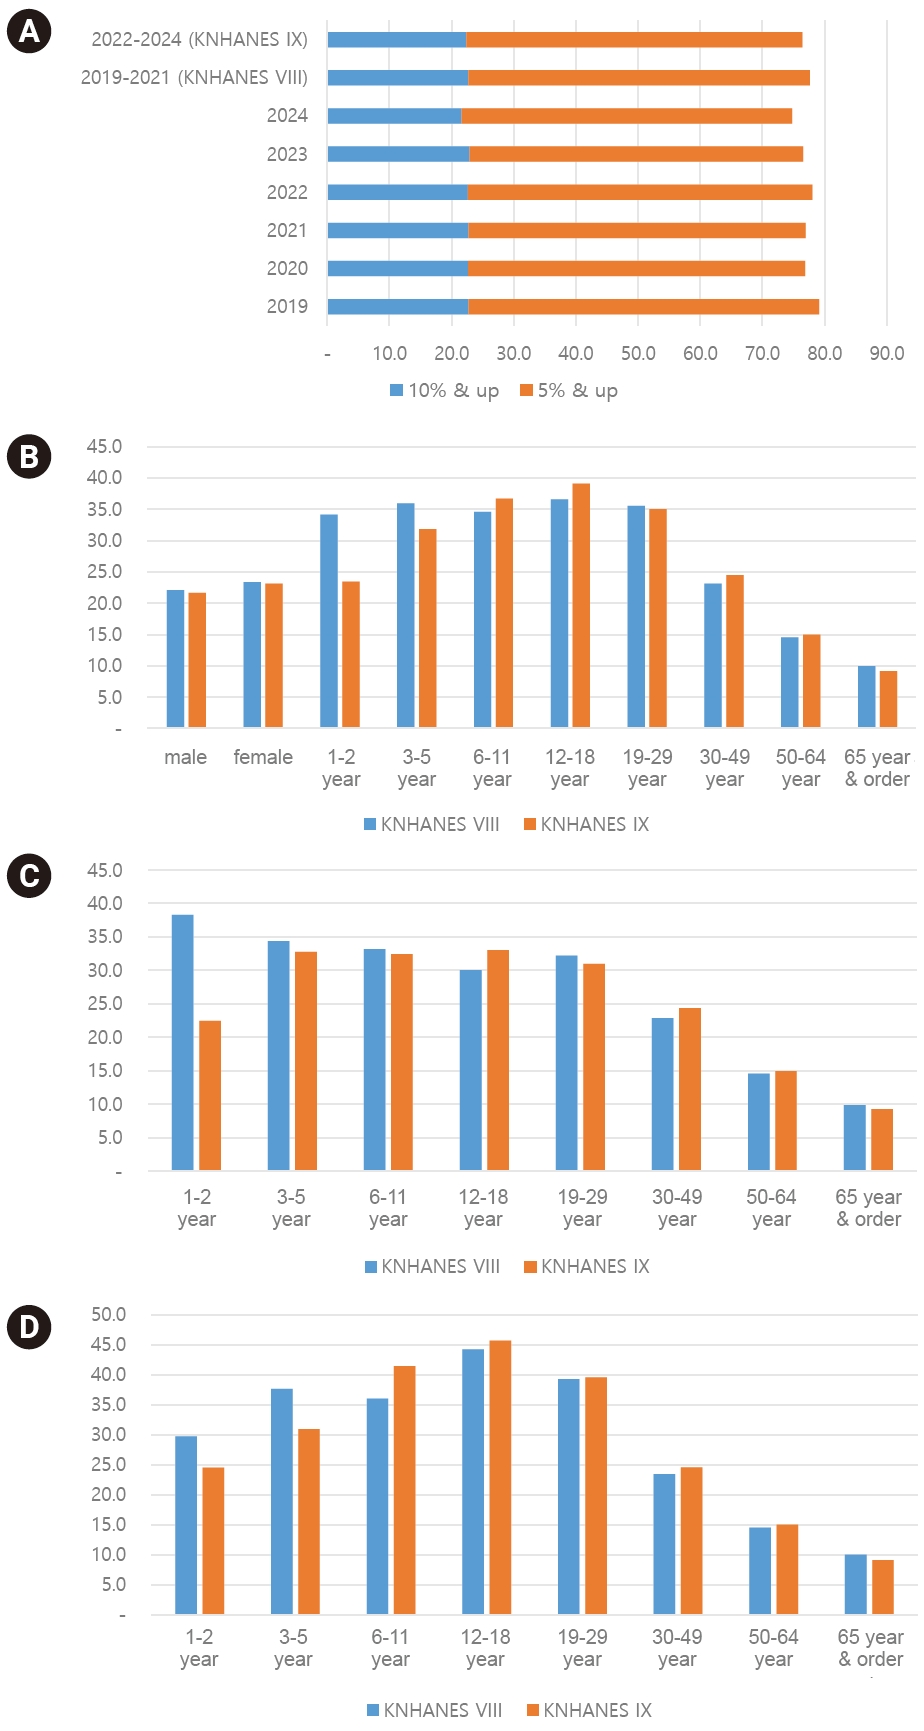
Fig. 1. Categorization of sugars. Adapted from EFSA Panel on Nutrition, Novel Foods and Food Allergens. (EFSA J 2022; 20(2): e07074) [9].
Fig. 2. Proportion (%) of population with sugar intake from processed foods exceeding the World Health Organization recommendation. (A) Comparison by year and KNHANES round in total population. (B) Comparison by age group and KNHANES round in total population. (C) Comparison by age group and KNHANES round in the male population. (D) Comparison by age group and KNHANES round in the female population. KNHANES, Korea National Health and Nutrition Examination Survey.
Fig. 1.
Fig. 2.
Sugar intake from processed foods among Koreans and levy on excessive sugar use: a cross-sectional study
| Survey year (round) | Sugar intake | n | Mean | SE | P5 | P10 | P25 | P50 | P75 | P90 | P95 |
|---|---|---|---|---|---|---|---|---|---|---|---|
| Adolescent boys (12–18 year) | |||||||||||
| 2019–2021 (KNHANES VIII) | Total sugar intake (g) | 617 | 69.36 | 2.57 | 11.76 | 17.97 | 34.48 | 61.77 | 90.73 | 135.32 | 164.69 |
| Sugar intake from processed foods (g) | 617 | 47.30 | 2.35 | 4.21 | 5.94 | 17.59 | 37.18 | 63.33 | 99.06 | 141.39 | |
| Energy contribution of sugar intake from processed foods (%) | 617 | 8.16 | 0.34 | 1.14 | 1.68 | 3.43 | 6.79 | 11.17 | 16.02 | 21.18 | |
| 2022–2024 (KNHANES IX) | Total sugar intake (g) | 554 | 69.93 | 2.39 | 11.42 | 22.62 | 36.39 | 56.60 | 94.61 | 131.61 | 161.67 |
| Sugar intake from processed foods (g) | 554 | 48.19 | 2.12 | 4.63 | 7.62 | 19.03 | 35.73 | 66.41 | 103.95 | 128.81 | |
| Energy contribution of sugar intake from processed foods (%) | 554 | 8.88 | 0.35 | 1.49 | 1.96 | 3.77 | 7.35 | 11.58 | 18.50 | 22.23 | |
| School-age girls (6–11 year) | |||||||||||
| 2019–2021 (KNHANES VIII) | Total sugar intake (g) | 640 | 61.63 | 1.82 | 16.14 | 23.08 | 38.59 | 54.40 | 77.87 | 103.20 | 131.45 |
| Sugar intake from processed foods (g) | 640 | 37.74 | 1.50 | 3.91 | 7.75 | 16.36 | 29.76 | 51.61 | 74.46 | 90.09 | |
| Energy contribution of sugar intake from processed foods (%) | 640 | 9.19 | 0.32 | 1.21 | 2.32 | 4.46 | 7.98 | 12.11 | 16.84 | 21.30 | |
| 2022–2024 (KNHANES IX) | Total sugar intake (g) | 557 | 61.11 | 1.68 | 13.72 | 23.18 | 37.03 | 54.77 | 76.02 | 107.69 | 129.23 |
| Sugar intake from processed foods (g) | 557 | 39.05 | 1.40 | 4.26 | 8.76 | 19.74 | 33.76 | 51.55 | 72.14 | 91.27 | |
| Energy contribution of sugar intake from processed foods (%) | 557 | 9.66 | 0.34 | 1.26 | 2.41 | 5.05 | 8.85 | 13.14 | 17.42 | 21.21 | |
| Group | KNHANES 2019–2024 (year) | Annual percent change (95% CI) | P-value |
|||||
|---|---|---|---|---|---|---|---|---|
| 2019 | 2020 | 2021 | 2022 | 2023 | 2024 | |||
| 6–11 year, boys | 34.0 | 33.9 | 31.6 | 32.8 | 33.0 | 31.5 | –1.16 (–2.37, –0.06) | 0.036 |
| 6–11 year, girls | 36.8 | 32.1 | 39.1 | 39.5 | 40.5 | 44.5 | 4.43 (1.10, 7.85) | 0.003 |
| 12–18 year, boys | 30.2 | 34.9 | 24.6 | 34.7 | 32.5 | 32.0 | 0.92 (–6.13, 8.93) | 0.769 |
| 12–18 year, girls | 42.3 | 41.0 | 49.3 | 43.8 | 43.6 | 49.1 | 2.20 (–2.38, 7.81) | 0.285 |
| Rank | 2019–2021 (KNHANES VIII) | 2022–2024 (KNHANES IX) | 2019–2021 (KNHANES VIII) | 2022–2024 (KNHANES IX) | ||||||||||||
|---|---|---|---|---|---|---|---|---|---|---|---|---|---|---|---|---|
| Food |
Mean (g) | Proportion (%) | Cumulative proportion (%) | Food |
Mean (g) | Proportion (%) | Cumulative proportion (%) | Food |
Mean (g) | Proportion (%) | Cumulative proportion (%) | Food |
Mean (g) | Proportion (%) | Cumulative proportion (%) | |
| School-age boys (6–11 year) | School-age girls (6–11 year) | |||||||||||||||
| 1 | Carbonated beverages | 6.4 | 16.8 | 16.8 | Carbonated beverages | 5.2 | 12.7 | 12.7 | Carbonated beverages | 3.7 | 9.8 | 9.8 | Carbonated beverages | 4.8 | 12.4 | 12.4 |
| 2 | Sherbets | 2.6 | 6.7 | 23.4 | Breads & rolls | 3.2 | 7.9 | 20.6 | Fruit drinks | 2.8 | 7.4 | 17.2 | Breads & rolls | 2.8 | 7.3 | 19.6 |
| 3 | Breads & rolls | 2.5 | 6.6 | 30.0 | Fruit drinks | 3.2 | 7.9 | 28.6 | Ice cream | 2.7 | 7.0 | 24.2 | Jellies | 2.4 | 6.2 | 25.8 |
| 4 | Fruit drinks | 2.4 | 6.2 | 36.3 | Jellies | 2.7 | 6.5 | 35.1 | Sherbets | 2.3 | 6.1 | 30.4 | Fruit drinks | 2.4 | 6.1 | 32.0 |
| 5 | Cookies | 2.1 | 5.6 | 41.9 | Cookies | 2.2 | 5.5 | 40.6 | Cookies | 2.1 | 5.7 | 36.0 | Cookies | 2.1 | 5.3 | 37.3 |
| 6 | Ice cream | 1.8 | 4.7 | 46.5 | Yogurt (curd) | 2.1 | 5.2 | 45.8 | Breads & rolls | 2.1 | 5.5 | 41.6 | Yogurt (curd) | 1.9 | 4.9 | 42.3 |
| 7 | Yogurt (curd) | 1.5 | 3.9 | 50.5 | Yogurt (liquid) | 2.1 | 5.2 | 50.9 | Jellies | 2.0 | 5.4 | 46.9 | Cakes | 1.9 | 4.7 | 47.0 |
| 8 | Jellies | 1.4 | 3.7 | 54.2 | Cakes | 1.7 | 4.2 | 55.2 | Ice milk | 1.8 | 4.7 | 51.6 | Milk | 1.7 | 4.5 | 51.5 |
| 9 | Ice milk | 1.4 | 3.6 | 57.7 | Milk | 1.6 | 3.9 | 59.0 | Yogurt (curd) | 1.7 | 4.6 | 56.2 | Ice cream | 1.5 | 3.9 | 55.4 |
| 10 | Yogurt (liquid) | 1.3 | 3.5 | 61.2 | Ice cream | 1.5 | 3.7 | 62.7 | Milk | 1.5 | 4.0 | 60.2 | Sherbets | 1.4 | 3.6 | 59.0 |
| Adolescent boys (12–18 year) | Adolescent girls (12–18 year) | |||||||||||||||
| 1 | Carbonated beverages | 13.1 | 27.6 | 27.6 | Carbonated beverages | 10.4 | 21.6 | 21.6 | Carbonated beverages | 8.3 | 18.7 | 18.7 | Carbonated beverages | 6.4 | 14.6 | 14.6 |
| 2 | Fruit drinks | 2.7 | 5.7 | 33.3 | Fruit drinks | 3.3 | 6.8 | 28.4 | Fruit drinks | 4.0 | 9.0 | 27.6 | Fruit drinks | 3.9 | 8.9 | 23.4 |
| 3 | Breads & rolls | 2.6 | 5.5 | 38.8 | Breads & rolls | 3.0 | 6.3 | 34.7 | Breads & rolls | 2.7 | 6.0 | 33.7 | Milk | 2.6 | 5.9 | 29.4 |
| 4 | Other sugar-sweetened beverages | 2.1 | 4.4 | 43.2 | Cookies | 2.7 | 5.7 | 40.4 | Yogurt (curd) | 1.9 | 4.2 | 37.9 | Other sugar-sweetened beverages | 2.6 | 5.8 | 35.2 |
| 5 | Kimchi | 1.8 | 3.8 | 47.0 | Other sugar-sweetened beverages | 2.4 | 5.0 | 45.4 | Cookies | 1.8 | 4.1 | 42.0 | Breads & rolls | 2.3 | 5.2 | 40.4 |
| 6 | Cookies | 1.7 | 3.7 | 50.7 | Cakes | 2.3 | 4.9 | 50.2 | Milk | 1.8 | 4.0 | 46.1 | Cakes | 2.2 | 4.9 | 45.3 |
| 7 | Red pepper paste | 1.6 | 3.3 | 54.0 | Milk | 1.7 | 3.6 | 53.8 | Cakes | 1.8 | 4.0 | 50.0 | Cookies | 2.0 | 4.4 | 49.7 |
| 8 | Ice cream | 1.6 | 3.3 | 57.2 | Yogurt (liquid) | 1.5 | 3.1 | 56.9 | Sherbets | 1.8 | 3.9 | 54.0 | Jellies | 1.8 | 4.2 | 53.9 |
| 9 | Yogurt (curd) | 1.5 | 3.2 | 60.4 | Kimchi | 1.4 | 2.9 | 59.8 | Other sugar-sweetened beverages | 1.7 | 3.9 | 57.9 | Yogurt (curd) | 1.6 | 3.6 | 57.5 |
| 10 | Milk | 1.5 | 3.1 | 63.5 | Red pepper paste | 1.3 | 2.6 | 62.4 | Jellies | 1.7 | 3.8 | 61.6 | Ice cream | 1.5 | 3.5 | 61.0 |
| Rank | 2019–2021 (KNHANES VIII) | 2022–2024 (KNHANES IX) | 2019–2021 (KNHANES VIII) | 2022–2024 (KNHANES IX) | ||||||||||||
|---|---|---|---|---|---|---|---|---|---|---|---|---|---|---|---|---|
| Food |
Mean (g) | Proportion (%) | Cumulative proportion (%) | Food |
Mean (g) | Proportion (%) | Cumulative proportion (%) | Food |
Mean (g) | Proportion (%) | Cumulative proportion (%) | Food |
Mean (g) | Proportion (%) | Cumulative proportion (%) | |
| Elderly men (65 year & older) | Elderly women (65 year & older) | |||||||||||||||
| 1 | Coffee, with sugar & creamer | 5.3 | 24.2 | 24.2 | Coffee, with sugar & creamer | 4.5 | 19.7 | 19.7 | Coffee, with sugar & creamer | 2.8 | 17.2 | 17.2 | Coffee, with sugar & creamer | 2.5 | 15.4 | 15.4 |
| 2 | Kimchi | 2.2 | 10.1 | 34.3 | Kimchi | 2.6 | 11.5 | 31.2 | Yogurt (curd) | 1.3 | 8.3 | 25.5 | Kimchi | 1.5 | 9.6 | 24.9 |
| 3 | Breads & rolls | 1.6 | 7.5 | 41.8 | Breads & rolls | 1.8 | 8.0 | 39.2 | Kimchi | 1.3 | 8.2 | 33.7 | Yogurt (curd) | 1.2 | 7.6 | 32.5 |
| 4 | Red pepper paste | 1.2 | 5.7 | 47.5 | Red pepper paste | 1.2 | 5.3 | 44.5 | Breads & rolls | 1.2 | 7.5 | 41.2 | Breads & rolls | 1.1 | 7.1 | 39.6 |
| 5 | Carbonated beverages | 1.0 | 4.7 | 52.2 | Yogurt (curd) | 1.1 | 4.7 | 49.1 | Red pepper paste | 0.8 | 4.7 | 45.9 | Soy milk | 1.0 | 6.2 | 45.9 |
| 6 | Yogurt (curd) | 0.9 | 4.3 | 56.5 | Soy milk | 0.9 | 4.1 | 53.3 | Soy milk | 0.7 | 4.5 | 50.4 | Fruit drinks | 0.9 | 5.5 | 51.4 |
| 7 | Cookies | 0.7 | 3.1 | 59.6 | Fruit drinks | 0.8 | 3.6 | 56.9 | Fruit drinks | 0.7 | 4.2 | 54.6 | Red pepper paste | 0.7 | 4.6 | 56.0 |
| 8 | Soy milk | 0.6 | 2.9 | 62.5 | Cookies | 0.7 | 3.2 | 60.1 | Yogurt (liquid) | 0.6 | 3.6 | 58.1 | Carbonated beverages | 0.6 | 3.5 | 59.5 |
| 9 | Fruit drinks | 0.6 | 2.6 | 65.1 | Seasoned soybean paste | 0.6 | 2.8 | 62.9 | Cookies | 0.6 | 3.4 | 61.5 | Yogurt (liquid) | 0.5 | 2.9 | 62.3 |
| 10 | Yogurt (liquid) | 0.5 | 2.4 | 67.5 | Carbonated beverages | 0.6 | 2.5 | 65.5 | Carbonated beverages | 0.5 | 3.0 | 64.5 | Cookies | 0.5 | 2.8 | 65.2 |
Table 1. Sugar intake among adolescent boys and school-age girls sourced from the KNHANES survey round: mean and distribution
KNHANES, Korea Health and Nutrition Examination Survey; SE, standard error; P, percentile.
Table 2. Proportion (%) of children with sugar intake from processed foods exceeding the WHO recommendation (2019–2024)
WHO, World Health Organization; KNHANES, Korea Health and Nutrition Examination Survey; CI, confidence interval.
Table 3. Sugar intake from top 10 processed foods in school-age children and adolescents
KNHANES, Korea Health and Nutrition Examination Survey. Foods are classified at the tertiary food code level.
Table 4. Sugar intake from top 10 processed foods in older adults
KNHANES, Korea Health and Nutrition Examination Survey. Foods are classified at the tertiary food code level.



